Immigrants from Bahamas Disability Age 5 to 17
COMPARE
Immigrants from Bahamas
Select to Compare
Disability Age 5 to 17
Immigrants from Bahamas Disability Age 5 to 17
6.2%
DISABILITY | AGE 5 TO 17
0.0/ 100
METRIC RATING
297th/ 347
METRIC RANK
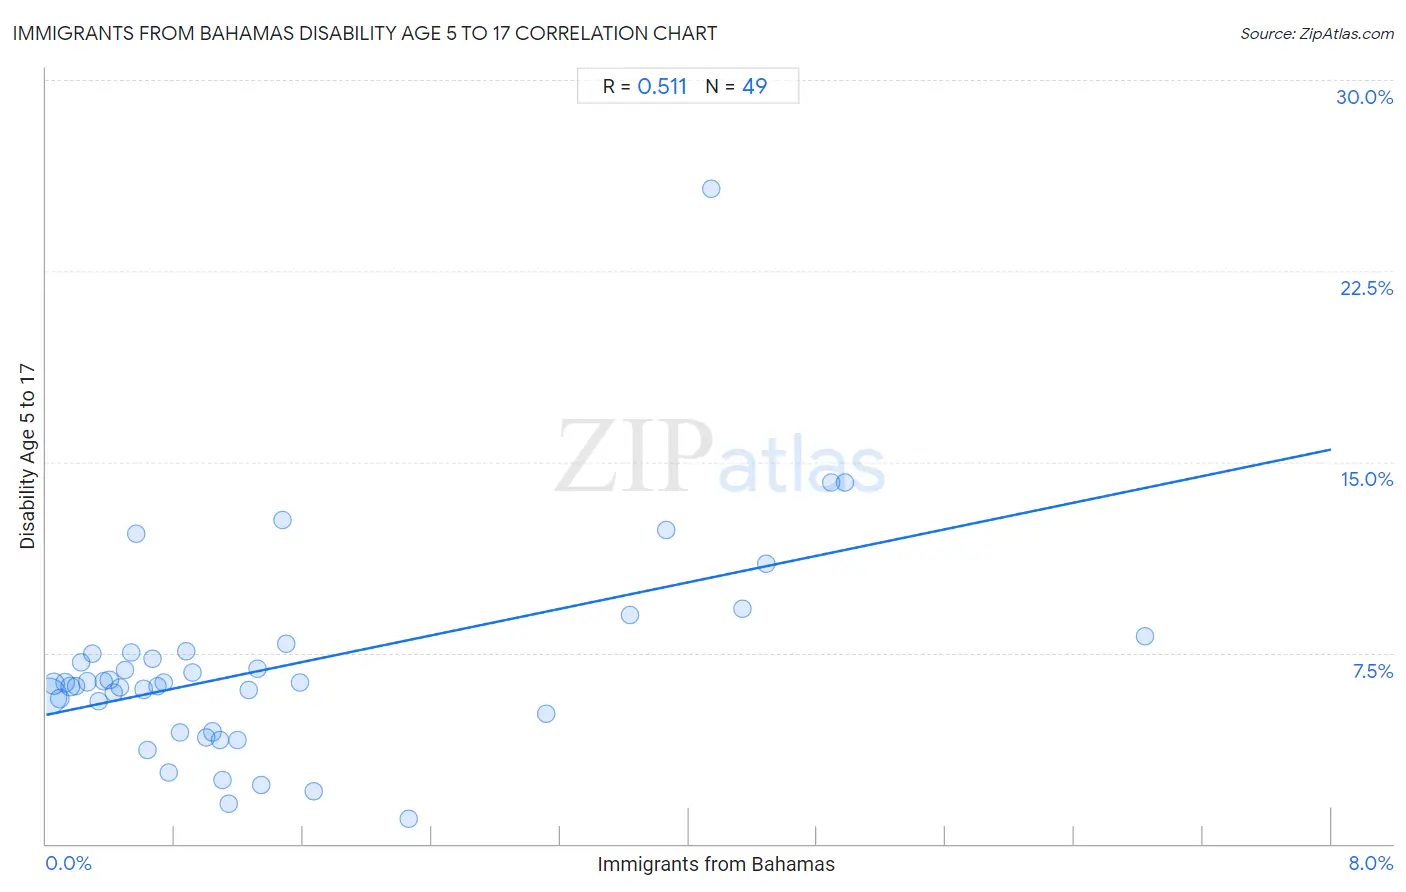
Immigrants from Bahamas Disability Age 5 to 17 Correlation Chart
The statistical analysis conducted on geographies consisting of 104,453,975 people shows a substantial positive correlation between the proportion of Immigrants from Bahamas and percentage of population with a disability between the ages 5 and 17 in the United States with a correlation coefficient (R) of 0.511 and weighted average of 6.2%. On average, for every 1% (one percent) increase in Immigrants from Bahamas within a typical geography, there is an increase of 1.3% in percentage of population with a disability between the ages 5 and 17.
It is essential to understand that the correlation between the percentage of Immigrants from Bahamas and percentage of population with a disability between the ages 5 and 17 does not imply a direct cause-and-effect relationship. It remains uncertain whether the presence of Immigrants from Bahamas influences an upward or downward trend in the level of percentage of population with a disability between the ages 5 and 17 within an area, or if Immigrants from Bahamas simply ended up residing in those areas with higher or lower levels of percentage of population with a disability between the ages 5 and 17 due to other factors.
Demographics Similar to Immigrants from Bahamas by Disability Age 5 to 17
In terms of disability age 5 to 17, the demographic groups most similar to Immigrants from Bahamas are Lumbee (6.2%, a difference of 0.070%), Spanish American (6.2%, a difference of 0.12%), Cree (6.2%, a difference of 0.15%), Welsh (6.3%, a difference of 0.22%), and Carpatho Rusyn (6.3%, a difference of 0.34%).
| Demographics | Rating | Rank | Disability Age 5 to 17 |
| Immigrants from Congo | 0.0 /100 | #290 | Tragic 6.2% |
| Whites/Caucasians | 0.0 /100 | #291 | Tragic 6.2% |
| Immigrants from Senegal | 0.0 /100 | #292 | Tragic 6.2% |
| Central American Indians | 0.0 /100 | #293 | Tragic 6.2% |
| Irish | 0.0 /100 | #294 | Tragic 6.2% |
| Cree | 0.0 /100 | #295 | Tragic 6.2% |
| Spanish Americans | 0.0 /100 | #296 | Tragic 6.2% |
| Immigrants from Bahamas | 0.0 /100 | #297 | Tragic 6.2% |
| Lumbee | 0.0 /100 | #298 | Tragic 6.2% |
| Welsh | 0.0 /100 | #299 | Tragic 6.3% |
| Carpatho Rusyns | 0.0 /100 | #300 | Tragic 6.3% |
| U.S. Virgin Islanders | 0.0 /100 | #301 | Tragic 6.3% |
| Celtics | 0.0 /100 | #302 | Tragic 6.3% |
| Yakama | 0.0 /100 | #303 | Tragic 6.3% |
| Senegalese | 0.0 /100 | #304 | Tragic 6.3% |
Immigrants from Bahamas Disability Age 5 to 17 Correlation Summary
| Measurement | Immigrants from Bahamas Data | Disability Age 5 to 17 Data |
| Minimum | 0.012% | 0.96% |
| Maximum | 6.8% | 25.7% |
| Range | 6.8% | 24.8% |
| Mean | 1.4% | 6.9% |
| Median | 0.87% | 6.3% |
| Interquartile 25% (IQ1) | 0.41% | 4.7% |
| Interquartile 75% (IQ3) | 1.5% | 7.5% |
| Interquartile Range (IQR) | 1.1% | 2.8% |
| Standard Deviation (Sample) | 1.6% | 4.0% |
| Standard Deviation (Population) | 1.6% | 4.0% |
Correlation Details
| Immigrants from Bahamas Percentile | Sample Size | Disability Age 5 to 17 |
[ 0.0% - 0.5% ] 0.012% | 70,180,016 | 5.8% |
[ 0.0% - 0.5% ] 0.049% | 14,038,984 | 6.3% |
[ 0.0% - 0.5% ] 0.085% | 6,089,082 | 5.7% |
[ 0.0% - 0.5% ] 0.12% | 3,259,236 | 6.3% |
[ 0.0% - 0.5% ] 0.15% | 2,356,100 | 6.2% |
[ 0.0% - 0.5% ] 0.19% | 1,380,404 | 6.2% |
[ 0.0% - 0.5% ] 0.22% | 1,215,464 | 7.1% |
[ 0.0% - 0.5% ] 0.26% | 1,250,791 | 6.4% |
[ 0.0% - 0.5% ] 0.29% | 862,688 | 7.4% |
[ 0.0% - 0.5% ] 0.33% | 495,386 | 5.6% |
[ 0.0% - 0.5% ] 0.36% | 705,551 | 6.4% |
[ 0.0% - 0.5% ] 0.39% | 312,057 | 6.4% |
[ 0.0% - 0.5% ] 0.42% | 104,899 | 5.9% |
[ 0.0% - 0.5% ] 0.46% | 385,203 | 6.1% |
[ 0.0% - 0.5% ] 0.49% | 126,614 | 6.8% |
[ 0.5% - 1.0% ] 0.53% | 191,663 | 7.5% |
[ 0.5% - 1.0% ] 0.56% | 94,921 | 12.2% |
[ 0.5% - 1.0% ] 0.61% | 123,572 | 6.1% |
[ 0.5% - 1.0% ] 0.63% | 170,223 | 3.7% |
[ 0.5% - 1.0% ] 0.66% | 13,411 | 7.3% |
[ 0.5% - 1.0% ] 0.69% | 88,743 | 6.2% |
[ 0.5% - 1.0% ] 0.73% | 135,423 | 6.3% |
[ 0.5% - 1.0% ] 0.76% | 65,202 | 2.8% |
[ 0.5% - 1.0% ] 0.83% | 113,339 | 4.4% |
[ 0.5% - 1.0% ] 0.87% | 45,414 | 7.5% |
[ 0.5% - 1.0% ] 0.91% | 43,529 | 6.7% |
[ 0.5% - 1.0% ] 0.99% | 62,232 | 4.2% |
[ 1.0% - 1.5% ] 1.03% | 104,824 | 4.4% |
[ 1.0% - 1.5% ] 1.08% | 159,944 | 4.1% |
[ 1.0% - 1.5% ] 1.10% | 23,458 | 2.5% |
[ 1.0% - 1.5% ] 1.13% | 2,381 | 1.6% |
[ 1.0% - 1.5% ] 1.19% | 47,470 | 4.1% |
[ 1.0% - 1.5% ] 1.26% | 12,080 | 6.0% |
[ 1.0% - 1.5% ] 1.31% | 5,174 | 6.9% |
[ 1.0% - 1.5% ] 1.34% | 42,156 | 2.3% |
[ 1.0% - 1.5% ] 1.47% | 10,208 | 12.7% |
[ 1.0% - 1.5% ] 1.50% | 14,558 | 7.9% |
[ 1.5% - 2.0% ] 1.58% | 43,099 | 6.3% |
[ 1.5% - 2.0% ] 1.66% | 8,244 | 2.1% |
[ 2.0% - 2.5% ] 2.26% | 2,349 | 0.96% |
[ 3.0% - 3.5% ] 3.11% | 7,385 | 5.1% |
[ 3.5% - 4.0% ] 3.64% | 9,677 | 9.0% |
[ 3.5% - 4.0% ] 3.86% | 18,487 | 12.3% |
[ 4.0% - 4.5% ] 4.14% | 1,714 | 25.7% |
[ 4.0% - 4.5% ] 4.34% | 8,118 | 9.2% |
[ 4.0% - 4.5% ] 4.48% | 15,735 | 11.0% |
[ 4.5% - 5.0% ] 4.89% | 2,190 | 14.2% |
[ 4.5% - 5.0% ] 4.97% | 2,151 | 14.2% |
[ 6.5% - 7.0% ] 6.84% | 2,426 | 8.2% |