Okinawan Disability Age 5 to 17
COMPARE
Okinawan
Select to Compare
Disability Age 5 to 17
Okinawan Disability Age 5 to 17
5.0%
DISABILITY | AGE 5 TO 17
100.0/ 100
METRIC RATING
40th/ 347
METRIC RANK
Okinawan Disability Age 5 to 17 Correlation Chart
The statistical analysis conducted on geographies consisting of 73,585,145 people shows a weak positive correlation between the proportion of Okinawans and percentage of population with a disability between the ages 5 and 17 in the United States with a correlation coefficient (R) of 0.253 and weighted average of 5.0%. On average, for every 1% (one percent) increase in Okinawans within a typical geography, there is an increase of 1.6% in percentage of population with a disability between the ages 5 and 17.
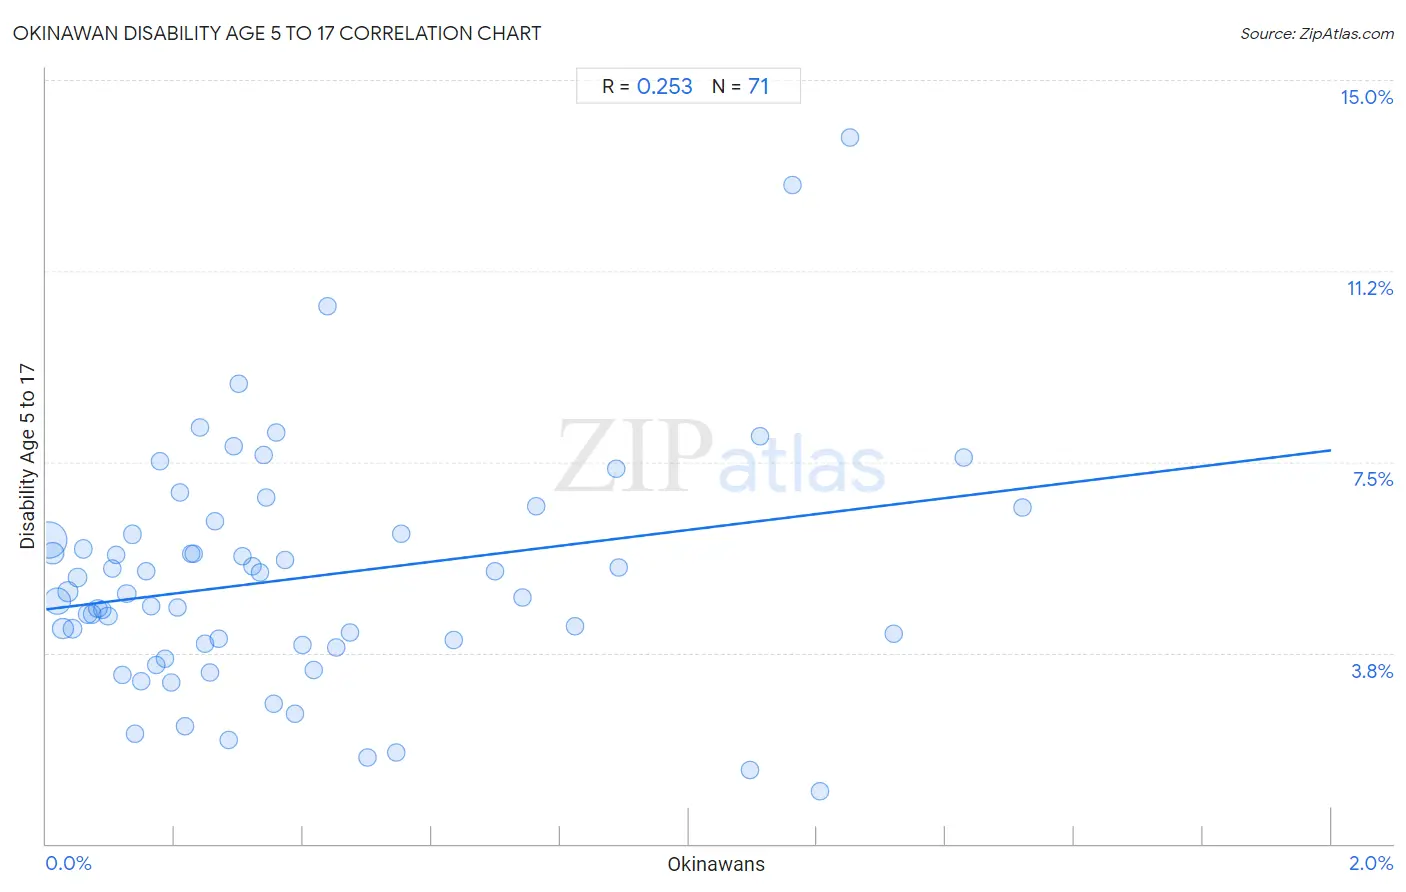
It is essential to understand that the correlation between the percentage of Okinawans and percentage of population with a disability between the ages 5 and 17 does not imply a direct cause-and-effect relationship. It remains uncertain whether the presence of Okinawans influences an upward or downward trend in the level of percentage of population with a disability between the ages 5 and 17 within an area, or if Okinawans simply ended up residing in those areas with higher or lower levels of percentage of population with a disability between the ages 5 and 17 due to other factors.
Demographics Similar to Okinawans by Disability Age 5 to 17
In terms of disability age 5 to 17, the demographic groups most similar to Okinawans are Immigrants from Argentina (5.0%, a difference of 0.080%), Immigrants from Australia (5.0%, a difference of 0.080%), Immigrants from Philippines (5.0%, a difference of 0.090%), Immigrants from Sri Lanka (5.0%, a difference of 0.090%), and Immigrants from Belarus (5.0%, a difference of 0.13%).
| Demographics | Rating | Rank | Disability Age 5 to 17 |
| Immigrants from Indonesia | 100.0 /100 | #33 | Exceptional 5.0% |
| Israelis | 100.0 /100 | #34 | Exceptional 5.0% |
| Bolivians | 100.0 /100 | #35 | Exceptional 5.0% |
| Immigrants from Egypt | 100.0 /100 | #36 | Exceptional 5.0% |
| Immigrants from Belarus | 100.0 /100 | #37 | Exceptional 5.0% |
| Immigrants from Philippines | 100.0 /100 | #38 | Exceptional 5.0% |
| Immigrants from Argentina | 100.0 /100 | #39 | Exceptional 5.0% |
| Okinawans | 100.0 /100 | #40 | Exceptional 5.0% |
| Immigrants from Australia | 100.0 /100 | #41 | Exceptional 5.0% |
| Immigrants from Sri Lanka | 100.0 /100 | #42 | Exceptional 5.0% |
| Immigrants from Russia | 100.0 /100 | #43 | Exceptional 5.0% |
| Egyptians | 100.0 /100 | #44 | Exceptional 5.0% |
| Tongans | 100.0 /100 | #45 | Exceptional 5.0% |
| Assyrians/Chaldeans/Syriacs | 100.0 /100 | #46 | Exceptional 5.0% |
| Vietnamese | 100.0 /100 | #47 | Exceptional 5.1% |
Okinawan Disability Age 5 to 17 Correlation Summary
| Measurement | Okinawan Data | Disability Age 5 to 17 Data |
| Minimum | 0.0040% | 1.0% |
| Maximum | 1.5% | 13.9% |
| Range | 1.5% | 12.8% |
| Mean | 0.40% | 5.2% |
| Median | 0.27% | 4.9% |
| Interquartile 25% (IQ1) | 0.13% | 3.9% |
| Interquartile 75% (IQ3) | 0.50% | 6.1% |
| Interquartile Range (IQR) | 0.37% | 2.2% |
| Standard Deviation (Sample) | 0.38% | 2.3% |
| Standard Deviation (Population) | 0.38% | 2.3% |
Correlation Details
| Okinawan Percentile | Sample Size | Disability Age 5 to 17 |
[ 0.0% - 0.5% ] 0.0040% | 30,210,089 | 6.0% |
[ 0.0% - 0.5% ] 0.011% | 7,687,917 | 5.7% |
[ 0.0% - 0.5% ] 0.018% | 14,495,991 | 4.8% |
[ 0.0% - 0.5% ] 0.026% | 4,603,530 | 4.2% |
[ 0.0% - 0.5% ] 0.034% | 2,764,260 | 5.0% |
[ 0.0% - 0.5% ] 0.041% | 2,067,237 | 4.2% |
[ 0.0% - 0.5% ] 0.050% | 1,874,785 | 5.2% |
[ 0.0% - 0.5% ] 0.058% | 1,431,943 | 5.8% |
[ 0.0% - 0.5% ] 0.064% | 1,144,621 | 4.5% |
[ 0.0% - 0.5% ] 0.072% | 907,373 | 4.5% |
[ 0.0% - 0.5% ] 0.080% | 904,279 | 4.6% |
[ 0.0% - 0.5% ] 0.088% | 527,564 | 4.6% |
[ 0.0% - 0.5% ] 0.096% | 616,846 | 4.5% |
[ 0.0% - 0.5% ] 0.10% | 667,514 | 5.4% |
[ 0.0% - 0.5% ] 0.11% | 418,046 | 5.7% |
[ 0.0% - 0.5% ] 0.12% | 335,446 | 3.3% |
[ 0.0% - 0.5% ] 0.13% | 450,846 | 4.9% |
[ 0.0% - 0.5% ] 0.13% | 189,717 | 6.1% |
[ 0.0% - 0.5% ] 0.14% | 58,463 | 2.2% |
[ 0.0% - 0.5% ] 0.15% | 99,155 | 3.2% |
[ 0.0% - 0.5% ] 0.15% | 121,399 | 5.3% |
[ 0.0% - 0.5% ] 0.16% | 243,448 | 4.7% |
[ 0.0% - 0.5% ] 0.17% | 103,732 | 3.5% |
[ 0.0% - 0.5% ] 0.18% | 82,278 | 7.5% |
[ 0.0% - 0.5% ] 0.18% | 44,575 | 3.6% |
[ 0.0% - 0.5% ] 0.19% | 51,855 | 3.2% |
[ 0.0% - 0.5% ] 0.20% | 22,027 | 4.6% |
[ 0.0% - 0.5% ] 0.21% | 213,562 | 6.9% |
[ 0.0% - 0.5% ] 0.22% | 27,785 | 2.3% |
[ 0.0% - 0.5% ] 0.22% | 122,346 | 5.7% |
[ 0.0% - 0.5% ] 0.23% | 97,387 | 5.7% |
[ 0.0% - 0.5% ] 0.24% | 64,021 | 8.2% |
[ 0.0% - 0.5% ] 0.25% | 23,081 | 3.9% |
[ 0.0% - 0.5% ] 0.26% | 56,295 | 3.4% |
[ 0.0% - 0.5% ] 0.26% | 34,754 | 6.3% |
[ 0.0% - 0.5% ] 0.27% | 79,138 | 4.0% |
[ 0.0% - 0.5% ] 0.28% | 37,928 | 2.0% |
[ 0.0% - 0.5% ] 0.29% | 29,544 | 7.8% |
[ 0.0% - 0.5% ] 0.30% | 21,726 | 9.0% |
[ 0.0% - 0.5% ] 0.31% | 25,544 | 5.6% |
[ 0.0% - 0.5% ] 0.32% | 38,418 | 5.5% |
[ 0.0% - 0.5% ] 0.33% | 20,401 | 5.3% |
[ 0.0% - 0.5% ] 0.34% | 56,263 | 7.6% |
[ 0.0% - 0.5% ] 0.34% | 42,021 | 6.8% |
[ 0.0% - 0.5% ] 0.35% | 29,151 | 2.8% |
[ 0.0% - 0.5% ] 0.36% | 558 | 8.1% |
[ 0.0% - 0.5% ] 0.37% | 4,853 | 5.6% |
[ 0.0% - 0.5% ] 0.39% | 258 | 2.6% |
[ 0.0% - 0.5% ] 0.40% | 28,087 | 3.9% |
[ 0.0% - 0.5% ] 0.42% | 94,355 | 3.4% |
[ 0.0% - 0.5% ] 0.44% | 27,373 | 10.6% |
[ 0.0% - 0.5% ] 0.45% | 41,426 | 3.8% |
[ 0.0% - 0.5% ] 0.47% | 16,067 | 4.2% |
[ 0.0% - 0.5% ] 0.50% | 8,815 | 1.7% |
[ 0.5% - 1.0% ] 0.55% | 8,073 | 1.8% |
[ 0.5% - 1.0% ] 0.55% | 58,158 | 6.1% |
[ 0.5% - 1.0% ] 0.63% | 315 | 4.0% |
[ 0.5% - 1.0% ] 0.70% | 27,212 | 5.4% |
[ 0.5% - 1.0% ] 0.74% | 2,022 | 4.8% |
[ 0.5% - 1.0% ] 0.76% | 46,553 | 6.6% |
[ 0.5% - 1.0% ] 0.82% | 5,593 | 4.3% |
[ 0.5% - 1.0% ] 0.89% | 21,206 | 7.4% |
[ 0.5% - 1.0% ] 0.89% | 3,814 | 5.4% |
[ 1.0% - 1.5% ] 1.10% | 18,077 | 1.4% |
[ 1.0% - 1.5% ] 1.11% | 180 | 8.0% |
[ 1.0% - 1.5% ] 1.16% | 4,474 | 12.9% |
[ 1.0% - 1.5% ] 1.20% | 16,447 | 1.0% |
[ 1.0% - 1.5% ] 1.25% | 1,598 | 13.9% |
[ 1.0% - 1.5% ] 1.32% | 1,364 | 4.1% |
[ 1.0% - 1.5% ] 1.43% | 3,571 | 7.6% |
[ 1.5% - 2.0% ] 1.52% | 395 | 6.6% |