Polish Disability Age 5 to 17
COMPARE
Polish
Select to Compare
Disability Age 5 to 17
Polish Disability Age 5 to 17
5.9%
DISABILITY | AGE 5 TO 17
1.5/ 100
METRIC RATING
250th/ 347
METRIC RANK
Polish Disability Age 5 to 17 Correlation Chart
The statistical analysis conducted on geographies consisting of 547,751,801 people shows a moderate positive correlation between the proportion of Poles and percentage of population with a disability between the ages 5 and 17 in the United States with a correlation coefficient (R) of 0.460 and weighted average of 5.9%. On average, for every 1% (one percent) increase in Poles within a typical geography, there is an increase of 0.17% in percentage of population with a disability between the ages 5 and 17.
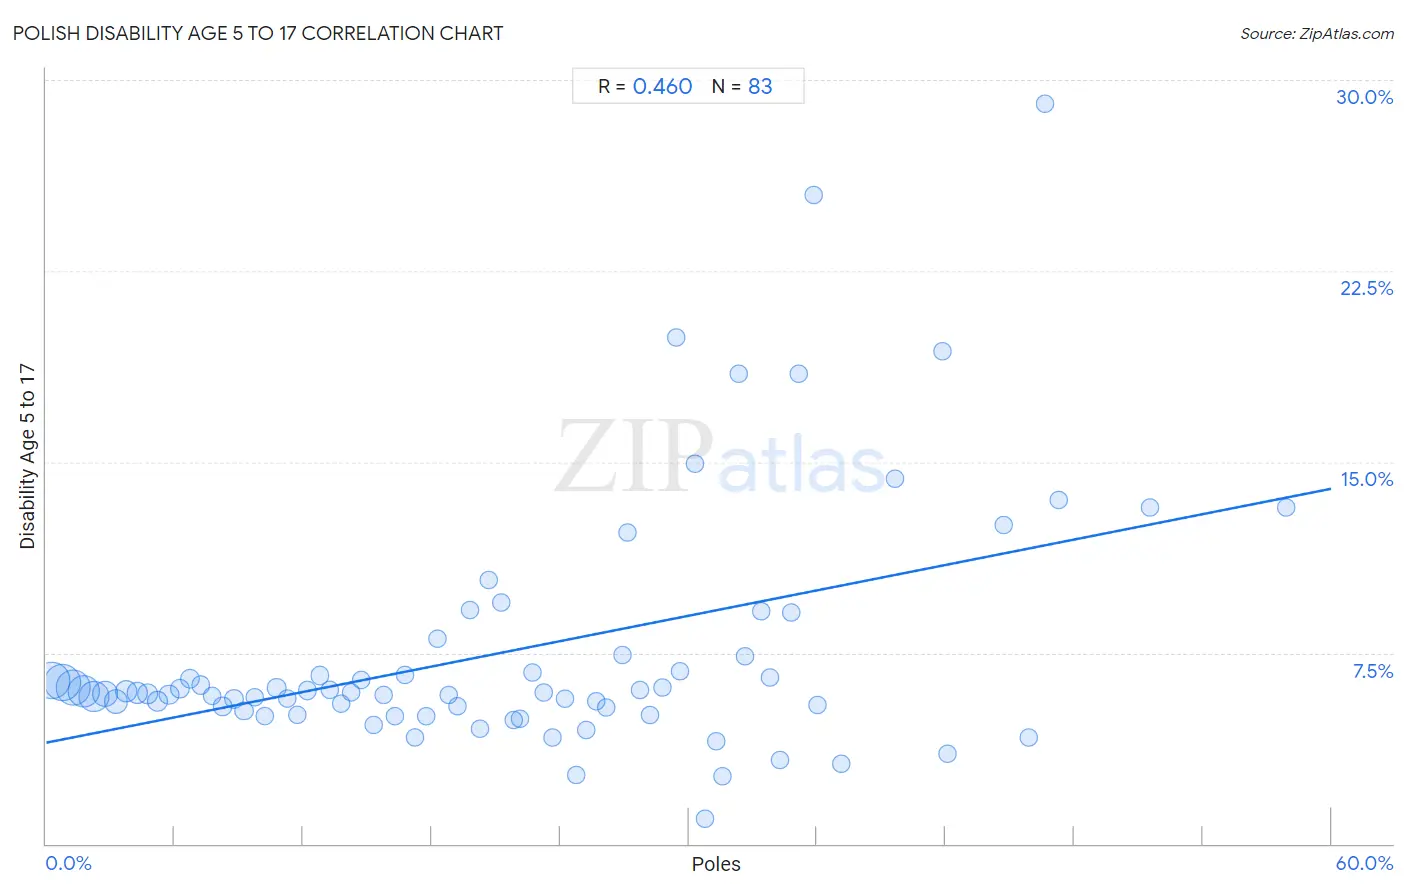
It is essential to understand that the correlation between the percentage of Poles and percentage of population with a disability between the ages 5 and 17 does not imply a direct cause-and-effect relationship. It remains uncertain whether the presence of Poles influences an upward or downward trend in the level of percentage of population with a disability between the ages 5 and 17 within an area, or if Poles simply ended up residing in those areas with higher or lower levels of percentage of population with a disability between the ages 5 and 17 due to other factors.
Demographics Similar to Poles by Disability Age 5 to 17
In terms of disability age 5 to 17, the demographic groups most similar to Poles are Immigrants from Cambodia (5.9%, a difference of 0.020%), Honduran (5.9%, a difference of 0.040%), Scandinavian (5.9%, a difference of 0.11%), Immigrants from Ghana (5.9%, a difference of 0.12%), and British (5.9%, a difference of 0.13%).
| Demographics | Rating | Rank | Disability Age 5 to 17 |
| Indonesians | 2.0 /100 | #243 | Tragic 5.9% |
| Immigrants from Germany | 1.9 /100 | #244 | Tragic 5.9% |
| Immigrants from Micronesia | 1.9 /100 | #245 | Tragic 5.9% |
| Tlingit-Haida | 1.9 /100 | #246 | Tragic 5.9% |
| Immigrants from Honduras | 1.8 /100 | #247 | Tragic 5.9% |
| British | 1.7 /100 | #248 | Tragic 5.9% |
| Immigrants from Ghana | 1.7 /100 | #249 | Tragic 5.9% |
| Poles | 1.5 /100 | #250 | Tragic 5.9% |
| Immigrants from Cambodia | 1.5 /100 | #251 | Tragic 5.9% |
| Hondurans | 1.5 /100 | #252 | Tragic 5.9% |
| Scandinavians | 1.4 /100 | #253 | Tragic 5.9% |
| Barbadians | 1.3 /100 | #254 | Tragic 5.9% |
| Italians | 1.2 /100 | #255 | Tragic 5.9% |
| Hopi | 1.0 /100 | #256 | Tragic 5.9% |
| Hispanics or Latinos | 1.0 /100 | #257 | Tragic 5.9% |
Polish Disability Age 5 to 17 Correlation Summary
| Measurement | Polish Data | Disability Age 5 to 17 Data |
| Minimum | 0.26% | 0.99% |
| Maximum | 57.9% | 29.1% |
| Range | 57.6% | 28.1% |
| Mean | 21.5% | 7.5% |
| Median | 20.7% | 5.9% |
| Interquartile 25% (IQ1) | 10.2% | 5.2% |
| Interquartile 75% (IQ3) | 31.3% | 7.4% |
| Interquartile Range (IQR) | 21.1% | 2.2% |
| Standard Deviation (Sample) | 13.5% | 4.9% |
| Standard Deviation (Population) | 13.4% | 4.9% |
Correlation Details
| Polish Percentile | Sample Size | Disability Age 5 to 17 |
[ 0.0% - 0.5% ] 0.26% | 83,392,427 | 6.4% |
[ 0.5% - 1.0% ] 0.76% | 87,383,986 | 6.3% |
[ 1.0% - 1.5% ] 1.26% | 80,845,098 | 6.1% |
[ 1.5% - 2.0% ] 1.74% | 63,544,004 | 6.0% |
[ 2.0% - 2.5% ] 2.23% | 56,246,801 | 5.8% |
[ 2.5% - 3.0% ] 2.75% | 34,267,564 | 5.9% |
[ 3.0% - 3.5% ] 3.24% | 25,851,441 | 5.6% |
[ 3.5% - 4.0% ] 3.76% | 17,685,686 | 6.0% |
[ 4.0% - 4.5% ] 4.24% | 13,769,475 | 5.9% |
[ 4.5% - 5.0% ] 4.74% | 10,488,595 | 5.9% |
[ 5.0% - 5.5% ] 5.21% | 11,453,988 | 5.6% |
[ 5.5% - 6.0% ] 5.75% | 8,699,070 | 5.9% |
[ 6.0% - 6.5% ] 6.23% | 6,684,301 | 6.1% |
[ 6.5% - 7.0% ] 6.74% | 6,074,565 | 6.5% |
[ 7.0% - 7.5% ] 7.21% | 4,942,594 | 6.2% |
[ 7.5% - 8.0% ] 7.74% | 3,543,319 | 5.8% |
[ 8.0% - 8.5% ] 8.23% | 4,514,248 | 5.4% |
[ 8.5% - 9.0% ] 8.75% | 3,561,258 | 5.7% |
[ 9.0% - 9.5% ] 9.24% | 2,970,736 | 5.2% |
[ 9.5% - 10.0% ] 9.75% | 2,382,567 | 5.7% |
[ 10.0% - 10.5% ] 10.22% | 1,812,644 | 5.0% |
[ 10.5% - 11.0% ] 10.76% | 1,940,335 | 6.1% |
[ 11.0% - 11.5% ] 11.25% | 1,842,701 | 5.7% |
[ 11.5% - 12.0% ] 11.72% | 1,576,295 | 5.1% |
[ 12.0% - 12.5% ] 12.21% | 1,429,921 | 6.0% |
[ 12.5% - 13.0% ] 12.77% | 1,265,582 | 6.6% |
[ 13.0% - 13.5% ] 13.23% | 1,242,524 | 6.1% |
[ 13.5% - 14.0% ] 13.77% | 737,736 | 5.5% |
[ 14.0% - 14.5% ] 14.23% | 1,006,446 | 6.0% |
[ 14.5% - 15.0% ] 14.72% | 620,031 | 6.4% |
[ 15.0% - 15.5% ] 15.27% | 723,528 | 4.6% |
[ 15.5% - 16.0% ] 15.73% | 724,915 | 5.9% |
[ 16.0% - 16.5% ] 16.29% | 803,898 | 5.0% |
[ 16.5% - 17.0% ] 16.74% | 342,370 | 6.6% |
[ 17.0% - 17.5% ] 17.22% | 343,361 | 4.2% |
[ 17.5% - 18.0% ] 17.73% | 358,068 | 5.0% |
[ 18.0% - 18.5% ] 18.25% | 340,837 | 8.0% |
[ 18.5% - 19.0% ] 18.78% | 342,721 | 5.9% |
[ 19.0% - 19.5% ] 19.20% | 166,305 | 5.4% |
[ 19.5% - 20.0% ] 19.77% | 164,495 | 9.2% |
[ 20.0% - 20.5% ] 20.24% | 171,229 | 4.5% |
[ 20.5% - 21.0% ] 20.67% | 44,673 | 10.4% |
[ 21.0% - 21.5% ] 21.23% | 76,554 | 9.5% |
[ 21.5% - 22.0% ] 21.80% | 57,448 | 4.8% |
[ 22.0% - 22.5% ] 22.15% | 139,077 | 4.9% |
[ 22.5% - 23.0% ] 22.72% | 160,550 | 6.7% |
[ 23.0% - 23.5% ] 23.26% | 100,893 | 5.9% |
[ 23.5% - 24.0% ] 23.65% | 35,639 | 4.2% |
[ 24.0% - 24.5% ] 24.22% | 128,840 | 5.7% |
[ 24.5% - 25.0% ] 24.75% | 69,528 | 2.7% |
[ 25.0% - 25.5% ] 25.23% | 114,770 | 4.5% |
[ 25.5% - 26.0% ] 25.66% | 16,815 | 5.6% |
[ 26.0% - 26.5% ] 26.17% | 113,338 | 5.3% |
[ 26.5% - 27.0% ] 26.89% | 37,052 | 7.4% |
[ 27.0% - 27.5% ] 27.15% | 13,199 | 12.2% |
[ 27.5% - 28.0% ] 27.70% | 36,924 | 6.0% |
[ 28.0% - 28.5% ] 28.20% | 11,342 | 5.0% |
[ 28.5% - 29.0% ] 28.76% | 72,525 | 6.1% |
[ 29.0% - 29.5% ] 29.39% | 3,372 | 19.9% |
[ 29.5% - 30.0% ] 29.61% | 6,873 | 6.8% |
[ 30.0% - 30.5% ] 30.32% | 29,652 | 14.9% |
[ 30.5% - 31.0% ] 30.74% | 14,602 | 0.99% |
[ 31.0% - 31.5% ] 31.29% | 79,388 | 4.0% |
[ 31.5% - 32.0% ] 31.58% | 35,208 | 2.7% |
[ 32.0% - 32.5% ] 32.31% | 25,490 | 18.5% |
[ 32.5% - 33.0% ] 32.65% | 22,802 | 7.4% |
[ 33.0% - 33.5% ] 33.40% | 3,168 | 9.2% |
[ 33.5% - 34.0% ] 33.82% | 1,162 | 6.5% |
[ 34.0% - 34.5% ] 34.28% | 5,158 | 3.3% |
[ 34.5% - 35.0% ] 34.80% | 523 | 9.1% |
[ 35.0% - 35.5% ] 35.16% | 1,169 | 18.5% |
[ 35.5% - 36.0% ] 35.82% | 564 | 25.5% |
[ 36.0% - 36.5% ] 36.02% | 422 | 5.4% |
[ 37.0% - 37.5% ] 37.12% | 23,676 | 3.1% |
[ 39.5% - 40.0% ] 39.65% | 1,710 | 14.4% |
[ 41.5% - 42.0% ] 41.84% | 380 | 19.4% |
[ 42.0% - 42.5% ] 42.05% | 2,699 | 3.5% |
[ 44.5% - 45.0% ] 44.70% | 387 | 12.5% |
[ 45.5% - 46.0% ] 45.90% | 2,525 | 4.2% |
[ 46.5% - 47.0% ] 46.61% | 118 | 29.1% |
[ 47.0% - 47.5% ] 47.25% | 3,278 | 13.5% |
[ 51.5% - 52.0% ] 51.56% | 256 | 13.2% |
[ 57.5% - 58.0% ] 57.88% | 387 | 13.2% |