Lumbee Disability Age 5 to 17

COMPARE

Lumbee
Race
Ancestry
AfghanAfricanAlaska NativeAlaskan AthabascanAlbanianAleutAlsatianAmericanApacheArabArapahoArgentineanArmenianAssyrian/Chaldean/SyriacAustralianAustrianBahamianBangladeshiBarbadianBasqueBelgianBelizeanBermudanBhutaneseBlackfeetBolivianBrazilianBritishBritish West IndianBulgarianBurmeseCajunCambodianCanadianCape VerdeanCarpatho RusynCelticCentral AmericanCentral American IndianCherokeeCheyenneChickasawChileanChineseChippewaChoctawColombianColvilleComancheCosta RicanCreeCreekCroatianCrowCubanCypriotCzechCzechoslovakianDanishDelawareDominicanDutchDutch West IndianEastern EuropeanEcuadorianEgyptianEnglishEstonianEthiopianEuropeanFijianFilipinoFinnishFrenchFrench American IndianFrench CanadianGermanGerman RussianGhanaianGreekGuamanian/ChamorroGuatemalanGuyaneseHaitianHmongHonduranHopiHoumaHungarianIcelanderIndian (Asian)IndonesianInupiatIranianIraqiIrishIroquoisIsraeliItalianJamaicanJapaneseJordanianKenyanKiowaKoreanLaotianLatvianLebaneseLiberianLithuanianLumbeeLuxembourgerMacedonianMalaysianMalteseMarshalleseMenomineeMexicanMexican American IndianMongolianMoroccanNative HawaiianNavajoNepaleseNew ZealanderNicaraguanNigerianNorthern EuropeanNorwegianOkinawanOsageOttawaPaiutePakistaniPalestinianPanamanianParaguayanPennsylvania GermanPeruvianPimaPolishPortuguesePotawatomiPuebloPuerto RicanPuget Sound SalishRomanianRussianSalvadoranSamoanScandinavianScotch-IrishScottishSeminoleSenegaleseSerbianShoshoneSierra LeoneanSiouxSlavicSlovakSloveneSomaliSouth AfricanSouth AmericanSouth American IndianSoviet UnionSpaniardSpanishSpanish AmericanSpanish American IndianSri LankanSubsaharan AfricanSudaneseSwedishSwissSyrianTaiwaneseThaiTlingit-HaidaTohono O'OdhamTonganTrinidadian and TobagonianTsimshianTurkishU.S. Virgin IslanderUgandanUkrainianUruguayanUteVenezuelanVietnameseWelshWest IndianYakamaYaquiYugoslavianYumanYup'ikZimbabwean
Immigration
NonimmigrantsImmigrantsAfghanistanAfricaAlbaniaArgentinaArmeniaAsiaAustraliaAustriaBahamasBangladeshBarbadosBelarusBelgiumBelizeBoliviaBosnia and HerzegovinaBrazilBulgariaBurma/MyanmarCabo VerdeCambodiaCameroonCanadaCaribbeanCentral AmericaChileChinaColombiaCongoCosta RicaCroatiaCubaCzechoslovakiaDenmarkDominicaDominican RepublicEastern AfricaEastern AsiaEastern EuropeEcuadorEgyptEl SalvadorEnglandEritreaEthiopiaEuropeFijiFranceGermanyGhanaGreeceGrenadaGuatemalaGuyanaHaitiHondurasHong KongHungaryIndiaIndonesiaIranIraqIrelandIsraelItalyJamaicaJapanJordanKazakhstanKenyaKoreaKuwaitLaosLatin AmericaLatviaLebanonLiberiaLithuaniaMalaysiaMexicoMicronesiaMiddle AfricaMoldovaMoroccoNepalNetherlandsNicaraguaNigeriaNorth AmericaNorth MacedoniaNorthern AfricaNorthern EuropeNorwayOceaniaPakistanPanamaPeruPhilippinesPolandPortugalRomaniaRussiaSaudi ArabiaScotlandSenegalSerbiaSierra LeoneSingaporeSomaliaSouth AfricaSouth AmericaSouth Central AsiaSouth Eastern AsiaSouthern EuropeSpainSri LankaSt. Vincent and the GrenadinesSudanSwedenSwitzerlandSyriaTaiwanThailandTrinidad and TobagoTurkeyUgandaUkraineUruguayUzbekistanVenezuelaVietnamWest IndiesWestern AfricaWestern AsiaWestern EuropeYemenZaireZimbabweAzores
Select to Compare
Race
Ancestry
AfghanAfricanAlaska NativeAlaskan AthabascanAlbanianAleutAlsatianAmericanApacheArabArapahoArgentineanArmenianAssyrian/Chaldean/SyriacAustralianAustrianBahamianBangladeshiBarbadianBasqueBelgianBelizeanBermudanBhutaneseBlackfeetBolivianBrazilianBritishBritish West IndianBulgarianBurmeseCajunCambodianCanadianCape VerdeanCarpatho RusynCelticCentral AmericanCentral American IndianCherokeeCheyenneChickasawChileanChineseChippewaChoctawColombianColvilleComancheCosta RicanCreeCreekCroatianCrowCubanCypriotCzechCzechoslovakianDanishDelawareDominicanDutchDutch West IndianEastern EuropeanEcuadorianEgyptianEnglishEstonianEthiopianEuropeanFijianFilipinoFinnishFrenchFrench American IndianFrench CanadianGermanGerman RussianGhanaianGreekGuamanian/ChamorroGuatemalanGuyaneseHaitianHmongHonduranHopiHoumaHungarianIcelanderIndian (Asian)IndonesianInupiatIranianIraqiIrishIroquoisIsraeliItalianJamaicanJapaneseJordanianKenyanKiowaKoreanLaotianLatvianLebaneseLiberianLithuanianLuxembourgerMacedonianMalaysianMalteseMarshalleseMenomineeMexicanMexican American IndianMongolianMoroccanNative HawaiianNavajoNepaleseNew ZealanderNicaraguanNigerianNorthern EuropeanNorwegianOkinawanOsageOttawaPaiutePakistaniPalestinianPanamanianParaguayanPennsylvania GermanPeruvianPimaPolishPortuguesePotawatomiPuebloPuerto RicanPuget Sound SalishRomanianRussianSalvadoranSamoanScandinavianScotch-IrishScottishSeminoleSenegaleseSerbianShoshoneSierra LeoneanSiouxSlavicSlovakSloveneSomaliSouth AfricanSouth AmericanSouth American IndianSoviet UnionSpaniardSpanishSpanish AmericanSpanish American IndianSri LankanSubsaharan AfricanSudaneseSwedishSwissSyrianTaiwaneseThaiTlingit-HaidaTohono O'OdhamTonganTrinidadian and TobagonianTsimshianTurkishU.S. Virgin IslanderUgandanUkrainianUruguayanUteVenezuelanVietnameseWelshWest IndianYakamaYaquiYugoslavianYumanYup'ikZimbabwean
Immigration
NonimmigrantsImmigrantsAfghanistanAfricaAlbaniaArgentinaArmeniaAsiaAustraliaAustriaBahamasBangladeshBarbadosBelarusBelgiumBelizeBoliviaBosnia and HerzegovinaBrazilBulgariaBurma/MyanmarCabo VerdeCambodiaCameroonCanadaCaribbeanCentral AmericaChileChinaColombiaCongoCosta RicaCroatiaCubaCzechoslovakiaDenmarkDominicaDominican RepublicEastern AfricaEastern AsiaEastern EuropeEcuadorEgyptEl SalvadorEnglandEritreaEthiopiaEuropeFijiFranceGermanyGhanaGreeceGrenadaGuatemalaGuyanaHaitiHondurasHong KongHungaryIndiaIndonesiaIranIraqIrelandIsraelItalyJamaicaJapanJordanKazakhstanKenyaKoreaKuwaitLaosLatin AmericaLatviaLebanonLiberiaLithuaniaMalaysiaMexicoMicronesiaMiddle AfricaMoldovaMoroccoNepalNetherlandsNicaraguaNigeriaNorth AmericaNorth MacedoniaNorthern AfricaNorthern EuropeNorwayOceaniaPakistanPanamaPeruPhilippinesPolandPortugalRomaniaRussiaSaudi ArabiaScotlandSenegalSerbiaSierra LeoneSingaporeSomaliaSouth AfricaSouth AmericaSouth Central AsiaSouth Eastern AsiaSouthern EuropeSpainSri LankaSt. Vincent and the GrenadinesSudanSwedenSwitzerlandSyriaTaiwanThailandTrinidad and TobagoTurkeyUgandaUkraineUruguayUzbekistanVenezuelaVietnamWest IndiesWestern AfricaWestern AsiaWestern EuropeYemenZaireZimbabweAzores
Disability Age 5 to 17
Income
Poverty
Unemployment
Labor Participation
Family Structure
Vehicle Availability
Education Level
Disability

Lumbee Disability Age 5 to 17
Tragic

6.2%
DISABILITY | AGE 5 TO 17
0.0/ 100
METRIC RATING
298th/ 347
METRIC RANK

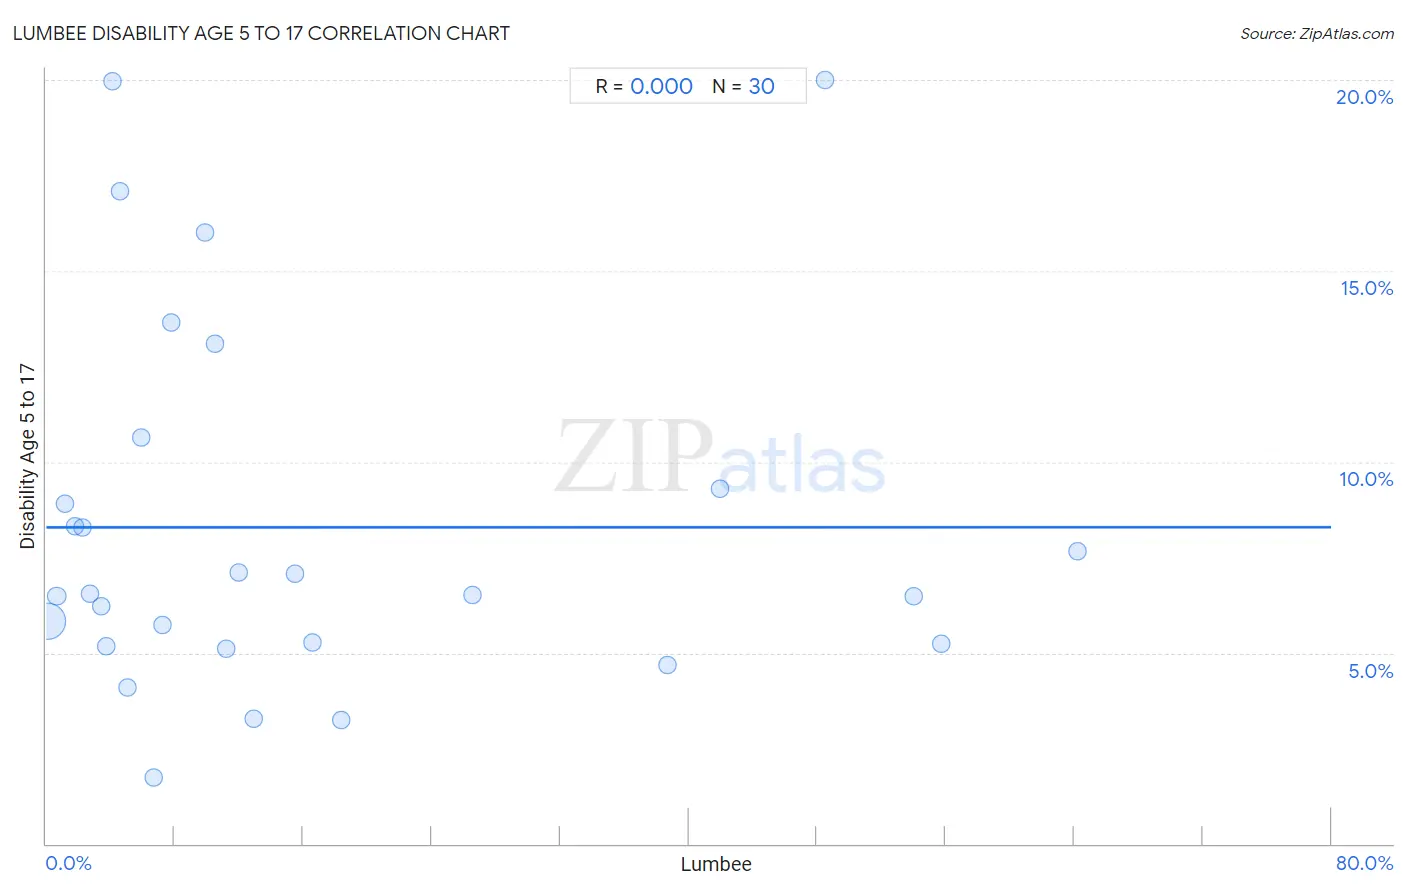
Lumbee Disability Age 5 to 17 Correlation Chart

The statistical analysis conducted on geographies consisting of 92,024,510 people shows no correlation between the proportion of Lumbee and percentage of population with a disability between the ages 5 and 17 in the United States with a correlation coefficient (R) of 0.000 and weighted average of 6.2%. On average, for every 1% (one percent) increase in Lumbee within a typical geography, there is an increase of 0.00010% in percentage of population with a disability between the ages 5 and 17.
Lumbee Disability Age 5 to 17
It is essential to understand that the correlation between the percentage of Lumbee and percentage of population with a disability between the ages 5 and 17 does not imply a direct cause-and-effect relationship. It remains uncertain whether the presence of Lumbee influences an upward or downward trend in the level of percentage of population with a disability between the ages 5 and 17 within an area, or if Lumbee simply ended up residing in those areas with higher or lower levels of percentage of population with a disability between the ages 5 and 17 due to other factors.

Demographics Similar to Lumbee by Disability Age 5 to 17

In terms of disability age 5 to 17, the demographic groups most similar to Lumbee are Immigrants from Bahamas (6.2%, a difference of 0.070%), Welsh (6.3%, a difference of 0.15%), Spanish American (6.2%, a difference of 0.19%), Cree (6.2%, a difference of 0.22%), and Carpatho Rusyn (6.3%, a difference of 0.27%).
DemographicsRating | RankDisability Age 5 to 17
Whites/Caucasians
0.0
/100
|
#291
Tragic
6.2%
Immigrants from Senegal
0.0
/100
|
#292
Tragic
6.2%
Central American Indians
0.0
/100
|
#293
Tragic
6.2%
Irish
0.0
/100
|
#294
Tragic
6.2%
Cree
0.0
/100
|
#295
Tragic
6.2%
Spanish Americans
0.0
/100
|
#296
Tragic
6.2%
Immigrants from Bahamas
0.0
/100
|
#297
Tragic
6.2%
Lumbee
0.0
/100
|
#298
Tragic
6.2%
Welsh
0.0
/100
|
#299
Tragic
6.3%
Carpatho Rusyns
0.0
/100
|
#300
Tragic
6.3%
U.S. Virgin Islanders
0.0
/100
|
#301
Tragic
6.3%
Celtics
0.0
/100
|
#302
Tragic
6.3%
Yakama
0.0
/100
|
#303
Tragic
6.3%
Senegalese
0.0
/100
|
#304
Tragic
6.3%
Natives/Alaskans
0.0
/100
|
#305
Tragic
6.3%

Lumbee Disability Age 5 to 17 Correlation Summary

MeasurementLumbee DataDisability Age 5 to 17 Data
Minimum0.041%1.7%
Maximum64.2%20.0%
Range64.1%18.3%
Mean16.5%8.3%
Median8.8%6.5%
Interquartile 25% (IQ1)3.7%5.2%
Interquartile 75% (IQ3)18.4%9.3%
Interquartile Range (IQR)14.7%4.1%
Standard Deviation (Sample)18.7%4.8%
Standard Deviation (Population)18.4%4.7%

Correlation Details

Lumbee PercentileSample SizeDisability Age 5 to 17
[
0.0%
-
0.5%
]
0.041%
90,279,7295.8%
[
0.5%
-
1.0%
]
0.65%
1,101,7556.5%
[
1.0%
-
1.5%
]
1.20%
209,8148.9%
[
1.5%
-
2.0%
]
1.79%
116,7628.3%
[
2.0%
-
2.5%
]
2.25%
75,3538.3%
[
2.5%
-
3.0%
]
2.71%
9,4776.6%
[
3.0%
-
3.5%
]
3.44%
8,8506.2%
[
3.5%
-
4.0%
]
3.71%
8,1435.2%
[
4.0%
-
4.5%
]
4.15%
2,14520.0%
[
4.5%
-
5.0%
]
4.61%
8,84717.1%
[
5.0%
-
5.5%
]
5.06%
4,6034.1%
[
5.5%
-
6.0%
]
5.90%
32210.6%
[
6.5%
-
7.0%
]
6.71%
6711.7%
[
7.0%
-
7.5%
]
7.24%
17,4565.7%
[
7.5%
-
8.0%
]
7.81%
67913.6%
[
9.5%
-
10.0%
]
9.86%
72016.0%
[
10.0%
-
10.5%
]
10.47%
10,58813.1%
[
11.0%
-
11.5%
]
11.23%
26,8325.1%
[
11.5%
-
12.0%
]
11.95%
23,7167.1%
[
12.5%
-
13.0%
]
12.90%
3,3033.3%
[
15.5%
-
16.0%
]
15.52%
2,5197.1%
[
16.5%
-
17.0%
]
16.58%
34,0935.3%
[
18.0%
-
18.5%
]
18.38%
3,1183.2%
[
26.5%
-
27.0%
]
26.53%
9,7906.5%
[
38.5%
-
39.0%
]
38.67%
11,5484.7%
[
41.5%
-
42.0%
]
41.93%
5,0659.3%
[
48.0%
-
48.5%
]
48.45%
9720.0%
[
54.0%
-
54.5%
]
54.01%
6,4996.5%
[
55.5%
-
56.0%
]
55.71%
29,6705.2%
[
64.0%
-
64.5%
]
64.19%
12,3467.7%