Ute Disability Age 5 to 17

COMPARE

Ute
Race
Ancestry
AfghanAfricanAlaska NativeAlaskan AthabascanAlbanianAleutAlsatianAmericanApacheArabArapahoArgentineanArmenianAssyrian/Chaldean/SyriacAustralianAustrianBahamianBangladeshiBarbadianBasqueBelgianBelizeanBermudanBhutaneseBlackfeetBolivianBrazilianBritishBritish West IndianBulgarianBurmeseCajunCambodianCanadianCape VerdeanCarpatho RusynCelticCentral AmericanCentral American IndianCherokeeCheyenneChickasawChileanChineseChippewaChoctawColombianColvilleComancheCosta RicanCreeCreekCroatianCrowCubanCypriotCzechCzechoslovakianDanishDelawareDominicanDutchDutch West IndianEastern EuropeanEcuadorianEgyptianEnglishEstonianEthiopianEuropeanFijianFilipinoFinnishFrenchFrench American IndianFrench CanadianGermanGerman RussianGhanaianGreekGuamanian/ChamorroGuatemalanGuyaneseHaitianHmongHonduranHopiHoumaHungarianIcelanderIndian (Asian)IndonesianInupiatIranianIraqiIrishIroquoisIsraeliItalianJamaicanJapaneseJordanianKenyanKiowaKoreanLaotianLatvianLebaneseLiberianLithuanianLumbeeLuxembourgerMacedonianMalaysianMalteseMarshalleseMenomineeMexicanMexican American IndianMongolianMoroccanNative HawaiianNavajoNepaleseNew ZealanderNicaraguanNigerianNorthern EuropeanNorwegianOkinawanOsageOttawaPaiutePakistaniPalestinianPanamanianParaguayanPennsylvania GermanPeruvianPimaPolishPortuguesePotawatomiPuebloPuerto RicanPuget Sound SalishRomanianRussianSalvadoranSamoanScandinavianScotch-IrishScottishSeminoleSenegaleseSerbianShoshoneSierra LeoneanSiouxSlavicSlovakSloveneSomaliSouth AfricanSouth AmericanSouth American IndianSoviet UnionSpaniardSpanishSpanish AmericanSpanish American IndianSri LankanSubsaharan AfricanSudaneseSwedishSwissSyrianTaiwaneseThaiTlingit-HaidaTohono O'OdhamTonganTrinidadian and TobagonianTsimshianTurkishU.S. Virgin IslanderUgandanUkrainianUruguayanUteVenezuelanVietnameseWelshWest IndianYakamaYaquiYugoslavianYumanYup'ikZimbabwean
Immigration
NonimmigrantsImmigrantsAfghanistanAfricaAlbaniaArgentinaArmeniaAsiaAustraliaAustriaBahamasBangladeshBarbadosBelarusBelgiumBelizeBoliviaBosnia and HerzegovinaBrazilBulgariaBurma/MyanmarCabo VerdeCambodiaCameroonCanadaCaribbeanCentral AmericaChileChinaColombiaCongoCosta RicaCroatiaCubaCzechoslovakiaDenmarkDominicaDominican RepublicEastern AfricaEastern AsiaEastern EuropeEcuadorEgyptEl SalvadorEnglandEritreaEthiopiaEuropeFijiFranceGermanyGhanaGreeceGrenadaGuatemalaGuyanaHaitiHondurasHong KongHungaryIndiaIndonesiaIranIraqIrelandIsraelItalyJamaicaJapanJordanKazakhstanKenyaKoreaKuwaitLaosLatin AmericaLatviaLebanonLiberiaLithuaniaMalaysiaMexicoMicronesiaMiddle AfricaMoldovaMoroccoNepalNetherlandsNicaraguaNigeriaNorth AmericaNorth MacedoniaNorthern AfricaNorthern EuropeNorwayOceaniaPakistanPanamaPeruPhilippinesPolandPortugalRomaniaRussiaSaudi ArabiaScotlandSenegalSerbiaSierra LeoneSingaporeSomaliaSouth AfricaSouth AmericaSouth Central AsiaSouth Eastern AsiaSouthern EuropeSpainSri LankaSt. Vincent and the GrenadinesSudanSwedenSwitzerlandSyriaTaiwanThailandTrinidad and TobagoTurkeyUgandaUkraineUruguayUzbekistanVenezuelaVietnamWest IndiesWestern AfricaWestern AsiaWestern EuropeYemenZaireZimbabweAzores
Select to Compare
Race
Ancestry
AfghanAfricanAlaska NativeAlaskan AthabascanAlbanianAleutAlsatianAmericanApacheArabArapahoArgentineanArmenianAssyrian/Chaldean/SyriacAustralianAustrianBahamianBangladeshiBarbadianBasqueBelgianBelizeanBermudanBhutaneseBlackfeetBolivianBrazilianBritishBritish West IndianBulgarianBurmeseCajunCambodianCanadianCape VerdeanCarpatho RusynCelticCentral AmericanCentral American IndianCherokeeCheyenneChickasawChileanChineseChippewaChoctawColombianColvilleComancheCosta RicanCreeCreekCroatianCrowCubanCypriotCzechCzechoslovakianDanishDelawareDominicanDutchDutch West IndianEastern EuropeanEcuadorianEgyptianEnglishEstonianEthiopianEuropeanFijianFilipinoFinnishFrenchFrench American IndianFrench CanadianGermanGerman RussianGhanaianGreekGuamanian/ChamorroGuatemalanGuyaneseHaitianHmongHonduranHopiHoumaHungarianIcelanderIndian (Asian)IndonesianInupiatIranianIraqiIrishIroquoisIsraeliItalianJamaicanJapaneseJordanianKenyanKiowaKoreanLaotianLatvianLebaneseLiberianLithuanianLumbeeLuxembourgerMacedonianMalaysianMalteseMarshalleseMenomineeMexicanMexican American IndianMongolianMoroccanNative HawaiianNavajoNepaleseNew ZealanderNicaraguanNigerianNorthern EuropeanNorwegianOkinawanOsageOttawaPaiutePakistaniPalestinianPanamanianParaguayanPennsylvania GermanPeruvianPimaPolishPortuguesePotawatomiPuebloPuerto RicanPuget Sound SalishRomanianRussianSalvadoranSamoanScandinavianScotch-IrishScottishSeminoleSenegaleseSerbianShoshoneSierra LeoneanSiouxSlavicSlovakSloveneSomaliSouth AfricanSouth AmericanSouth American IndianSoviet UnionSpaniardSpanishSpanish AmericanSpanish American IndianSri LankanSubsaharan AfricanSudaneseSwedishSwissSyrianTaiwaneseThaiTlingit-HaidaTohono O'OdhamTonganTrinidadian and TobagonianTsimshianTurkishU.S. Virgin IslanderUgandanUkrainianUruguayanVenezuelanVietnameseWelshWest IndianYakamaYaquiYugoslavianYumanYup'ikZimbabwean
Immigration
NonimmigrantsImmigrantsAfghanistanAfricaAlbaniaArgentinaArmeniaAsiaAustraliaAustriaBahamasBangladeshBarbadosBelarusBelgiumBelizeBoliviaBosnia and HerzegovinaBrazilBulgariaBurma/MyanmarCabo VerdeCambodiaCameroonCanadaCaribbeanCentral AmericaChileChinaColombiaCongoCosta RicaCroatiaCubaCzechoslovakiaDenmarkDominicaDominican RepublicEastern AfricaEastern AsiaEastern EuropeEcuadorEgyptEl SalvadorEnglandEritreaEthiopiaEuropeFijiFranceGermanyGhanaGreeceGrenadaGuatemalaGuyanaHaitiHondurasHong KongHungaryIndiaIndonesiaIranIraqIrelandIsraelItalyJamaicaJapanJordanKazakhstanKenyaKoreaKuwaitLaosLatin AmericaLatviaLebanonLiberiaLithuaniaMalaysiaMexicoMicronesiaMiddle AfricaMoldovaMoroccoNepalNetherlandsNicaraguaNigeriaNorth AmericaNorth MacedoniaNorthern AfricaNorthern EuropeNorwayOceaniaPakistanPanamaPeruPhilippinesPolandPortugalRomaniaRussiaSaudi ArabiaScotlandSenegalSerbiaSierra LeoneSingaporeSomaliaSouth AfricaSouth AmericaSouth Central AsiaSouth Eastern AsiaSouthern EuropeSpainSri LankaSt. Vincent and the GrenadinesSudanSwedenSwitzerlandSyriaTaiwanThailandTrinidad and TobagoTurkeyUgandaUkraineUruguayUzbekistanVenezuelaVietnamWest IndiesWestern AfricaWestern AsiaWestern EuropeYemenZaireZimbabweAzores
Disability Age 5 to 17
Income
Poverty
Unemployment
Labor Participation
Family Structure
Vehicle Availability
Education Level
Disability

Ute Disability Age 5 to 17
Excellent

5.5%
DISABILITY | AGE 5 TO 17
80.6/ 100
METRIC RATING
152nd/ 347
METRIC RANK

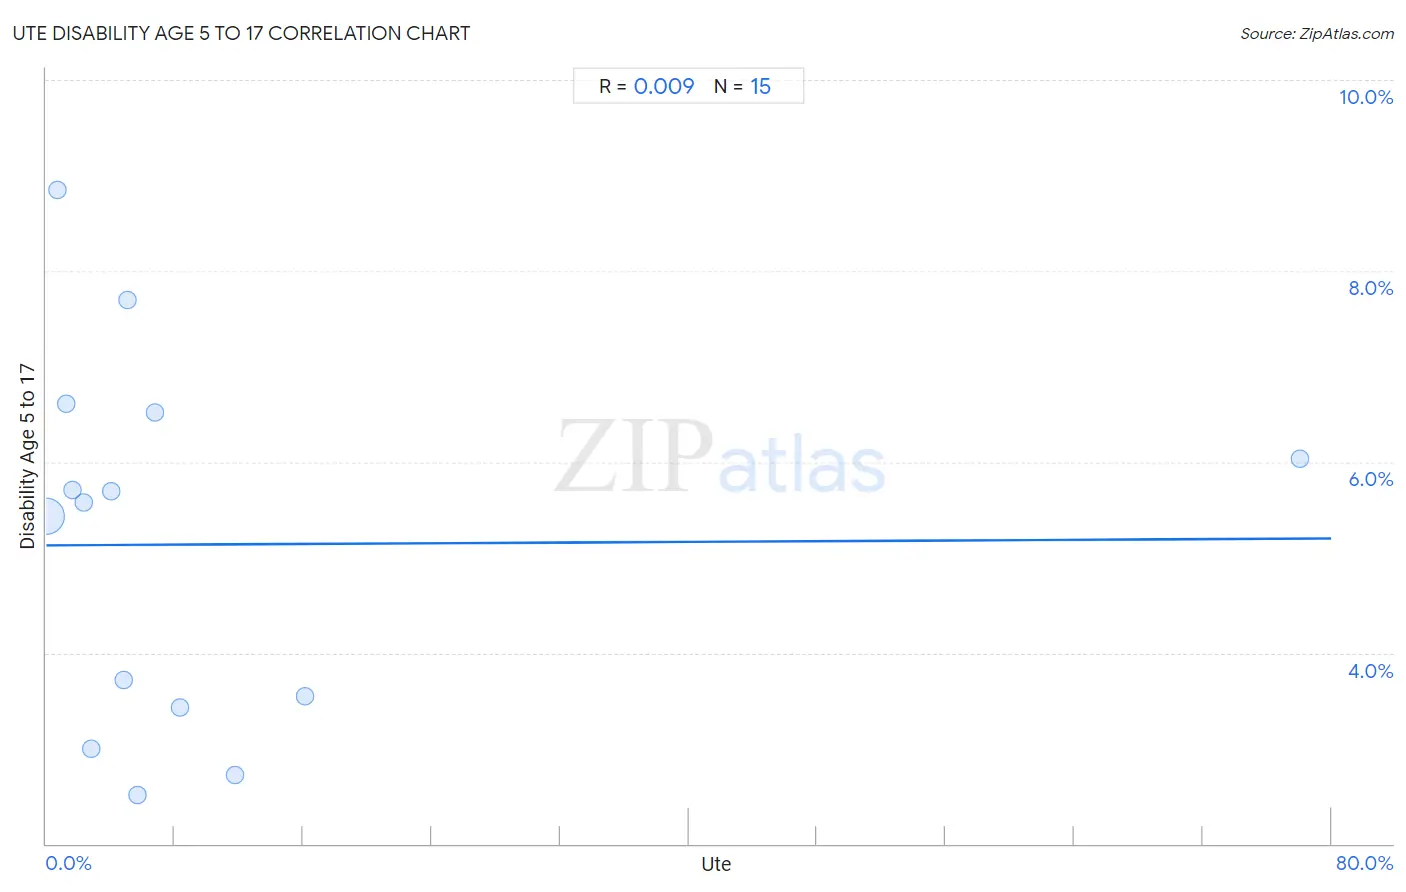
Ute Disability Age 5 to 17 Correlation Chart

The statistical analysis conducted on geographies consisting of 55,569,017 people shows no correlation between the proportion of Ute and percentage of population with a disability between the ages 5 and 17 in the United States with a correlation coefficient (R) of 0.009 and weighted average of 5.5%. On average, for every 1% (one percent) increase in Ute within a typical geography, there is an increase of 0.00090% in percentage of population with a disability between the ages 5 and 17.
Ute Disability Age 5 to 17
It is essential to understand that the correlation between the percentage of Ute and percentage of population with a disability between the ages 5 and 17 does not imply a direct cause-and-effect relationship. It remains uncertain whether the presence of Ute influences an upward or downward trend in the level of percentage of population with a disability between the ages 5 and 17 within an area, or if Ute simply ended up residing in those areas with higher or lower levels of percentage of population with a disability between the ages 5 and 17 due to other factors.

Demographics Similar to Ute by Disability Age 5 to 17

In terms of disability age 5 to 17, the demographic groups most similar to Ute are Estonian (5.5%, a difference of 0.010%), Guatemalan (5.5%, a difference of 0.070%), Ecuadorian (5.5%, a difference of 0.070%), Central American (5.5%, a difference of 0.080%), and Samoan (5.5%, a difference of 0.11%).
DemographicsRating | RankDisability Age 5 to 17
Immigrants from Guatemala
86.6
/100
|
#145
Excellent
5.5%
Albanians
83.7
/100
|
#146
Excellent
5.5%
Immigrants from Albania
83.1
/100
|
#147
Excellent
5.5%
Samoans
81.9
/100
|
#148
Excellent
5.5%
Central Americans
81.6
/100
|
#149
Excellent
5.5%
Guatemalans
81.5
/100
|
#150
Excellent
5.5%
Estonians
80.8
/100
|
#151
Excellent
5.5%
Ute
80.6
/100
|
#152
Excellent
5.5%
Ecuadorians
79.7
/100
|
#153
Good
5.5%
Australians
78.8
/100
|
#154
Good
5.5%
Immigrants from Ecuador
78.3
/100
|
#155
Good
5.5%
Hawaiians
78.0
/100
|
#156
Good
5.5%
Immigrants from Costa Rica
77.9
/100
|
#157
Good
5.5%
Immigrants from Nepal
77.1
/100
|
#158
Good
5.5%
Immigrants from Zimbabwe
75.3
/100
|
#159
Good
5.5%

Ute Disability Age 5 to 17 Correlation Summary

MeasurementUte DataDisability Age 5 to 17 Data
Minimum0.028%2.5%
Maximum78.1%8.8%
Range78.0%6.3%
Mean10.0%5.1%
Median4.9%5.6%
Interquartile 25% (IQ1)1.6%3.4%
Interquartile 75% (IQ3)8.3%6.5%
Interquartile Range (IQR)6.7%3.1%
Standard Deviation (Sample)19.3%1.9%
Standard Deviation (Population)18.7%1.8%

Correlation Details

Ute PercentileSample SizeDisability Age 5 to 17
[
0.0%
-
0.5%
]
0.028%
55,182,2815.4%
[
0.5%
-
1.0%
]
0.68%
234,7838.8%
[
1.0%
-
1.5%
]
1.22%
53,5566.6%
[
1.5%
-
2.0%
]
1.64%
7,7845.7%
[
2.0%
-
2.5%
]
2.33%
48,7175.6%
[
2.5%
-
3.0%
]
2.77%
7,3703.0%
[
4.0%
-
4.5%
]
4.06%
1,6745.7%
[
4.5%
-
5.0%
]
4.85%
8,3463.7%
[
5.0%
-
5.5%
]
5.08%
7687.7%
[
5.5%
-
6.0%
]
5.71%
14,1812.5%
[
6.5%
-
7.0%
]
6.81%
4706.5%
[
8.0%
-
8.5%
]
8.33%
1,2853.4%
[
11.5%
-
12.0%
]
11.76%
5,4952.7%
[
16.0%
-
16.5%
]
16.07%
6163.5%
[
78.0%
-
78.5%
]
78.06%
1,6916.0%