Immigrants from Guatemala Disability Age 5 to 17
COMPARE
Immigrants from Guatemala
Select to Compare
Disability Age 5 to 17
Immigrants from Guatemala Disability Age 5 to 17
5.5%
DISABILITY | AGE 5 TO 17
86.6/ 100
METRIC RATING
145th/ 347
METRIC RANK
Immigrants from Guatemala Disability Age 5 to 17 Correlation Chart
The statistical analysis conducted on geographies consisting of 375,293,918 people shows a weak negative correlation between the proportion of Immigrants from Guatemala and percentage of population with a disability between the ages 5 and 17 in the United States with a correlation coefficient (R) of -0.231 and weighted average of 5.5%. On average, for every 1% (one percent) increase in Immigrants from Guatemala within a typical geography, there is a decrease of 0.080% in percentage of population with a disability between the ages 5 and 17.
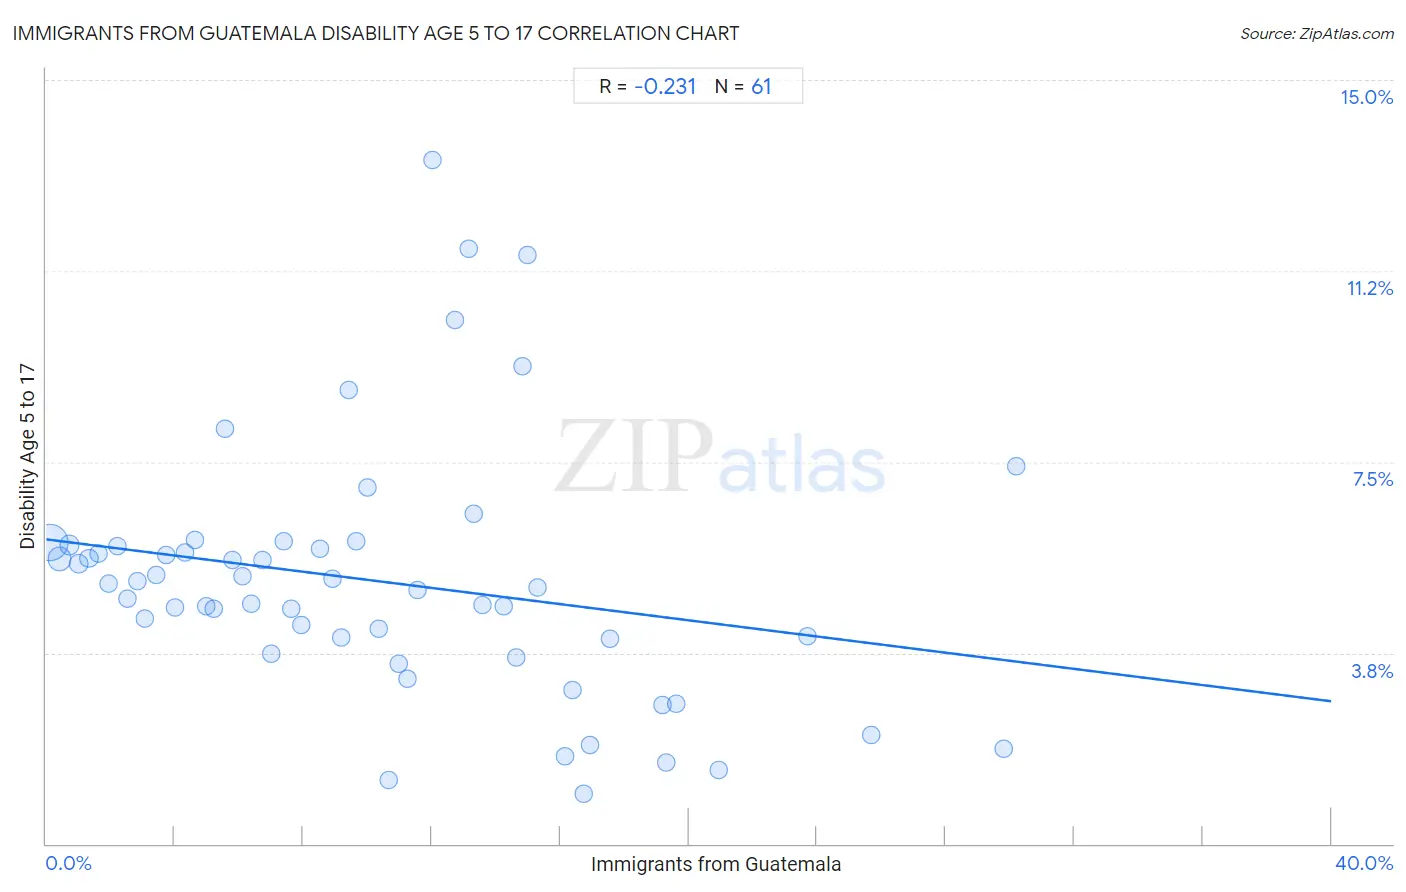
It is essential to understand that the correlation between the percentage of Immigrants from Guatemala and percentage of population with a disability between the ages 5 and 17 does not imply a direct cause-and-effect relationship. It remains uncertain whether the presence of Immigrants from Guatemala influences an upward or downward trend in the level of percentage of population with a disability between the ages 5 and 17 within an area, or if Immigrants from Guatemala simply ended up residing in those areas with higher or lower levels of percentage of population with a disability between the ages 5 and 17 due to other factors.
Demographics Similar to Immigrants from Guatemala by Disability Age 5 to 17
In terms of disability age 5 to 17, the demographic groups most similar to Immigrants from Guatemala are Pakistani (5.5%, a difference of 0.080%), Immigrants from Hungary (5.5%, a difference of 0.14%), Colombian (5.5%, a difference of 0.16%), Albanian (5.5%, a difference of 0.29%), and South American Indian (5.5%, a difference of 0.32%).
| Demographics | Rating | Rank | Disability Age 5 to 17 |
| Immigrants from Oceania | 90.8 /100 | #138 | Exceptional 5.4% |
| Belizeans | 90.8 /100 | #139 | Exceptional 5.4% |
| Immigrants from Netherlands | 90.5 /100 | #140 | Exceptional 5.4% |
| South American Indians | 89.3 /100 | #141 | Excellent 5.5% |
| Colombians | 88.0 /100 | #142 | Excellent 5.5% |
| Immigrants from Hungary | 87.9 /100 | #143 | Excellent 5.5% |
| Pakistanis | 87.3 /100 | #144 | Excellent 5.5% |
| Immigrants from Guatemala | 86.6 /100 | #145 | Excellent 5.5% |
| Albanians | 83.7 /100 | #146 | Excellent 5.5% |
| Immigrants from Albania | 83.1 /100 | #147 | Excellent 5.5% |
| Samoans | 81.9 /100 | #148 | Excellent 5.5% |
| Central Americans | 81.6 /100 | #149 | Excellent 5.5% |
| Guatemalans | 81.5 /100 | #150 | Excellent 5.5% |
| Estonians | 80.8 /100 | #151 | Excellent 5.5% |
| Ute | 80.6 /100 | #152 | Excellent 5.5% |
Immigrants from Guatemala Disability Age 5 to 17 Correlation Summary
| Measurement | Immigrants from Guatemala Data | Disability Age 5 to 17 Data |
| Minimum | 0.12% | 0.98% |
| Maximum | 30.2% | 13.4% |
| Range | 30.1% | 12.4% |
| Mean | 10.3% | 5.2% |
| Median | 9.4% | 5.0% |
| Interquartile 25% (IQ1) | 4.5% | 3.9% |
| Interquartile 75% (IQ3) | 14.9% | 5.8% |
| Interquartile Range (IQR) | 10.4% | 2.0% |
| Standard Deviation (Sample) | 7.2% | 2.5% |
| Standard Deviation (Population) | 7.2% | 2.5% |
Correlation Details
| Immigrants from Guatemala Percentile | Sample Size | Disability Age 5 to 17 |
[ 0.0% - 0.5% ] 0.12% | 223,137,105 | 5.9% |
[ 0.0% - 0.5% ] 0.42% | 70,319,389 | 5.6% |
[ 0.5% - 1.0% ] 0.72% | 28,822,320 | 5.9% |
[ 1.0% - 1.5% ] 1.02% | 16,001,067 | 5.5% |
[ 1.0% - 1.5% ] 1.34% | 9,831,001 | 5.6% |
[ 1.5% - 2.0% ] 1.64% | 5,010,029 | 5.7% |
[ 1.5% - 2.0% ] 1.95% | 3,711,921 | 5.1% |
[ 2.0% - 2.5% ] 2.23% | 2,792,824 | 5.8% |
[ 2.5% - 3.0% ] 2.53% | 1,333,931 | 4.8% |
[ 2.5% - 3.0% ] 2.84% | 1,958,921 | 5.2% |
[ 3.0% - 3.5% ] 3.06% | 4,658,050 | 4.4% |
[ 3.0% - 3.5% ] 3.43% | 781,404 | 5.3% |
[ 3.5% - 4.0% ] 3.74% | 918,793 | 5.7% |
[ 4.0% - 4.5% ] 4.02% | 479,952 | 4.6% |
[ 4.0% - 4.5% ] 4.30% | 365,361 | 5.7% |
[ 4.5% - 5.0% ] 4.62% | 937,710 | 6.0% |
[ 4.5% - 5.0% ] 5.00% | 250,550 | 4.7% |
[ 5.0% - 5.5% ] 5.22% | 370,680 | 4.6% |
[ 5.5% - 6.0% ] 5.58% | 401,788 | 8.1% |
[ 5.5% - 6.0% ] 5.81% | 234,656 | 5.6% |
[ 6.0% - 6.5% ] 6.11% | 610,452 | 5.2% |
[ 6.0% - 6.5% ] 6.38% | 254,017 | 4.7% |
[ 6.5% - 7.0% ] 6.72% | 369,428 | 5.6% |
[ 7.0% - 7.5% ] 7.01% | 188,884 | 3.7% |
[ 7.0% - 7.5% ] 7.40% | 123,692 | 5.9% |
[ 7.5% - 8.0% ] 7.61% | 351,157 | 4.6% |
[ 7.5% - 8.0% ] 7.94% | 127,694 | 4.3% |
[ 8.5% - 9.0% ] 8.51% | 89,148 | 5.8% |
[ 8.5% - 9.0% ] 8.90% | 59,346 | 5.2% |
[ 9.0% - 9.5% ] 9.19% | 39,538 | 4.0% |
[ 9.0% - 9.5% ] 9.41% | 21,691 | 8.9% |
[ 9.5% - 10.0% ] 9.66% | 149,686 | 5.9% |
[ 10.0% - 10.5% ] 10.01% | 60,932 | 7.0% |
[ 10.0% - 10.5% ] 10.35% | 73,906 | 4.2% |
[ 10.5% - 11.0% ] 10.66% | 47,611 | 1.3% |
[ 10.5% - 11.0% ] 10.99% | 8,854 | 3.5% |
[ 11.0% - 11.5% ] 11.25% | 1,777 | 3.2% |
[ 11.5% - 12.0% ] 11.56% | 21,433 | 5.0% |
[ 12.0% - 12.5% ] 12.04% | 706 | 13.4% |
[ 12.5% - 13.0% ] 12.71% | 11,184 | 10.3% |
[ 13.0% - 13.5% ] 13.14% | 10,171 | 11.7% |
[ 13.0% - 13.5% ] 13.31% | 64,350 | 6.5% |
[ 13.5% - 14.0% ] 13.59% | 1,354 | 4.7% |
[ 14.0% - 14.5% ] 14.23% | 42,230 | 4.7% |
[ 14.5% - 15.0% ] 14.64% | 9,827 | 3.7% |
[ 14.5% - 15.0% ] 14.82% | 5,838 | 9.4% |
[ 14.5% - 15.0% ] 14.98% | 41,873 | 11.6% |
[ 15.0% - 15.5% ] 15.30% | 36,578 | 5.0% |
[ 16.0% - 16.5% ] 16.16% | 51,761 | 1.7% |
[ 16.0% - 16.5% ] 16.37% | 2,389 | 3.0% |
[ 16.5% - 17.0% ] 16.73% | 3,055 | 0.98% |
[ 16.5% - 17.0% ] 16.94% | 4,492 | 1.9% |
[ 17.5% - 18.0% ] 17.53% | 9,320 | 4.0% |
[ 19.0% - 19.5% ] 19.16% | 981 | 2.7% |
[ 19.0% - 19.5% ] 19.30% | 2,078 | 1.6% |
[ 19.5% - 20.0% ] 19.59% | 47,142 | 2.7% |
[ 20.5% - 21.0% ] 20.92% | 7,247 | 1.5% |
[ 23.5% - 24.0% ] 23.70% | 211 | 4.1% |
[ 25.5% - 26.0% ] 25.70% | 2,506 | 2.1% |
[ 29.5% - 30.0% ] 29.81% | 21,778 | 1.9% |
[ 30.0% - 30.5% ] 30.20% | 149 | 7.4% |