Paiute Disability Age 5 to 17
COMPARE
Paiute
Select to Compare
Disability Age 5 to 17
Paiute Disability Age 5 to 17
5.7%
DISABILITY | AGE 5 TO 17
11.2/ 100
METRIC RATING
204th/ 347
METRIC RANK
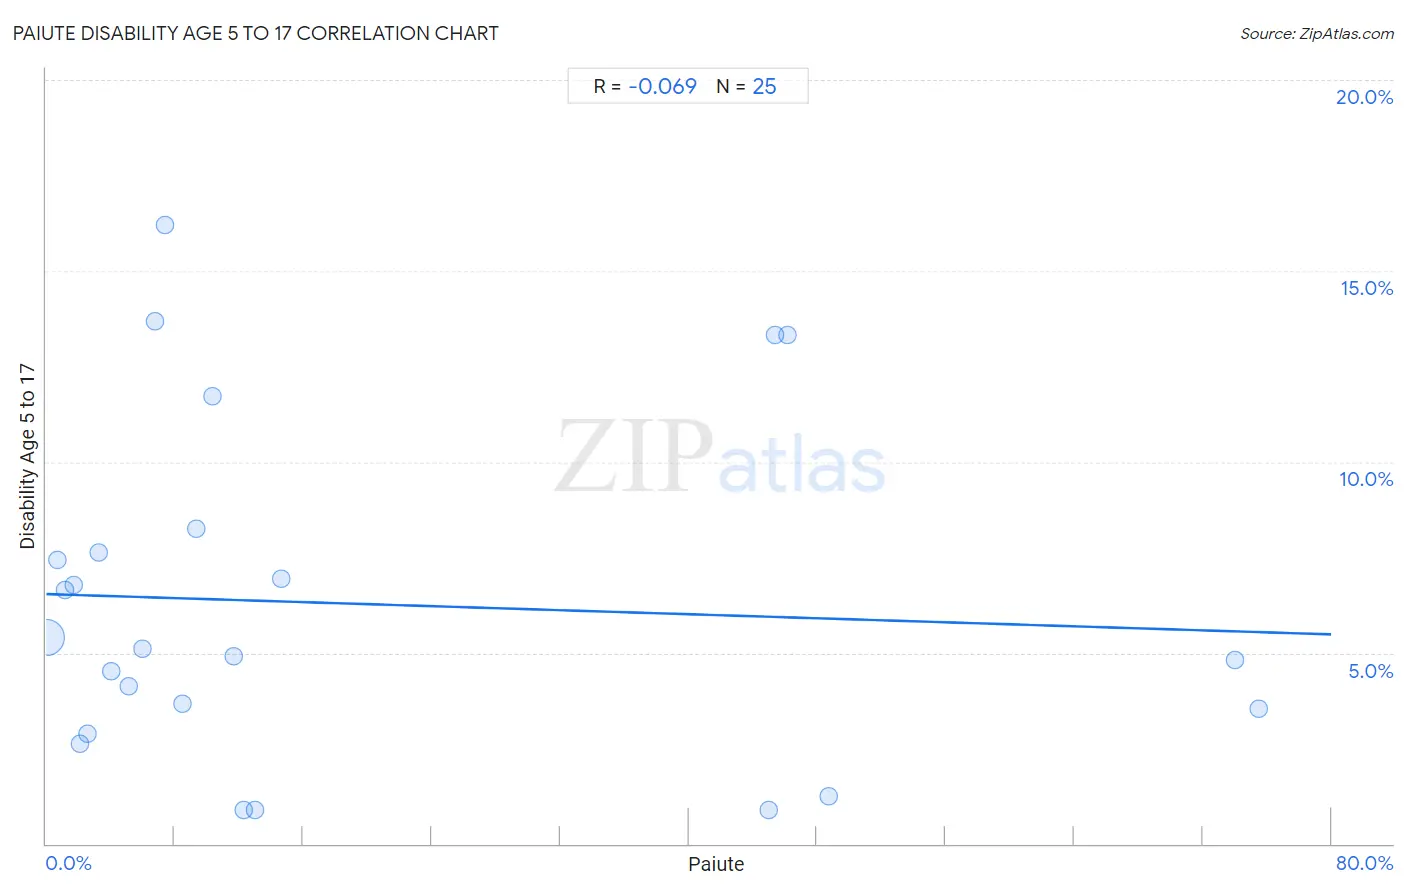
Paiute Disability Age 5 to 17 Correlation Chart
The statistical analysis conducted on geographies consisting of 58,225,397 people shows a slight negative correlation between the proportion of Paiute and percentage of population with a disability between the ages 5 and 17 in the United States with a correlation coefficient (R) of -0.069 and weighted average of 5.7%. On average, for every 1% (one percent) increase in Paiute within a typical geography, there is a decrease of 0.013% in percentage of population with a disability between the ages 5 and 17.
It is essential to understand that the correlation between the percentage of Paiute and percentage of population with a disability between the ages 5 and 17 does not imply a direct cause-and-effect relationship. It remains uncertain whether the presence of Paiute influences an upward or downward trend in the level of percentage of population with a disability between the ages 5 and 17 within an area, or if Paiute simply ended up residing in those areas with higher or lower levels of percentage of population with a disability between the ages 5 and 17 due to other factors.
Demographics Similar to Paiute by Disability Age 5 to 17
In terms of disability age 5 to 17, the demographic groups most similar to Paiute are Trinidadian and Tobagonian (5.7%, a difference of 0.050%), Immigrants from Africa (5.7%, a difference of 0.060%), Moroccan (5.7%, a difference of 0.10%), Kenyan (5.8%, a difference of 0.15%), and Spanish American Indian (5.7%, a difference of 0.18%).
| Demographics | Rating | Rank | Disability Age 5 to 17 |
| Immigrants from North America | 23.1 /100 | #197 | Fair 5.7% |
| Norwegians | 20.9 /100 | #198 | Fair 5.7% |
| Northern Europeans | 15.2 /100 | #199 | Poor 5.7% |
| Icelanders | 14.6 /100 | #200 | Poor 5.7% |
| Basques | 13.7 /100 | #201 | Poor 5.7% |
| Austrians | 13.2 /100 | #202 | Poor 5.7% |
| Spanish American Indians | 12.8 /100 | #203 | Poor 5.7% |
| Paiute | 11.2 /100 | #204 | Poor 5.7% |
| Trinidadians and Tobagonians | 10.8 /100 | #205 | Poor 5.7% |
| Immigrants from Africa | 10.8 /100 | #206 | Poor 5.7% |
| Moroccans | 10.4 /100 | #207 | Poor 5.7% |
| Kenyans | 10.0 /100 | #208 | Poor 5.8% |
| Immigrants from Uganda | 9.7 /100 | #209 | Tragic 5.8% |
| Immigrants from Haiti | 9.5 /100 | #210 | Tragic 5.8% |
| Yugoslavians | 9.1 /100 | #211 | Tragic 5.8% |
Paiute Disability Age 5 to 17 Correlation Summary
| Measurement | Paiute Data | Disability Age 5 to 17 Data |
| Minimum | 0.030% | 0.89% |
| Maximum | 75.5% | 16.2% |
| Range | 75.4% | 15.3% |
| Mean | 18.2% | 6.3% |
| Median | 8.5% | 5.1% |
| Interquartile 25% (IQ1) | 2.9% | 3.2% |
| Interquartile 75% (IQ3) | 29.8% | 7.9% |
| Interquartile Range (IQR) | 26.9% | 4.7% |
| Standard Deviation (Sample) | 22.9% | 4.4% |
| Standard Deviation (Population) | 22.5% | 4.3% |
Correlation Details
| Paiute Percentile | Sample Size | Disability Age 5 to 17 |
[ 0.0% - 0.5% ] 0.030% | 57,528,123 | 5.4% |
[ 0.5% - 1.0% ] 0.68% | 487,952 | 7.4% |
[ 1.0% - 1.5% ] 1.18% | 123,035 | 6.6% |
[ 1.5% - 2.0% ] 1.75% | 26,386 | 6.8% |
[ 2.0% - 2.5% ] 2.12% | 8,780 | 2.6% |
[ 2.5% - 3.0% ] 2.56% | 2,309 | 2.9% |
[ 3.0% - 3.5% ] 3.28% | 579 | 7.6% |
[ 4.0% - 4.5% ] 4.04% | 15,901 | 4.5% |
[ 5.0% - 5.5% ] 5.11% | 5,992 | 4.1% |
[ 6.0% - 6.5% ] 6.02% | 3,108 | 5.1% |
[ 6.5% - 7.0% ] 6.80% | 8,472 | 13.7% |
[ 7.0% - 7.5% ] 7.39% | 1,705 | 16.2% |
[ 8.5% - 9.0% ] 8.52% | 775 | 3.7% |
[ 9.0% - 9.5% ] 9.37% | 1,675 | 8.3% |
[ 10.0% - 10.5% ] 10.37% | 1,659 | 11.7% |
[ 11.5% - 12.0% ] 11.70% | 778 | 4.9% |
[ 12.0% - 12.5% ] 12.31% | 1,649 | 0.89% |
[ 12.5% - 13.0% ] 12.99% | 1,563 | 0.89% |
[ 14.5% - 15.0% ] 14.63% | 1,032 | 6.9% |
[ 44.5% - 45.0% ] 44.98% | 887 | 0.89% |
[ 45.0% - 45.5% ] 45.35% | 172 | 13.3% |
[ 46.0% - 46.5% ] 46.15% | 169 | 13.3% |
[ 48.5% - 49.0% ] 48.74% | 716 | 1.3% |
[ 73.5% - 74.0% ] 74.00% | 896 | 4.8% |
[ 75.0% - 75.5% ] 75.46% | 1,084 | 3.5% |