Thai Disability Age 5 to 17
COMPARE
Thai
Select to Compare
Disability Age 5 to 17
Thai Disability Age 5 to 17
4.7%
DISABILITY | AGE 5 TO 17
100.0/ 100
METRIC RATING
13th/ 347
METRIC RANK
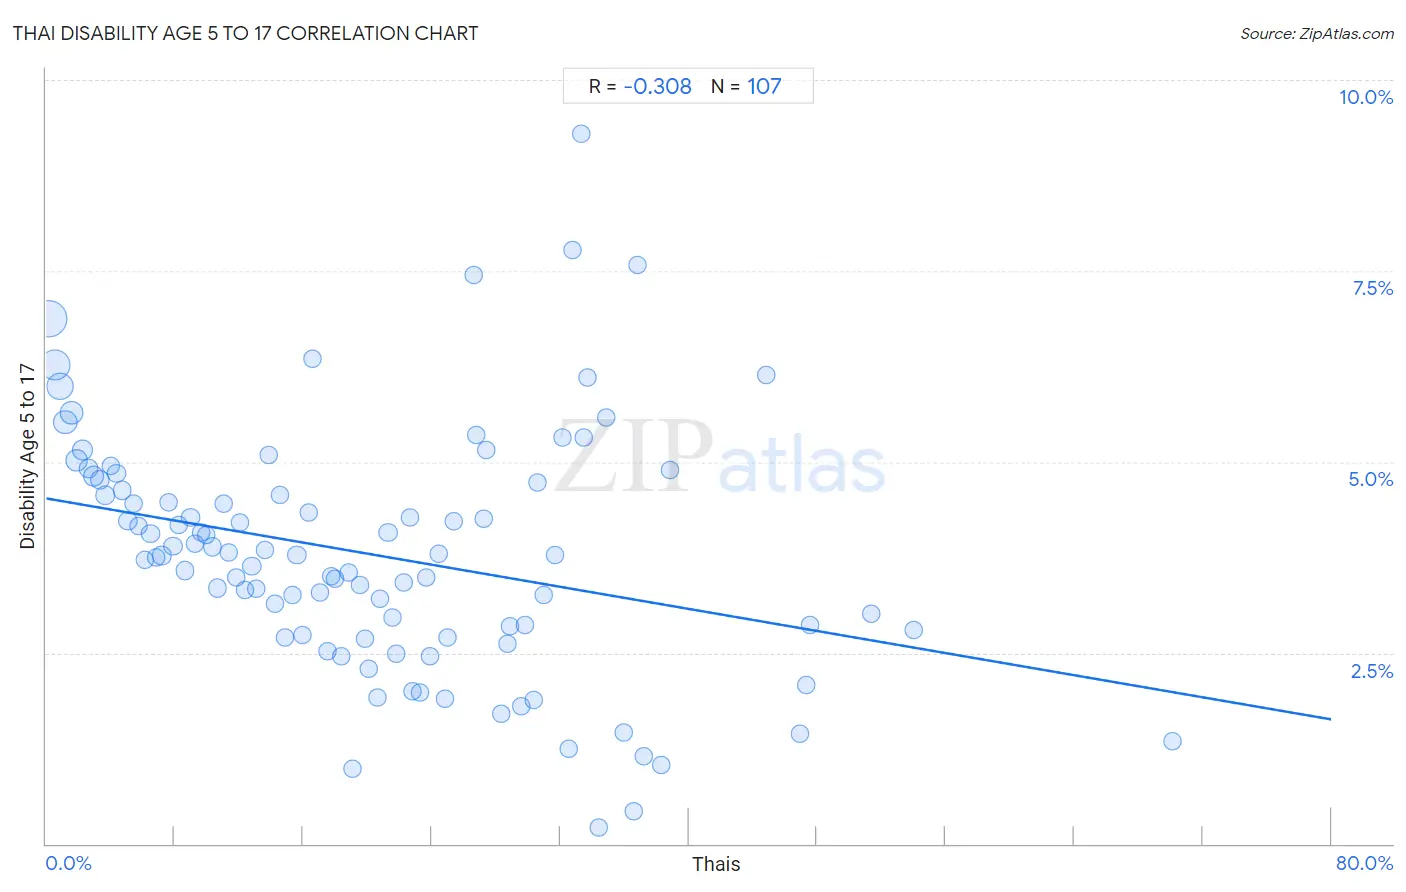
Thai Disability Age 5 to 17 Correlation Chart
The statistical analysis conducted on geographies consisting of 470,579,887 people shows a mild negative correlation between the proportion of Thais and percentage of population with a disability between the ages 5 and 17 in the United States with a correlation coefficient (R) of -0.308 and weighted average of 4.7%. On average, for every 1% (one percent) increase in Thais within a typical geography, there is a decrease of 0.036% in percentage of population with a disability between the ages 5 and 17.
It is essential to understand that the correlation between the percentage of Thais and percentage of population with a disability between the ages 5 and 17 does not imply a direct cause-and-effect relationship. It remains uncertain whether the presence of Thais influences an upward or downward trend in the level of percentage of population with a disability between the ages 5 and 17 within an area, or if Thais simply ended up residing in those areas with higher or lower levels of percentage of population with a disability between the ages 5 and 17 due to other factors.
Demographics Similar to Thais by Disability Age 5 to 17
In terms of disability age 5 to 17, the demographic groups most similar to Thais are Immigrants from Korea (4.7%, a difference of 0.70%), Chinese (4.7%, a difference of 0.91%), Iranian (4.6%, a difference of 1.1%), Armenian (4.6%, a difference of 1.3%), and Immigrants from Singapore (4.7%, a difference of 1.3%).
| Demographics | Rating | Rank | Disability Age 5 to 17 |
| Immigrants from Israel | 100.0 /100 | #6 | Exceptional 4.5% |
| Immigrants from China | 100.0 /100 | #7 | Exceptional 4.5% |
| Indians (Asian) | 100.0 /100 | #8 | Exceptional 4.6% |
| Immigrants from Eastern Asia | 100.0 /100 | #9 | Exceptional 4.6% |
| Immigrants from India | 100.0 /100 | #10 | Exceptional 4.6% |
| Armenians | 100.0 /100 | #11 | Exceptional 4.6% |
| Iranians | 100.0 /100 | #12 | Exceptional 4.6% |
| Thais | 100.0 /100 | #13 | Exceptional 4.7% |
| Immigrants from Korea | 100.0 /100 | #14 | Exceptional 4.7% |
| Chinese | 100.0 /100 | #15 | Exceptional 4.7% |
| Immigrants from Singapore | 100.0 /100 | #16 | Exceptional 4.7% |
| Arapaho | 100.0 /100 | #17 | Exceptional 4.7% |
| Immigrants from South Central Asia | 100.0 /100 | #18 | Exceptional 4.7% |
| Immigrants from Uzbekistan | 100.0 /100 | #19 | Exceptional 4.8% |
| Burmese | 100.0 /100 | #20 | Exceptional 4.8% |
Thai Disability Age 5 to 17 Correlation Summary
| Measurement | Thai Data | Disability Age 5 to 17 Data |
| Minimum | 0.16% | 0.21% |
| Maximum | 70.1% | 9.3% |
| Range | 69.9% | 9.1% |
| Mean | 20.2% | 3.8% |
| Median | 18.8% | 3.8% |
| Interquartile 25% (IQ1) | 9.3% | 2.7% |
| Interquartile 75% (IQ3) | 29.5% | 4.7% |
| Interquartile Range (IQR) | 20.3% | 2.0% |
| Standard Deviation (Sample) | 13.6% | 1.6% |
| Standard Deviation (Population) | 13.5% | 1.6% |
Correlation Details
| Thai Percentile | Sample Size | Disability Age 5 to 17 |
[ 0.0% - 0.5% ] 0.16% | 127,075,254 | 6.9% |
[ 0.5% - 1.0% ] 0.52% | 85,562,450 | 6.3% |
[ 0.5% - 1.0% ] 0.86% | 58,533,196 | 6.0% |
[ 1.0% - 1.5% ] 1.20% | 37,868,430 | 5.5% |
[ 1.5% - 2.0% ] 1.56% | 29,906,814 | 5.6% |
[ 1.5% - 2.0% ] 1.90% | 20,748,844 | 5.0% |
[ 2.0% - 2.5% ] 2.27% | 16,402,152 | 5.2% |
[ 2.5% - 3.0% ] 2.61% | 11,318,203 | 4.9% |
[ 2.5% - 3.0% ] 2.96% | 18,766,846 | 4.8% |
[ 3.0% - 3.5% ] 3.32% | 10,375,090 | 4.8% |
[ 3.5% - 4.0% ] 3.67% | 5,241,262 | 4.6% |
[ 4.0% - 4.5% ] 4.01% | 5,214,197 | 4.9% |
[ 4.0% - 4.5% ] 4.38% | 4,842,742 | 4.9% |
[ 4.5% - 5.0% ] 4.73% | 3,812,163 | 4.6% |
[ 5.0% - 5.5% ] 5.09% | 3,324,020 | 4.2% |
[ 5.0% - 5.5% ] 5.41% | 2,214,841 | 4.5% |
[ 5.5% - 6.0% ] 5.76% | 3,223,085 | 4.2% |
[ 6.0% - 6.5% ] 6.16% | 1,819,363 | 3.7% |
[ 6.0% - 6.5% ] 6.50% | 1,503,788 | 4.1% |
[ 6.5% - 7.0% ] 6.81% | 1,437,057 | 3.7% |
[ 7.0% - 7.5% ] 7.20% | 1,108,199 | 3.8% |
[ 7.5% - 8.0% ] 7.60% | 1,943,053 | 4.5% |
[ 7.5% - 8.0% ] 7.89% | 1,121,176 | 3.9% |
[ 8.0% - 8.5% ] 8.24% | 762,974 | 4.2% |
[ 8.5% - 9.0% ] 8.62% | 853,855 | 3.6% |
[ 8.5% - 9.0% ] 8.99% | 579,843 | 4.3% |
[ 9.0% - 9.5% ] 9.29% | 705,310 | 3.9% |
[ 9.5% - 10.0% ] 9.63% | 693,128 | 4.1% |
[ 9.5% - 10.0% ] 9.95% | 641,314 | 4.0% |
[ 10.0% - 10.5% ] 10.36% | 521,305 | 3.9% |
[ 10.5% - 11.0% ] 10.67% | 536,988 | 3.3% |
[ 11.0% - 11.5% ] 11.08% | 638,460 | 4.4% |
[ 11.0% - 11.5% ] 11.37% | 891,181 | 3.8% |
[ 11.5% - 12.0% ] 11.82% | 176,407 | 3.5% |
[ 12.0% - 12.5% ] 12.07% | 505,052 | 4.2% |
[ 12.0% - 12.5% ] 12.38% | 427,516 | 3.3% |
[ 12.5% - 13.0% ] 12.80% | 842,011 | 3.6% |
[ 13.0% - 13.5% ] 13.10% | 409,266 | 3.3% |
[ 13.5% - 14.0% ] 13.62% | 491,966 | 3.8% |
[ 13.5% - 14.0% ] 13.89% | 265,048 | 5.1% |
[ 14.0% - 14.5% ] 14.23% | 373,043 | 3.1% |
[ 14.5% - 15.0% ] 14.56% | 674,122 | 4.6% |
[ 14.5% - 15.0% ] 14.89% | 209,726 | 2.7% |
[ 15.0% - 15.5% ] 15.35% | 391,618 | 3.3% |
[ 15.5% - 16.0% ] 15.60% | 235,822 | 3.8% |
[ 15.5% - 16.0% ] 15.96% | 143,530 | 2.7% |
[ 16.0% - 16.5% ] 16.34% | 92,918 | 4.3% |
[ 16.5% - 17.0% ] 16.61% | 209,590 | 6.3% |
[ 17.0% - 17.5% ] 17.02% | 75,830 | 3.3% |
[ 17.5% - 18.0% ] 17.51% | 28,337 | 2.5% |
[ 17.5% - 18.0% ] 17.72% | 473,197 | 3.5% |
[ 18.0% - 18.5% ] 18.00% | 253,698 | 3.5% |
[ 18.0% - 18.5% ] 18.36% | 95,553 | 2.5% |
[ 18.5% - 19.0% ] 18.84% | 147,156 | 3.6% |
[ 19.0% - 19.5% ] 19.08% | 5,069 | 0.98% |
[ 19.5% - 20.0% ] 19.51% | 332,773 | 3.4% |
[ 19.5% - 20.0% ] 19.85% | 121,376 | 2.7% |
[ 20.0% - 20.5% ] 20.10% | 223,691 | 2.3% |
[ 20.5% - 21.0% ] 20.62% | 84,480 | 1.9% |
[ 20.5% - 21.0% ] 20.81% | 268,320 | 3.2% |
[ 21.0% - 21.5% ] 21.28% | 139,153 | 4.1% |
[ 21.5% - 22.0% ] 21.57% | 97,178 | 3.0% |
[ 21.5% - 22.0% ] 21.83% | 101,053 | 2.5% |
[ 22.0% - 22.5% ] 22.29% | 120,806 | 3.4% |
[ 22.5% - 23.0% ] 22.68% | 208,151 | 4.3% |
[ 22.5% - 23.0% ] 22.84% | 106,155 | 2.0% |
[ 23.0% - 23.5% ] 23.25% | 36,973 | 2.0% |
[ 23.5% - 24.0% ] 23.64% | 101,208 | 3.5% |
[ 23.5% - 24.0% ] 23.87% | 27,794 | 2.5% |
[ 24.0% - 24.5% ] 24.45% | 248,641 | 3.8% |
[ 24.5% - 25.0% ] 24.81% | 7,857 | 1.9% |
[ 25.0% - 25.5% ] 25.01% | 20,339 | 2.7% |
[ 25.0% - 25.5% ] 25.35% | 30,207 | 4.2% |
[ 26.5% - 27.0% ] 26.61% | 27,571 | 7.4% |
[ 26.5% - 27.0% ] 26.78% | 114,355 | 5.3% |
[ 27.0% - 27.5% ] 27.23% | 188,552 | 4.3% |
[ 27.0% - 27.5% ] 27.36% | 19,544 | 5.2% |
[ 28.0% - 28.5% ] 28.34% | 18,949 | 1.7% |
[ 28.5% - 29.0% ] 28.70% | 69,659 | 2.6% |
[ 28.5% - 29.0% ] 28.87% | 95,566 | 2.8% |
[ 29.5% - 30.0% ] 29.55% | 63,508 | 1.8% |
[ 29.5% - 30.0% ] 29.83% | 254,494 | 2.9% |
[ 30.0% - 30.5% ] 30.38% | 76,857 | 1.9% |
[ 30.5% - 31.0% ] 30.61% | 51,153 | 4.7% |
[ 30.5% - 31.0% ] 30.99% | 102,097 | 3.3% |
[ 31.5% - 32.0% ] 31.68% | 30,392 | 3.8% |
[ 32.0% - 32.5% ] 32.12% | 3,695 | 5.3% |
[ 32.5% - 33.0% ] 32.52% | 61,363 | 1.2% |
[ 32.5% - 33.0% ] 32.75% | 2,766 | 7.8% |
[ 33.0% - 33.5% ] 33.28% | 5,018 | 9.3% |
[ 33.0% - 33.5% ] 33.44% | 21,806 | 5.3% |
[ 33.5% - 34.0% ] 33.67% | 802 | 6.1% |
[ 34.0% - 34.5% ] 34.38% | 15,702 | 0.21% |
[ 34.5% - 35.0% ] 34.86% | 68,587 | 5.6% |
[ 35.5% - 36.0% ] 35.98% | 29,756 | 1.5% |
[ 36.5% - 37.0% ] 36.59% | 20,954 | 0.42% |
[ 36.5% - 37.0% ] 36.84% | 1,425 | 7.6% |
[ 37.0% - 37.5% ] 37.20% | 53,464 | 1.1% |
[ 38.0% - 38.5% ] 38.30% | 5,206 | 1.0% |
[ 38.5% - 39.0% ] 38.87% | 2,560 | 4.9% |
[ 44.5% - 45.0% ] 44.79% | 53,744 | 6.1% |
[ 46.5% - 47.0% ] 46.92% | 21,452 | 1.4% |
[ 47.0% - 47.5% ] 47.30% | 20,693 | 2.1% |
[ 47.5% - 48.0% ] 47.55% | 44,570 | 2.9% |
[ 51.0% - 51.5% ] 51.35% | 2,300 | 3.0% |
[ 53.5% - 54.0% ] 53.98% | 39,565 | 2.8% |
[ 70.0% - 70.5% ] 70.11% | 2,549 | 1.3% |