Canadian Disability Age 5 to 17
COMPARE
Canadian
Select to Compare
Disability Age 5 to 17
Canadian Disability Age 5 to 17
6.0%
DISABILITY | AGE 5 TO 17
0.6/ 100
METRIC RATING
264th/ 347
METRIC RANK
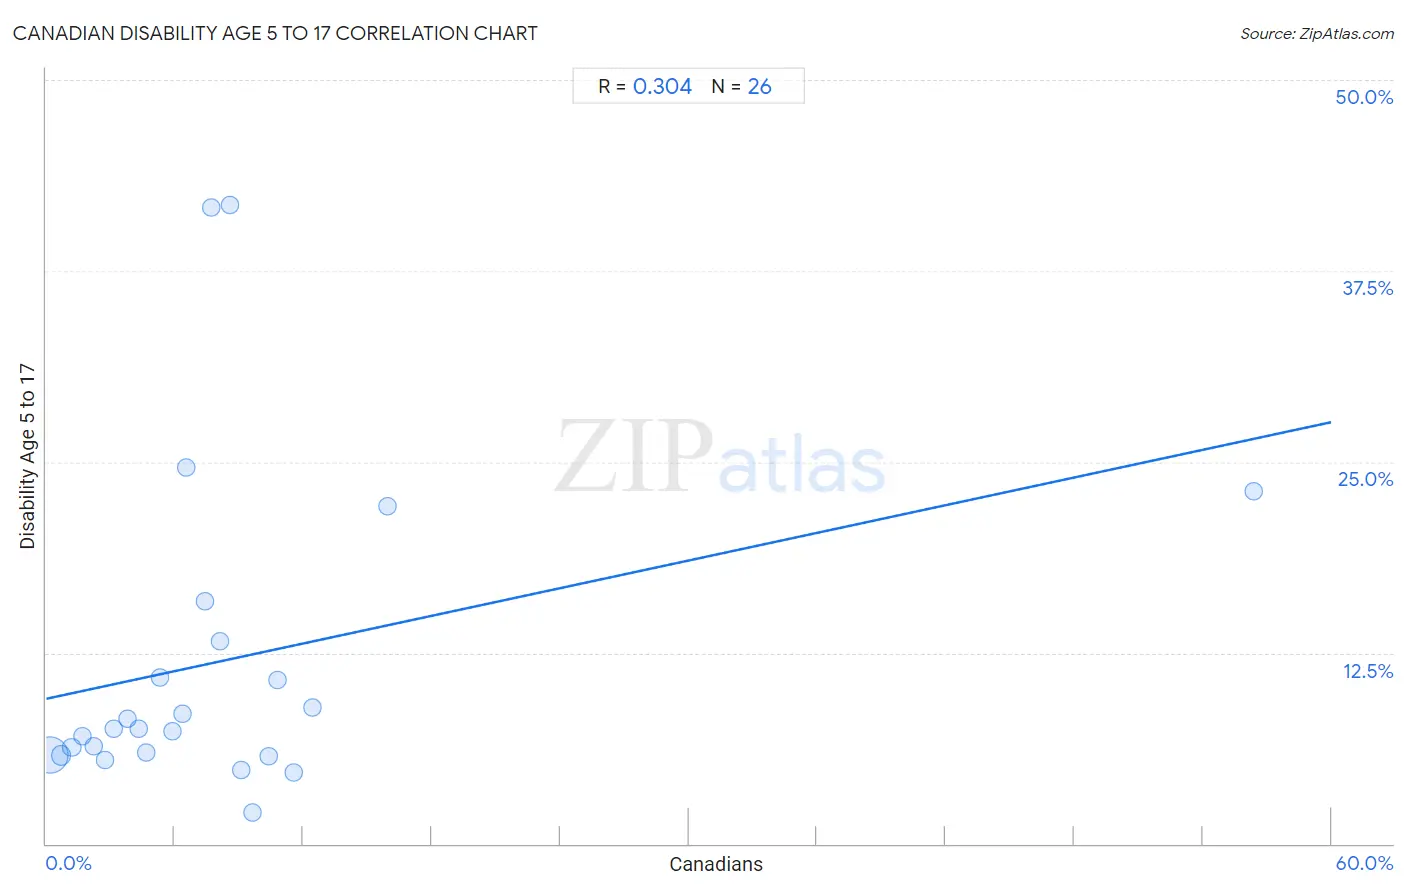
Canadian Disability Age 5 to 17 Correlation Chart
The statistical analysis conducted on geographies consisting of 432,656,335 people shows a mild positive correlation between the proportion of Canadians and percentage of population with a disability between the ages 5 and 17 in the United States with a correlation coefficient (R) of 0.304 and weighted average of 6.0%. On average, for every 1% (one percent) increase in Canadians within a typical geography, there is an increase of 0.30% in percentage of population with a disability between the ages 5 and 17.
It is essential to understand that the correlation between the percentage of Canadians and percentage of population with a disability between the ages 5 and 17 does not imply a direct cause-and-effect relationship. It remains uncertain whether the presence of Canadians influences an upward or downward trend in the level of percentage of population with a disability between the ages 5 and 17 within an area, or if Canadians simply ended up residing in those areas with higher or lower levels of percentage of population with a disability between the ages 5 and 17 due to other factors.
Demographics Similar to Canadians by Disability Age 5 to 17
In terms of disability age 5 to 17, the demographic groups most similar to Canadians are Panamanian (6.0%, a difference of 0.070%), Slovene (6.0%, a difference of 0.10%), Czechoslovakian (5.9%, a difference of 0.12%), Immigrants from Western Africa (5.9%, a difference of 0.20%), and Spanish (6.0%, a difference of 0.21%).
| Demographics | Rating | Rank | Disability Age 5 to 17 |
| Hispanics or Latinos | 1.0 /100 | #257 | Tragic 5.9% |
| Brazilians | 0.9 /100 | #258 | Tragic 5.9% |
| Slavs | 0.9 /100 | #259 | Tragic 5.9% |
| Somalis | 0.8 /100 | #260 | Tragic 5.9% |
| Immigrants from Middle Africa | 0.7 /100 | #261 | Tragic 5.9% |
| Immigrants from Western Africa | 0.7 /100 | #262 | Tragic 5.9% |
| Czechoslovakians | 0.7 /100 | #263 | Tragic 5.9% |
| Canadians | 0.6 /100 | #264 | Tragic 6.0% |
| Panamanians | 0.6 /100 | #265 | Tragic 6.0% |
| Slovenes | 0.6 /100 | #266 | Tragic 6.0% |
| Spanish | 0.5 /100 | #267 | Tragic 6.0% |
| Sioux | 0.4 /100 | #268 | Tragic 6.0% |
| Liberians | 0.4 /100 | #269 | Tragic 6.0% |
| Immigrants from Somalia | 0.4 /100 | #270 | Tragic 6.0% |
| Immigrants from Zaire | 0.2 /100 | #271 | Tragic 6.0% |
Canadian Disability Age 5 to 17 Correlation Summary
| Measurement | Canadian Data | Disability Age 5 to 17 Data |
| Minimum | 0.16% | 2.1% |
| Maximum | 56.4% | 41.8% |
| Range | 56.2% | 39.7% |
| Mean | 8.3% | 12.0% |
| Median | 6.4% | 7.5% |
| Interquartile 25% (IQ1) | 3.1% | 5.8% |
| Interquartile 75% (IQ3) | 9.6% | 13.2% |
| Interquartile Range (IQR) | 6.5% | 7.4% |
| Standard Deviation (Sample) | 10.6% | 10.5% |
| Standard Deviation (Population) | 10.4% | 10.3% |
Correlation Details
| Canadian Percentile | Sample Size | Disability Age 5 to 17 |
[ 0.0% - 0.5% ] 0.16% | 390,863,499 | 5.8% |
[ 0.5% - 1.0% ] 0.67% | 33,444,518 | 5.8% |
[ 1.0% - 1.5% ] 1.19% | 5,284,434 | 6.3% |
[ 1.5% - 2.0% ] 1.68% | 1,787,429 | 7.0% |
[ 2.0% - 2.5% ] 2.25% | 606,793 | 6.4% |
[ 2.5% - 3.0% ] 2.76% | 232,652 | 5.5% |
[ 3.0% - 3.5% ] 3.14% | 138,340 | 7.5% |
[ 3.5% - 4.0% ] 3.80% | 122,687 | 8.2% |
[ 4.0% - 4.5% ] 4.32% | 49,920 | 7.5% |
[ 4.5% - 5.0% ] 4.67% | 51,636 | 5.9% |
[ 5.0% - 5.5% ] 5.29% | 8,959 | 10.9% |
[ 5.5% - 6.0% ] 5.87% | 5,711 | 7.4% |
[ 6.0% - 6.5% ] 6.34% | 35,172 | 8.5% |
[ 6.5% - 7.0% ] 6.54% | 367 | 24.6% |
[ 7.0% - 7.5% ] 7.40% | 1,595 | 15.9% |
[ 7.5% - 8.0% ] 7.69% | 78 | 41.7% |
[ 8.0% - 8.5% ] 8.14% | 2,997 | 13.2% |
[ 8.5% - 9.0% ] 8.57% | 6,146 | 41.8% |
[ 9.0% - 9.5% ] 9.12% | 2,961 | 4.8% |
[ 9.5% - 10.0% ] 9.65% | 2,768 | 2.1% |
[ 10.0% - 10.5% ] 10.38% | 530 | 5.8% |
[ 10.5% - 11.0% ] 10.79% | 1,566 | 10.8% |
[ 11.5% - 12.0% ] 11.57% | 847 | 4.7% |
[ 12.0% - 12.5% ] 12.46% | 2,560 | 8.9% |
[ 15.5% - 16.0% ] 15.91% | 2,037 | 22.1% |
[ 56.0% - 56.5% ] 56.39% | 133 | 23.1% |