Nebraska Map & Demographics
Nebraska Map
Nebraska Overview
Mar 1, 1867
INCORPORATED
77,349
TOTAL AREA [ SQ MI ]
76,825
LAND AREA [ SQ MI ]
524
WATER AREA [ SQ MI ]
2,600
ELEVATION AVG [ FT ]
5,424
ELEVATION HIGH [ FT ]
840
ELEVATION LOW [ FT ]
25.5
POP DENSITY [ PPL / SQ MI ]
$38,585
PER CAPITA INCOME
$92,614
AVG FAMILY INCOME
$71,722
AVG HOUSEHOLD INCOME
29.0%
WAGE / INCOME GAP [ % ]
71.0¢/ $1
WAGE / INCOME GAP [ $ ]
$10,263
FAMILY INCOME DEFICIT
0.45
INEQUALITY / GINI INDEX
68516
LARGEST ZIP CODE
Omaha
LARGEST CITY
Douglas County
LARGEST COUNTY
1,958,939
TOTAL POPULATION
984,570
MALE POPULATION
974,369
FEMALE POPULATION
101.05
MALES / 100 FEMALES
98.96
FEMALES / 100 MALES
36.9
MEDIAN AGE
3.1
AVG FAMILY SIZE
2.5
AVG HOUSEHOLD SIZE
1,054,257
LABOR FORCE [ PEOPLE ]
68.8%
PERCENT IN LABOR FORCE
3.1%
UNEMPLOYMENT RATE
Income in Nebraska
Income Overview in Nebraska
Per Capita Income in Nebraska is $38,585, while median incomes of families and households are $92,614 and $71,722 respectively.
| Characteristic | Number | Measure |
| Per Capita Income | 1,958,939 | $38,585 |
| Median Family Income | 490,531 | $92,614 |
| Mean Family Income | 490,531 | $116,527 |
| Median Household Income | 776,379 | $71,722 |
| Mean Household Income | 776,379 | $95,547 |
| Income Deficit | 490,531 | $10,263 |
| Wage / Income Gap (%) | 1,958,939 | 29.03% |
| Wage / Income Gap ($) | 1,958,939 | 70.97¢ per $1 |
| Gini / Inequality Index | 1,958,939 | 0.45 |
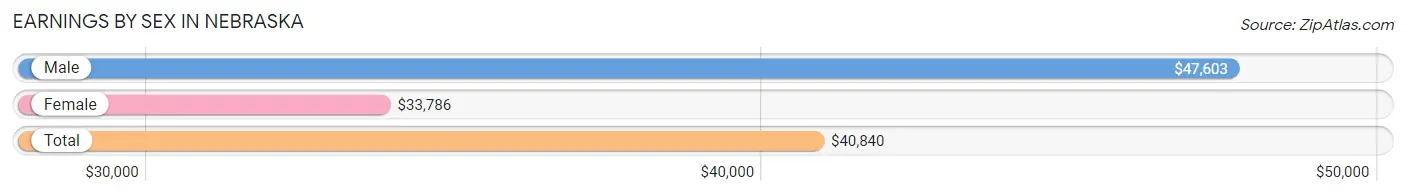
Earnings by Sex in Nebraska
Average Earnings in Nebraska are $40,840, $47,603 for men and $33,786 for women, a difference of 29.0%.
| Sex | Number | Average Earnings |
| Male | 595,657 (53.3%) | $47,603 |
| Female | 522,388 (46.7%) | $33,786 |
| Total | 1,118,045 (100.0%) | $40,840 |
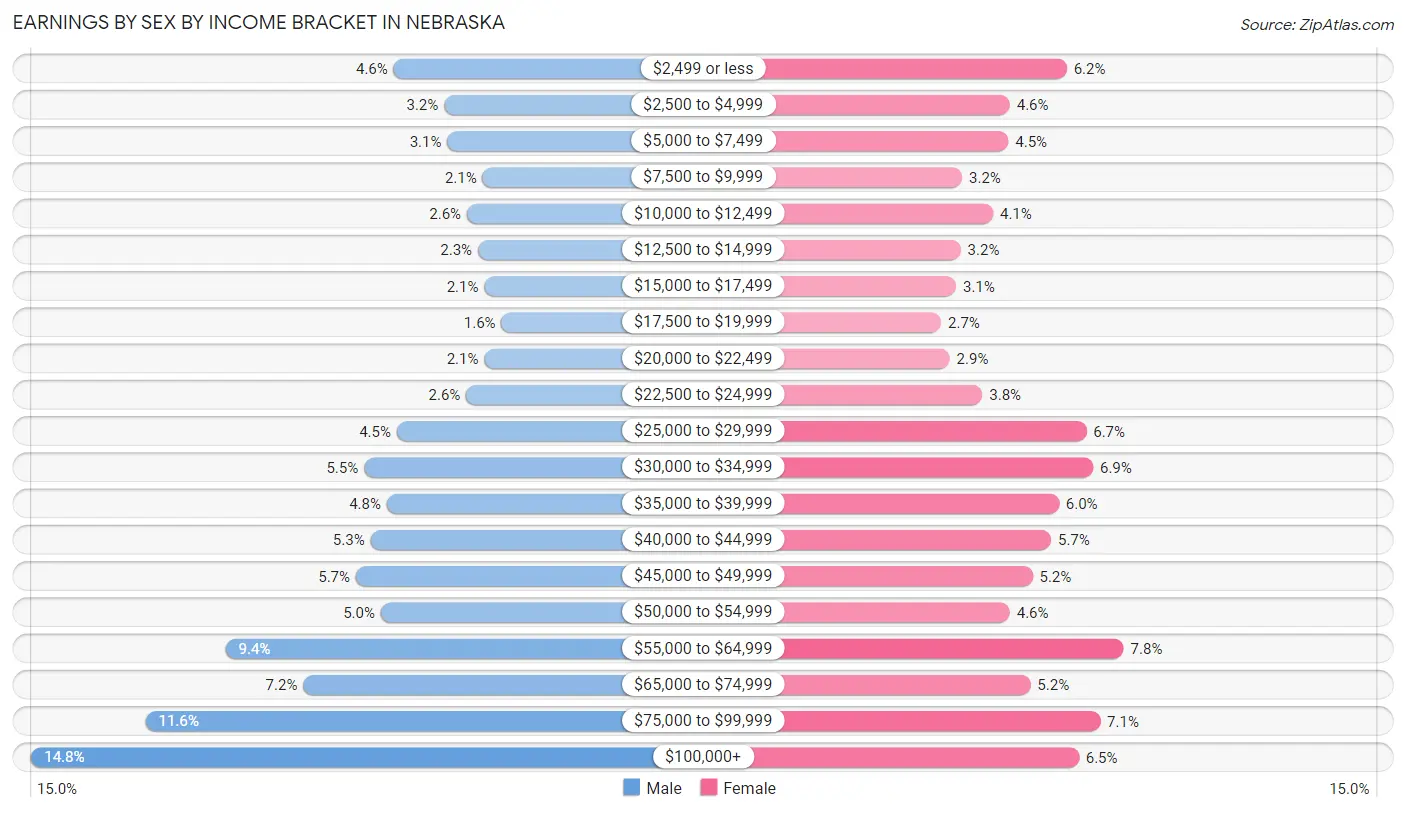
Earnings by Sex by Income Bracket in Nebraska
The most common earnings brackets in Nebraska are $100,000+ for men (88,217 | 14.8%) and $55,000 to $64,999 for women (40,655 | 7.8%).
| Income | Male | Female |
| $2,499 or less | 27,575 (4.6%) | 32,259 (6.2%) |
| $2,500 to $4,999 | 19,149 (3.2%) | 23,946 (4.6%) |
| $5,000 to $7,499 | 18,593 (3.1%) | 23,703 (4.5%) |
| $7,500 to $9,999 | 12,670 (2.1%) | 16,939 (3.2%) |
| $10,000 to $12,499 | 15,326 (2.6%) | 21,466 (4.1%) |
| $12,500 to $14,999 | 13,474 (2.3%) | 16,730 (3.2%) |
| $15,000 to $17,499 | 12,376 (2.1%) | 16,057 (3.1%) |
| $17,500 to $19,999 | 9,555 (1.6%) | 13,856 (2.6%) |
| $20,000 to $22,499 | 12,418 (2.1%) | 15,094 (2.9%) |
| $22,500 to $24,999 | 15,450 (2.6%) | 19,887 (3.8%) |
| $25,000 to $29,999 | 27,028 (4.5%) | 35,142 (6.7%) |
| $30,000 to $34,999 | 32,517 (5.5%) | 36,149 (6.9%) |
| $35,000 to $39,999 | 28,719 (4.8%) | 31,160 (6.0%) |
| $40,000 to $44,999 | 31,466 (5.3%) | 29,982 (5.7%) |
| $45,000 to $49,999 | 33,918 (5.7%) | 27,261 (5.2%) |
| $50,000 to $54,999 | 29,702 (5.0%) | 23,940 (4.6%) |
| $55,000 to $64,999 | 55,684 (9.3%) | 40,655 (7.8%) |
| $65,000 to $74,999 | 42,712 (7.2%) | 26,946 (5.2%) |
| $75,000 to $99,999 | 69,108 (11.6%) | 37,178 (7.1%) |
| $100,000+ | 88,217 (14.8%) | 34,038 (6.5%) |
| Total | 595,657 (100.0%) | 522,388 (100.0%) |
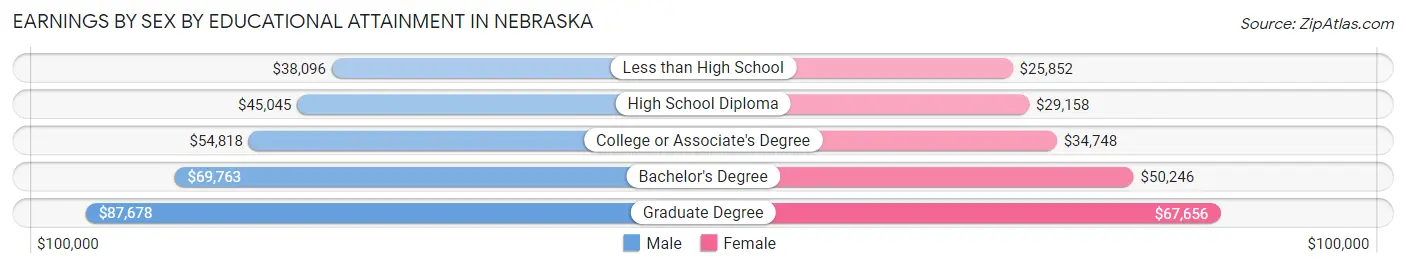
Earnings by Sex by Educational Attainment in Nebraska
Average earnings in Nebraska are $55,637 for men and $40,072 for women, a difference of 28.0%. Men with an educational attainment of graduate degree enjoy the highest average annual earnings of $87,678, while those with less than high school education earn the least with $38,096. Women with an educational attainment of graduate degree earn the most with the average annual earnings of $67,656, while those with less than high school education have the smallest earnings of $25,852.
| Educational Attainment | Male Income | Female Income |
| Less than High School | $38,096 | $25,852 |
| High School Diploma | $45,045 | $29,158 |
| College or Associate's Degree | $54,818 | $34,748 |
| Bachelor's Degree | $69,763 | $50,246 |
| Graduate Degree | $87,678 | $67,656 |
| Total | $55,637 | $40,072 |
Family Income in Nebraska
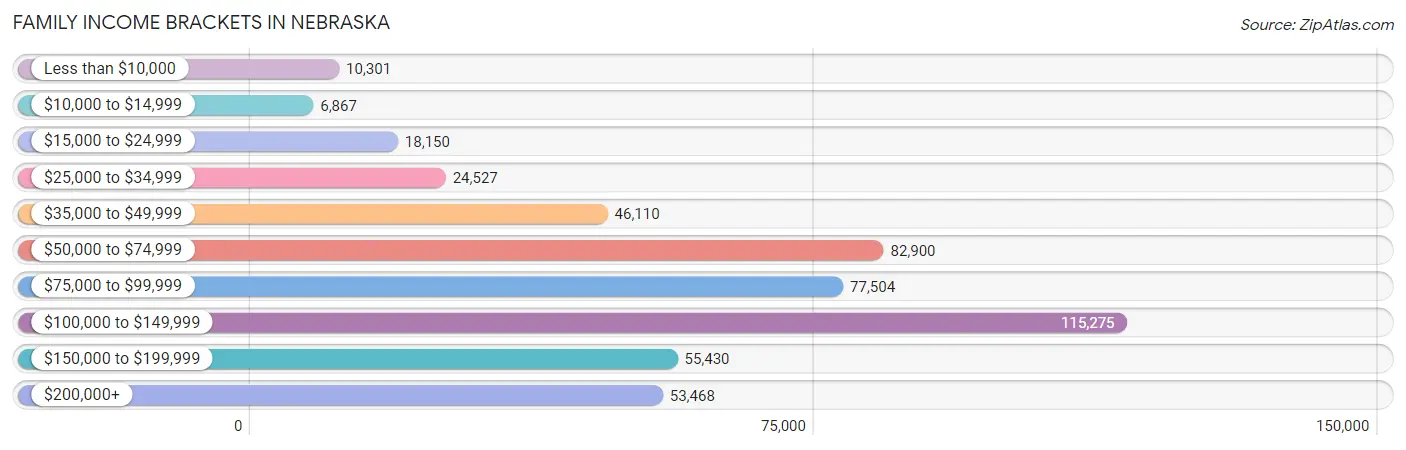
Family Income Brackets in Nebraska
According to the Nebraska family income data, there are 115,275 families falling into the $100,000 to $149,999 income range, which is the most common income bracket and makes up 23.5% of all families. Conversely, the $10,000 to $14,999 income bracket is the least frequent group with only 6,867 families (1.4%) belonging to this category.
| Income Bracket | # Families | % Families |
| Less than $10,000 | 10,301 | 2.1% |
| $10,000 to $14,999 | 6,867 | 1.4% |
| $15,000 to $24,999 | 18,150 | 3.7% |
| $25,000 to $34,999 | 24,527 | 5.0% |
| $35,000 to $49,999 | 46,110 | 9.4% |
| $50,000 to $74,999 | 82,900 | 16.9% |
| $75,000 to $99,999 | 77,504 | 15.8% |
| $100,000 to $149,999 | 115,275 | 23.5% |
| $150,000 to $199,999 | 55,430 | 11.3% |
| $200,000+ | 53,468 | 10.9% |
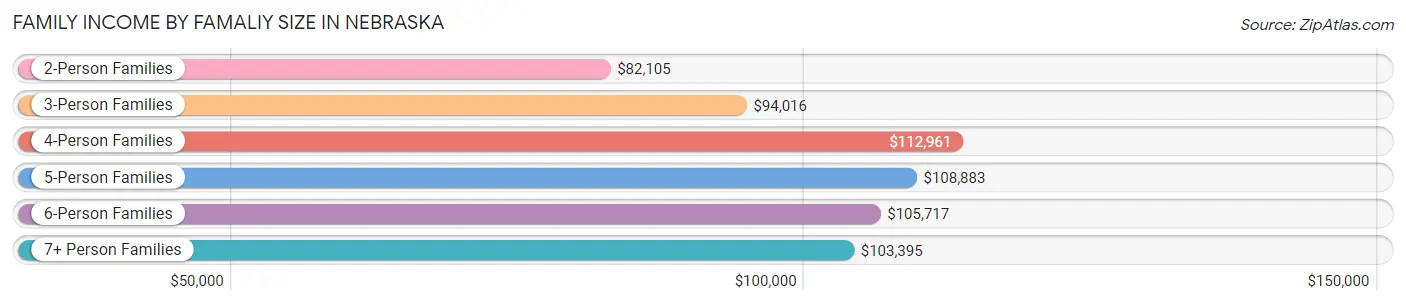
Family Income by Famaliy Size in Nebraska
4-person families (82,356 | 16.8%) account for the highest median family income in Nebraska with $112,961 per family, while 2-person families (242,346 | 49.4%) have the highest median income of $41,052 per family member.
| Income Bracket | # Families | Median Income |
| 2-Person Families | 242,346 (49.4%) | $82,105 |
| 3-Person Families | 95,397 (19.5%) | $94,016 |
| 4-Person Families | 82,356 (16.8%) | $112,961 |
| 5-Person Families | 44,939 (9.2%) | $108,883 |
| 6-Person Families | 16,644 (3.4%) | $105,717 |
| 7+ Person Families | 8,849 (1.8%) | $103,395 |
| Total | 490,531 (100.0%) | $92,614 |
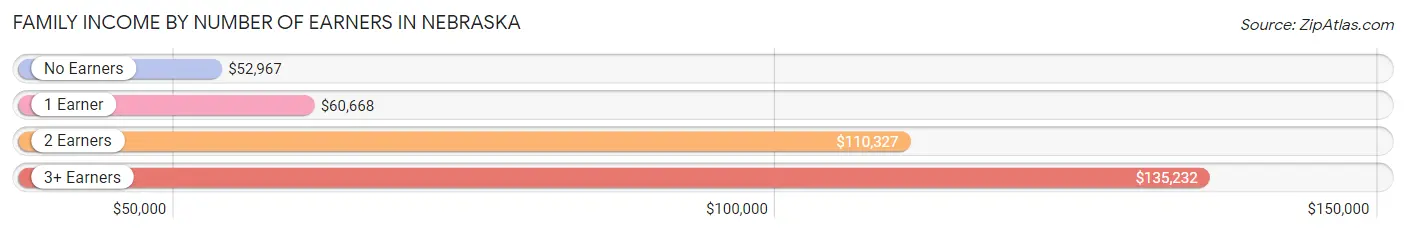
Family Income by Number of Earners in Nebraska
The median family income in Nebraska is $92,614, with families comprising 3+ earners (57,876) having the highest median family income of $135,232, while families with no earners (58,105) have the lowest median family income of $52,967, accounting for 11.8% and 11.8% of families, respectively.
| Number of Earners | # Families | Median Income |
| No Earners | 58,105 (11.8%) | $52,967 |
| 1 Earner | 136,980 (27.9%) | $60,668 |
| 2 Earners | 237,570 (48.4%) | $110,327 |
| 3+ Earners | 57,876 (11.8%) | $135,232 |
| Total | 490,531 (100.0%) | $92,614 |
Household Income in Nebraska
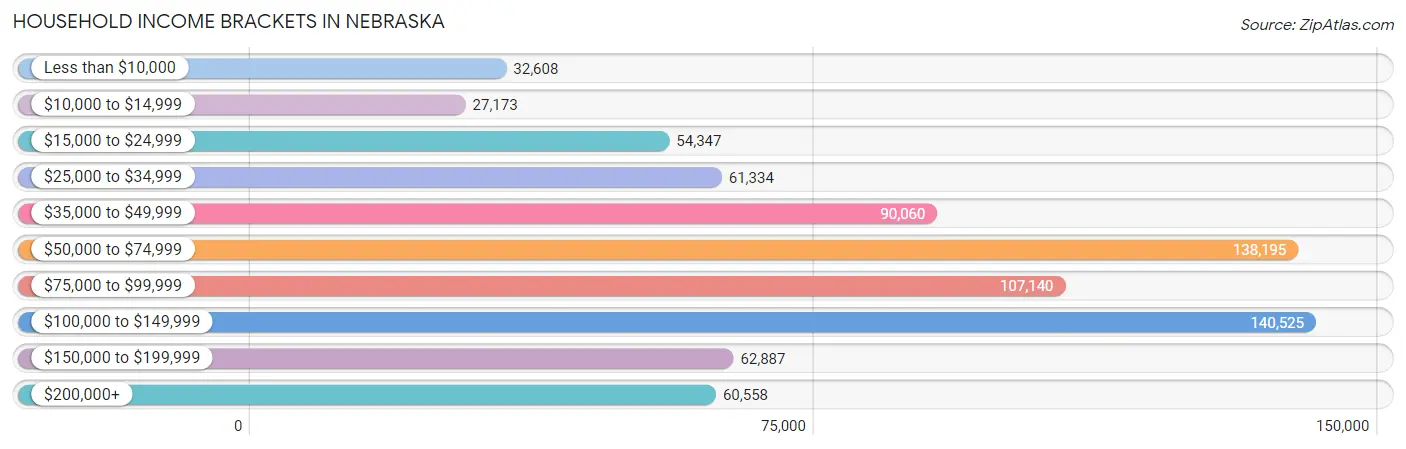
Household Income Brackets in Nebraska
With 140,525 households falling in the category, the $100,000 to $149,999 income range is the most frequent in Nebraska, accounting for 18.1% of all households. In contrast, only 27,173 households (3.5%) fall into the $10,000 to $14,999 income bracket, making it the least populous group.
| Income Bracket | # Households | % Households |
| Less than $10,000 | 32,608 | 4.2% |
| $10,000 to $14,999 | 27,173 | 3.5% |
| $15,000 to $24,999 | 54,347 | 7.0% |
| $25,000 to $34,999 | 61,334 | 7.9% |
| $35,000 to $49,999 | 90,060 | 11.6% |
| $50,000 to $74,999 | 138,195 | 17.8% |
| $75,000 to $99,999 | 107,140 | 13.8% |
| $100,000 to $149,999 | 140,525 | 18.1% |
| $150,000 to $199,999 | 62,887 | 8.1% |
| $200,000+ | 60,558 | 7.8% |
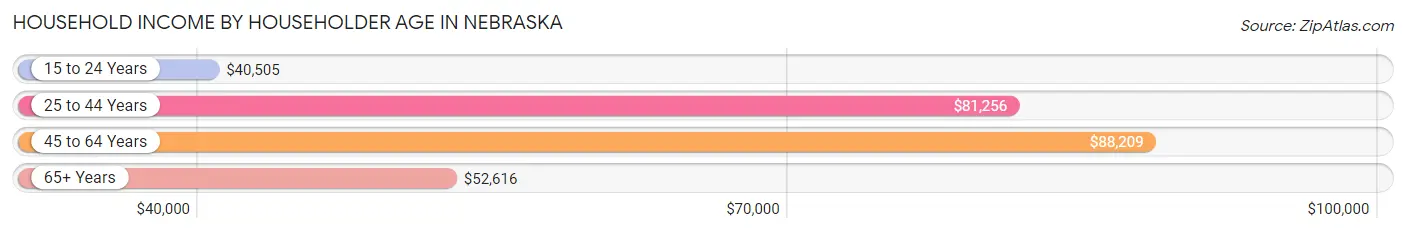
Household Income by Householder Age in Nebraska
The median household income in Nebraska is $71,722, with the highest median household income of $88,209 found in the 45 to 64 years age bracket for the primary householder. A total of 266,552 households (34.3%) fall into this category. Meanwhile, the 15 to 24 years age bracket for the primary householder has the lowest median household income of $40,505, with 47,480 households (6.1%) in this group.
| Income Bracket | # Households | Median Income |
| 15 to 24 Years | 47,480 (6.1%) | $40,505 |
| 25 to 44 Years | 261,945 (33.7%) | $81,256 |
| 45 to 64 Years | 266,552 (34.3%) | $88,209 |
| 65+ Years | 200,402 (25.8%) | $52,616 |
| Total | 776,379 (100.0%) | $71,722 |
Poverty in Nebraska
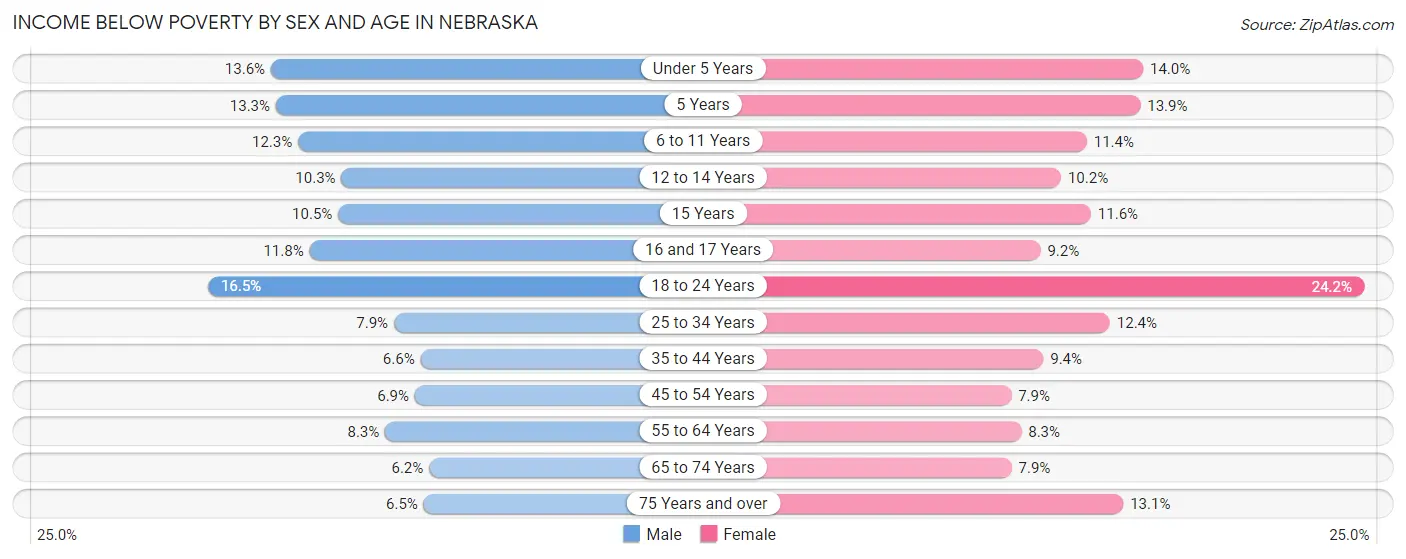
Income Below Poverty by Sex and Age in Nebraska
With 9.3% poverty level for males and 11.5% for females among the residents of Nebraska, 18 to 24 year old males and 18 to 24 year old females are the most vulnerable to poverty, with 14,716 males (16.5%) and 20,484 females (24.2%) in their respective age groups living below the poverty level.
| Age Bracket | Male | Female |
| Under 5 Years | 8,669 (13.6%) | 8,531 (14.0%) |
| 5 Years | 1,804 (13.3%) | 1,847 (13.9%) |
| 6 to 11 Years | 10,021 (12.3%) | 8,643 (11.4%) |
| 12 to 14 Years | 4,289 (10.3%) | 4,063 (10.2%) |
| 15 Years | 1,464 (10.4%) | 1,599 (11.6%) |
| 16 and 17 Years | 3,263 (11.8%) | 2,351 (9.2%) |
| 18 to 24 Years | 14,716 (16.5%) | 20,484 (24.2%) |
| 25 to 34 Years | 10,022 (7.9%) | 15,336 (12.4%) |
| 35 to 44 Years | 8,392 (6.6%) | 11,368 (9.3%) |
| 45 to 54 Years | 7,713 (6.9%) | 8,322 (7.9%) |
| 55 to 64 Years | 9,933 (8.3%) | 9,993 (8.3%) |
| 65 to 74 Years | 5,490 (6.2%) | 7,480 (7.9%) |
| 75 Years and over | 3,342 (6.5%) | 9,331 (13.1%) |
| Total | 89,118 (9.3%) | 109,348 (11.5%) |
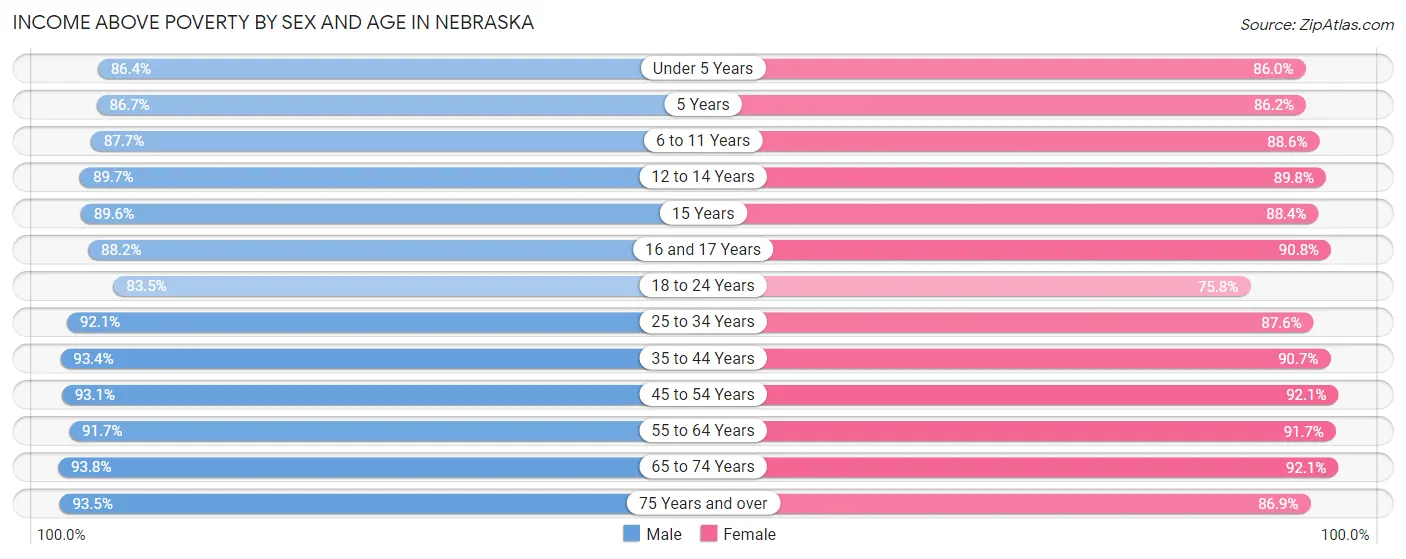
Income Above Poverty by Sex and Age in Nebraska
According to the poverty statistics in Nebraska, males aged 65 to 74 years and females aged 45 to 54 years are the age groups that are most secure financially, with 93.8% of males and 92.1% of females in these age groups living above the poverty line.
| Age Bracket | Male | Female |
| Under 5 Years | 55,213 (86.4%) | 52,480 (86.0%) |
| 5 Years | 11,723 (86.7%) | 11,490 (86.2%) |
| 6 to 11 Years | 71,411 (87.7%) | 67,380 (88.6%) |
| 12 to 14 Years | 37,344 (89.7%) | 35,887 (89.8%) |
| 15 Years | 12,547 (89.5%) | 12,232 (88.4%) |
| 16 and 17 Years | 24,434 (88.2%) | 23,144 (90.8%) |
| 18 to 24 Years | 74,553 (83.5%) | 64,084 (75.8%) |
| 25 to 34 Years | 117,523 (92.1%) | 107,906 (87.6%) |
| 35 to 44 Years | 118,262 (93.4%) | 110,200 (90.6%) |
| 45 to 54 Years | 104,295 (93.1%) | 97,508 (92.1%) |
| 55 to 64 Years | 110,127 (91.7%) | 110,015 (91.7%) |
| 65 to 74 Years | 82,636 (93.8%) | 87,436 (92.1%) |
| 75 Years and over | 48,202 (93.5%) | 62,115 (86.9%) |
| Total | 868,270 (90.7%) | 841,877 (88.5%) |
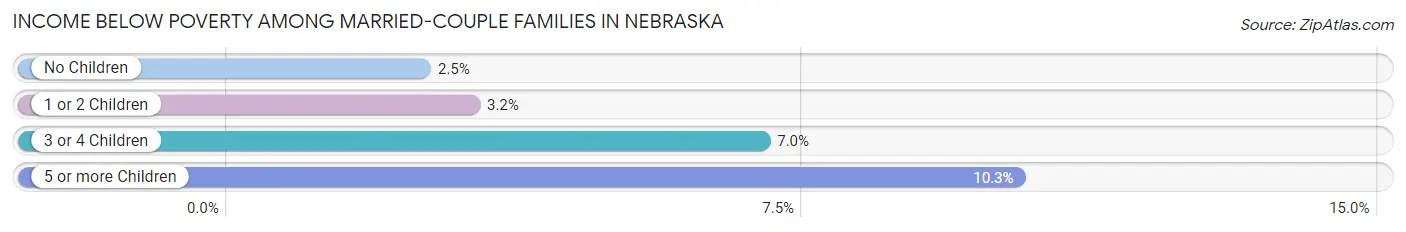
Income Below Poverty Among Married-Couple Families in Nebraska
The poverty statistics for married-couple families in Nebraska show that 3.3% or 12,628 of the total 382,954 families live below the poverty line. Families with 5 or more children have the highest poverty rate of 10.3%, comprising of 430 families. On the other hand, families with no children have the lowest poverty rate of 2.5%, which includes 5,551 families.
| Children | Above Poverty | Below Poverty |
| No Children | 214,420 (97.5%) | 5,551 (2.5%) |
| 1 or 2 Children | 112,138 (96.8%) | 3,660 (3.2%) |
| 3 or 4 Children | 40,015 (93.0%) | 2,987 (7.0%) |
| 5 or more Children | 3,753 (89.7%) | 430 (10.3%) |
| Total | 370,326 (96.7%) | 12,628 (3.3%) |
Income Below Poverty Among Single-Parent Households in Nebraska
According to the poverty data in Nebraska, 10.8% or 3,809 single-father households and 22.5% or 16,244 single-mother households are living below the poverty line. Among single-father households, those with 5 or more children have the highest poverty rate, with 78 households (17.4%) experiencing poverty. Likewise, among single-mother households, those with 5 or more children have the highest poverty rate, with 613 households (47.2%) falling below the poverty line.
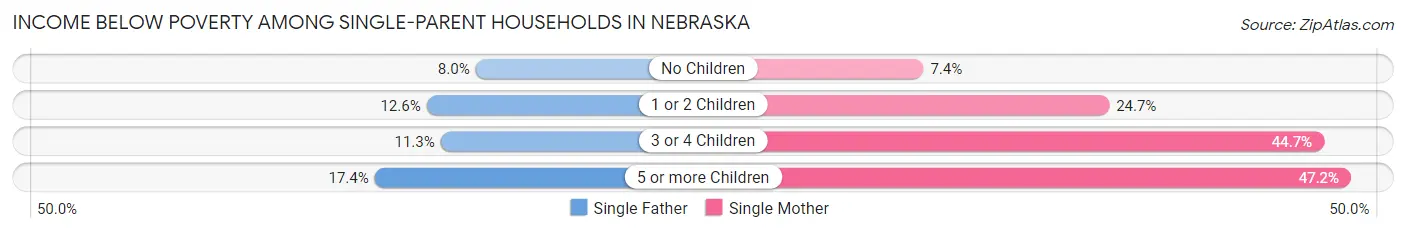
| Children | Single Father | Single Mother |
| No Children | 1,094 (8.0%) | 1,625 (7.4%) |
| 1 or 2 Children | 2,284 (12.6%) | 9,774 (24.7%) |
| 3 or 4 Children | 353 (11.3%) | 4,232 (44.7%) |
| 5 or more Children | 78 (17.4%) | 613 (47.2%) |
| Total | 3,809 (10.8%) | 16,244 (22.5%) |
Income Below Poverty Among Married-Couple vs Single-Parent Households in Nebraska
The poverty data for Nebraska shows that 12,628 of the married-couple family households (3.3%) and 20,053 of the single-parent households (18.6%) are living below the poverty level. Within the married-couple family households, those with 5 or more children have the highest poverty rate, with 430 households (10.3%) falling below the poverty line. Among the single-parent households, those with 5 or more children have the highest poverty rate, with 691 household (39.6%) living below poverty.
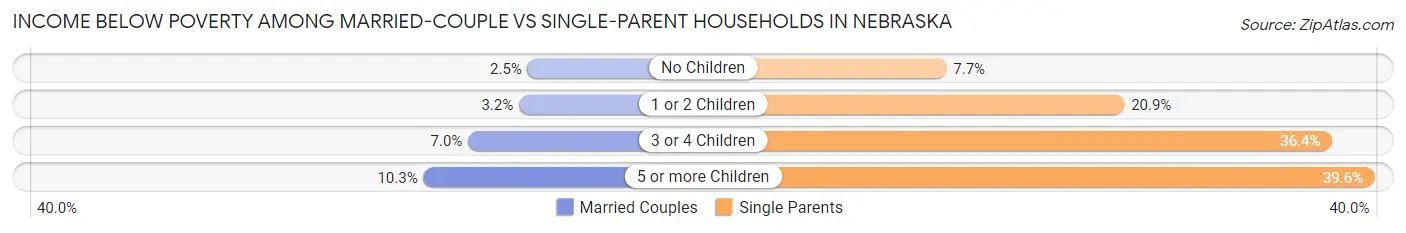
| Children | Married-Couple Families | Single-Parent Households |
| No Children | 5,551 (2.5%) | 2,719 (7.6%) |
| 1 or 2 Children | 3,660 (3.2%) | 12,058 (20.9%) |
| 3 or 4 Children | 2,987 (7.0%) | 4,585 (36.4%) |
| 5 or more Children | 430 (10.3%) | 691 (39.6%) |
| Total | 12,628 (3.3%) | 20,053 (18.6%) |
Largest Zip Codes by Population in Nebraska
The largest zip codes in Nebraska by population are 68516 (46,714), 68521 (38,231), 68104 (37,834), 68116 (33,936), and 68123 (33,758).
1.68516
46,714 (2.38%)
2.68521
38,231 (1.95%)
3.68104
37,834 (1.93%)
4.68116
33,936 (1.73%)
5.68123
33,758 (1.72%)
6.68046
33,312 (1.70%)
7.68022
32,570 (1.66%)
8.68025
31,304 (1.60%)
9.68701
31,116 (1.59%)
10.68801
30,277 (1.55%)
11.68601
30,224 (1.54%)
12.68135
30,216 (1.54%)
13.68107
29,779 (1.52%)
14.68134
29,580 (1.51%)
15.68164
29,359 (1.50%)
16.68506
28,321 (1.45%)
17.69101
28,136 (1.44%)
18.68502
26,784 (1.37%)
19.68901
26,307 (1.34%)
20.68803
25,824 (1.32%)
21.68144
25,565 (1.31%)
22.68137
24,580 (1.25%)
23.68111
24,028 (1.23%)
24.68154
23,345 (1.19%)
25.68105
22,698 (1.16%)
26.68005
21,937 (1.12%)
27.68130
21,444 (1.09%)
28.68106
21,401 (1.09%)
29.68845
21,234 (1.08%)
30.68127
20,820 (1.06%)
Largest Cities by Population in Nebraska
The largest cities in Nebraska by population are Omaha (489,201), Lincoln (290,531), Bellevue (63,336), Grand Island (52,822), and Kearney (33,809).
1.Omaha
489,201 (24.97%)
2.Lincoln
290,531 (14.83%)
3.Bellevue
63,336 (3.23%)
52,822 (2.70%)
5.Kearney
33,809 (1.73%)
6.Fremont
27,230 (1.39%)
7.Norfolk
25,883 (1.32%)
8.Hastings
25,098 (1.28%)
9.Columbus
24,035 (1.23%)
10.Papillion
24,016 (1.23%)
11.North Platte
23,309 (1.19%)
12.La Vista
16,713 (0.85%)
13.Scottsbluff
14,454 (0.74%)
13,835 (0.71%)
15.Beatrice
12,237 (0.62%)
16.Lexington
10,662 (0.54%)
17.Chalco
10,457 (0.53%)
18.Gretna
9,019 (0.46%)
19.Gering
8,582 (0.44%)
20.Alliance
8,118 (0.41%)
21.York
8,101 (0.41%)
22.Blair
7,813 (0.40%)
23.Seward
7,667 (0.39%)
24.McCook
7,412 (0.38%)
7,257 (0.37%)
26.Crete
7,093 (0.36%)
27.Plattsmouth
6,585 (0.34%)
28.Schuyler
6,516 (0.33%)
29.Ralston
6,462 (0.33%)
30.Sidney
6,407 (0.33%)
Largest Counties by Population in Nebraska
The largest counties in Nebraska by population are Douglas County (582,638), Lancaster County (322,063), Sarpy County (191,272), Hall County (62,575), and Buffalo County (50,103).
582,638 (29.74%)
322,063 (16.44%)
191,272 (9.76%)
62,575 (3.19%)
50,103 (2.56%)
37,175 (1.90%)
36,048 (1.84%)
35,538 (1.81%)
34,532 (1.76%)
34,219 (1.75%)
11.Adams County
31,143 (1.59%)
12.Cass County
26,749 (1.37%)
24,037 (1.23%)
22,374 (1.14%)
15.Gage County
21,654 (1.11%)
21,308 (1.09%)
20,884 (1.07%)
17,644 (0.90%)
19.Otoe County
15,995 (0.82%)
14,275 (0.73%)
21.York County
14,212 (0.73%)
10,778 (0.55%)
10,690 (0.55%)
10,566 (0.54%)
10,563 (0.54%)
26.Holt County
10,149 (0.52%)
27.Wayne County
9,701 (0.50%)
9,489 (0.48%)
9,400 (0.48%)
9,000 (0.46%)
Race in Nebraska
The most populous races in Nebraska are White / Caucasian (1,603,239 | 81.8%), Hispanic or Latino (230,769 | 11.8%), and Two or more Races (124,088 | 6.3%).
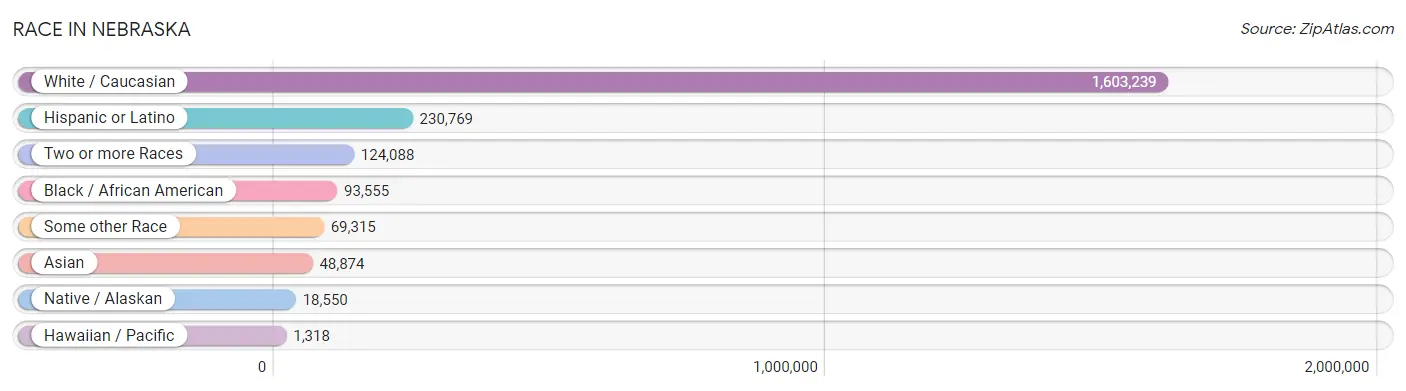
| Race | # Population | % Population |
| Asian | 48,874 | 2.5% |
| Black / African American | 93,555 | 4.8% |
| Hawaiian / Pacific | 1,318 | 0.1% |
| Hispanic or Latino | 230,769 | 11.8% |
| Native / Alaskan | 18,550 | 0.9% |
| White / Caucasian | 1,603,239 | 81.8% |
| Two or more Races | 124,088 | 6.3% |
| Some other Race | 69,315 | 3.5% |
| Total | 1,958,939 | 100.0% |
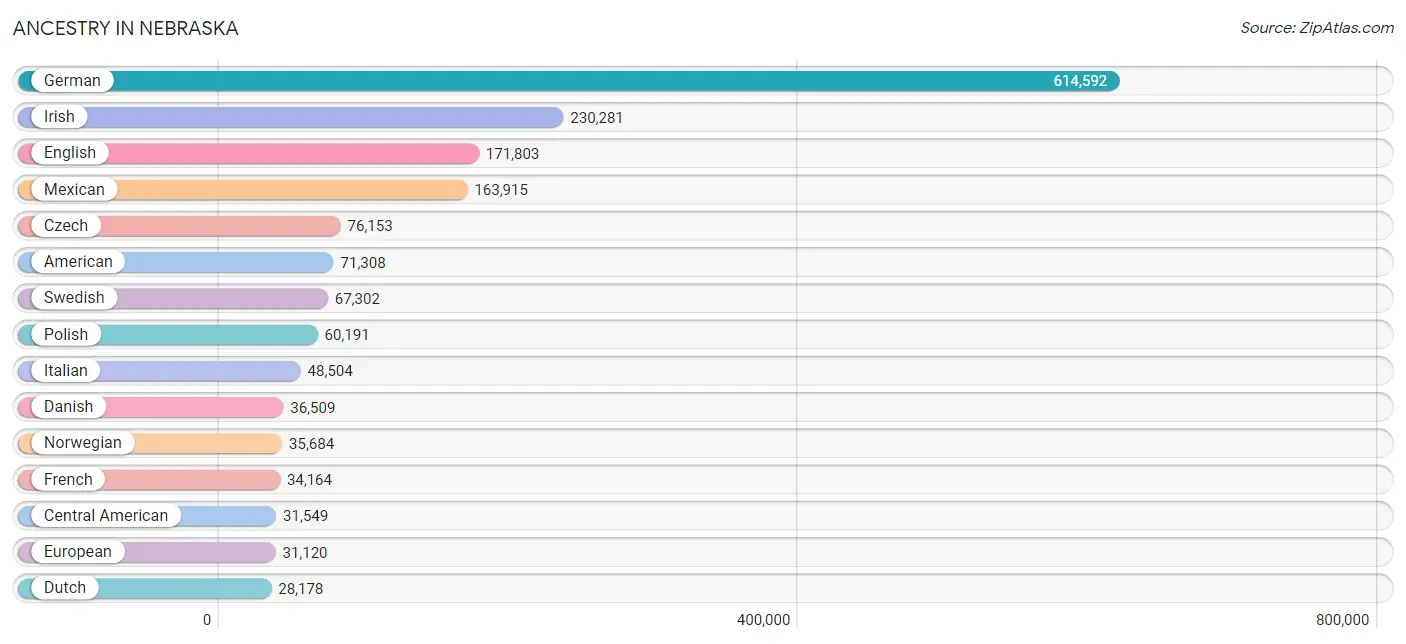
Ancestry in Nebraska
The most populous ancestries reported in Nebraska are German (614,592 | 31.4%), Irish (230,281 | 11.8%), English (171,803 | 8.8%), Mexican (163,915 | 8.4%), and Czech (76,153 | 3.9%), together accounting for 64.2% of all Nebraska residents.
| Ancestry | # Population | % Population |
| Afghan | 1,021 | 0.1% |
| African | 5,857 | 0.3% |
| Alaska Native | 75 | 0.0% |
| Alaskan Athabascan | 90 | 0.0% |
| Albanian | 135 | 0.0% |
| Aleut | 29 | 0.0% |
| Alsatian | 19 | 0.0% |
| American | 71,308 | 3.6% |
| Apache | 604 | 0.0% |
| Arab | 8,427 | 0.4% |
| Arapaho | 131 | 0.0% |
| Argentinean | 389 | 0.0% |
| Armenian | 236 | 0.0% |
| Assyrian / Chaldean / Syriac | 40 | 0.0% |
| Australian | 392 | 0.0% |
| Austrian | 3,342 | 0.2% |
| Bahamian | 392 | 0.0% |
| Bangladeshi | 343 | 0.0% |
| Barbadian | 15 | 0.0% |
| Basque | 86 | 0.0% |
| Belgian | 1,907 | 0.1% |
| Belizean | 32 | 0.0% |
| Bhutanese | 4,619 | 0.2% |
| Blackfeet | 560 | 0.0% |
| Bolivian | 195 | 0.0% |
| Brazilian | 354 | 0.0% |
| British | 8,502 | 0.4% |
| British West Indian | 238 | 0.0% |
| Bulgarian | 163 | 0.0% |
| Burmese | 4,954 | 0.3% |
| Cajun | 108 | 0.0% |
| Cambodian | 195 | 0.0% |
| Canadian | 2,060 | 0.1% |
| Cape Verdean | 12 | 0.0% |
| Carpatho Rusyn | 27 | 0.0% |
| Celtic | 327 | 0.0% |
| Central American | 31,549 | 1.6% |
| Central American Indian | 2,089 | 0.1% |
| Cherokee | 4,092 | 0.2% |
| Cheyenne | 71 | 0.0% |
| Chickasaw | 128 | 0.0% |
| Chilean | 1,163 | 0.1% |
| Chinese | 76 | 0.0% |
| Chippewa | 595 | 0.0% |
| Choctaw | 647 | 0.0% |
| Colombian | 1,914 | 0.1% |
| Comanche | 188 | 0.0% |
| Costa Rican | 323 | 0.0% |
| Cree | 79 | 0.0% |
| Creek | 160 | 0.0% |
| Croatian | 2,077 | 0.1% |
| Crow | 136 | 0.0% |
| Cuban | 5,946 | 0.3% |
| Czech | 76,153 | 3.9% |
| Czechoslovakian | 5,268 | 0.3% |
| Danish | 36,509 | 1.9% |
| Delaware | 20 | 0.0% |
| Dominican | 1,221 | 0.1% |
| Dutch | 28,178 | 1.4% |
| Dutch West Indian | 80 | 0.0% |
| Eastern European | 2,987 | 0.2% |
| Ecuadorian | 236 | 0.0% |
| Egyptian | 428 | 0.0% |
| English | 171,803 | 8.8% |
| Estonian | 65 | 0.0% |
| Ethiopian | 1,126 | 0.1% |
| European | 31,120 | 1.6% |
| Fijian | 16 | 0.0% |
| Filipino | 592 | 0.0% |
| Finnish | 1,944 | 0.1% |
| French | 34,164 | 1.7% |
| French American Indian | 117 | 0.0% |
| French Canadian | 5,379 | 0.3% |
| German | 614,592 | 31.4% |
| German Russian | 930 | 0.1% |
| Ghanaian | 229 | 0.0% |
| Greek | 3,979 | 0.2% |
| Guamanian / Chamorro | 1,208 | 0.1% |
| Guatemalan | 17,215 | 0.9% |
| Guyanese | 229 | 0.0% |
| Haitian | 438 | 0.0% |
| Hmong | 4 | 0.0% |
| Honduran | 4,483 | 0.2% |
| Hopi | 73 | 0.0% |
| Houma | 7 | 0.0% |
| Hungarian | 3,220 | 0.2% |
| Icelander | 389 | 0.0% |
| Indian (Asian) | 7,917 | 0.4% |
| Indonesian | 7,019 | 0.4% |
| Inupiat | 106 | 0.0% |
| Iranian | 980 | 0.1% |
| Iraqi | 2,782 | 0.1% |
| Irish | 230,281 | 11.8% |
| Iroquois | 111 | 0.0% |
| Israeli | 292 | 0.0% |
| Italian | 48,504 | 2.5% |
| Jamaican | 750 | 0.0% |
| Japanese | 837 | 0.0% |
| Jordanian | 185 | 0.0% |
| Kenyan | 463 | 0.0% |
| Kiowa | 29 | 0.0% |
| Korean | 9,508 | 0.5% |
| Laotian | 294 | 0.0% |
| Latvian | 584 | 0.0% |
| Lebanese | 1,892 | 0.1% |
| Liberian | 37 | 0.0% |
| Lithuanian | 2,251 | 0.1% |
| Lumbee | 29 | 0.0% |
| Luxembourger | 647 | 0.0% |
| Macedonian | 130 | 0.0% |
| Malaysian | 1,472 | 0.1% |
| Maltese | 71 | 0.0% |
| Mexican | 163,915 | 8.4% |
| Mexican American Indian | 2,324 | 0.1% |
| Mongolian | 300 | 0.0% |
| Moroccan | 171 | 0.0% |
| Native Hawaiian | 1,389 | 0.1% |
| Navajo | 875 | 0.0% |
| New Zealander | 36 | 0.0% |
| Nicaraguan | 576 | 0.0% |
| Nigerian | 1,012 | 0.1% |
| Northern European | 2,863 | 0.2% |
| Norwegian | 35,684 | 1.8% |
| Osage | 69 | 0.0% |
| Paiute | 16 | 0.0% |
| Pakistani | 2,397 | 0.1% |
| Palestinian | 153 | 0.0% |
| Panamanian | 331 | 0.0% |
| Paraguayan | 22 | 0.0% |
| Pennsylvania German | 922 | 0.1% |
| Peruvian | 818 | 0.0% |
| Pima | 6 | 0.0% |
| Polish | 60,191 | 3.1% |
| Portuguese | 1,563 | 0.1% |
| Potawatomi | 335 | 0.0% |
| Pueblo | 205 | 0.0% |
| Puerto Rican | 6,770 | 0.4% |
| Romanian | 833 | 0.0% |
| Russian | 10,053 | 0.5% |
| Salvadoran | 8,423 | 0.4% |
| Samoan | 408 | 0.0% |
| Scandinavian | 7,292 | 0.4% |
| Scotch-Irish | 13,392 | 0.7% |
| Scottish | 26,156 | 1.3% |
| Seminole | 79 | 0.0% |
| Serbian | 894 | 0.1% |
| Shoshone | 47 | 0.0% |
| Sierra Leonean | 79 | 0.0% |
| Sioux | 7,661 | 0.4% |
| Slavic | 773 | 0.0% |
| Slovak | 1,036 | 0.1% |
| Slovene | 383 | 0.0% |
| Somali | 2,730 | 0.1% |
| South African | 249 | 0.0% |
| South American | 6,264 | 0.3% |
| South American Indian | 114 | 0.0% |
| Spaniard | 2,966 | 0.2% |
| Spanish | 3,495 | 0.2% |
| Spanish American | 379 | 0.0% |
| Spanish American Indian | 19 | 0.0% |
| Sri Lankan | 9,210 | 0.5% |
| Subsaharan African | 21,142 | 1.1% |
| Sudanese | 5,632 | 0.3% |
| Swedish | 67,302 | 3.4% |
| Swiss | 6,313 | 0.3% |
| Syrian | 798 | 0.0% |
| Taiwanese | 70 | 0.0% |
| Thai | 8,809 | 0.4% |
| Tlingit-Haida | 34 | 0.0% |
| Tohono O'Odham | 1 | 0.0% |
| Tongan | 12 | 0.0% |
| Trinidadian and Tobagonian | 234 | 0.0% |
| Turkish | 525 | 0.0% |
| Ugandan | 19 | 0.0% |
| Ukrainian | 3,211 | 0.2% |
| Uruguayan | 146 | 0.0% |
| Ute | 13 | 0.0% |
| Venezuelan | 1,286 | 0.1% |
| Vietnamese | 191 | 0.0% |
| Welsh | 9,327 | 0.5% |
| West Indian | 214 | 0.0% |
| Yaqui | 47 | 0.0% |
| Yugoslavian | 697 | 0.0% |
| Yuman | 13 | 0.0% |
| Yup'ik | 24 | 0.0% |
| Zimbabwean | 72 | 0.0% | View All 186 Rows |
Immigrants in Nebraska
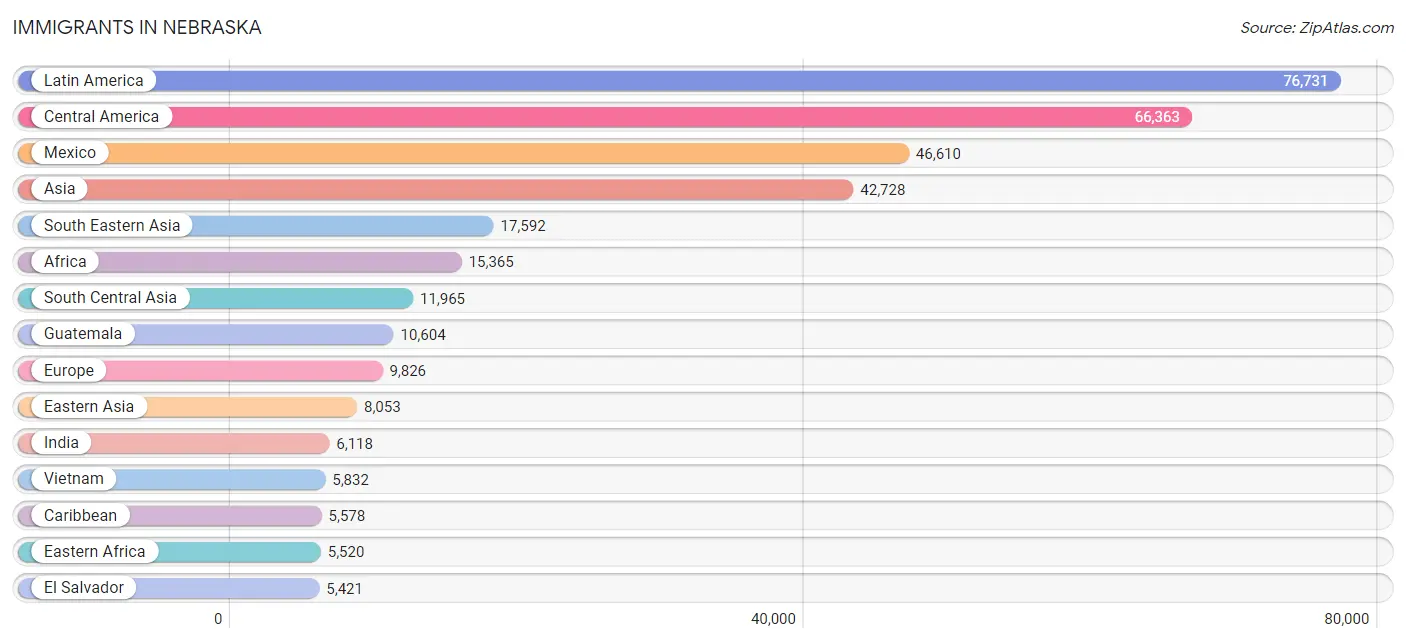
The most numerous immigrant groups reported in Nebraska came from Latin America (76,731 | 3.9%), Central America (66,363 | 3.4%), Mexico (46,610 | 2.4%), Asia (42,728 | 2.2%), and South Eastern Asia (17,592 | 0.9%), together accounting for 12.8% of all Nebraska residents.
| Immigration Origin | # Population | % Population |
| Afghanistan | 1,228 | 0.1% |
| Africa | 15,365 | 0.8% |
| Albania | 14 | 0.0% |
| Argentina | 152 | 0.0% |
| Asia | 42,728 | 2.2% |
| Australia | 166 | 0.0% |
| Austria | 47 | 0.0% |
| Bahamas | 404 | 0.0% |
| Bangladesh | 106 | 0.0% |
| Barbados | 21 | 0.0% |
| Belarus | 287 | 0.0% |
| Belgium | 82 | 0.0% |
| Belize | 120 | 0.0% |
| Bolivia | 65 | 0.0% |
| Bosnia and Herzegovina | 446 | 0.0% |
| Brazil | 827 | 0.0% |
| Bulgaria | 38 | 0.0% |
| Cambodia | 105 | 0.0% |
| Cameroon | 468 | 0.0% |
| Canada | 1,995 | 0.1% |
| Caribbean | 5,578 | 0.3% |
| Central America | 66,363 | 3.4% |
| Chile | 329 | 0.0% |
| China | 4,553 | 0.2% |
| Colombia | 1,614 | 0.1% |
| Congo | 75 | 0.0% |
| Costa Rica | 266 | 0.0% |
| Croatia | 45 | 0.0% |
| Cuba | 3,517 | 0.2% |
| Czechoslovakia | 92 | 0.0% |
| Denmark | 72 | 0.0% |
| Dominican Republic | 562 | 0.0% |
| Eastern Africa | 5,520 | 0.3% |
| Eastern Asia | 8,053 | 0.4% |
| Eastern Europe | 4,363 | 0.2% |
| Ecuador | 64 | 0.0% |
| Egypt | 392 | 0.0% |
| El Salvador | 5,421 | 0.3% |
| England | 578 | 0.0% |
| Eritrea | 12 | 0.0% |
| Ethiopia | 1,021 | 0.1% |
| Europe | 9,826 | 0.5% |
| Fiji | 1 | 0.0% |
| France | 292 | 0.0% |
| Germany | 2,029 | 0.1% |
| Ghana | 381 | 0.0% |
| Greece | 171 | 0.0% |
| Grenada | 133 | 0.0% |
| Guatemala | 10,604 | 0.5% |
| Guyana | 49 | 0.0% |
| Haiti | 284 | 0.0% |
| Honduras | 2,763 | 0.1% |
| Hong Kong | 154 | 0.0% |
| Hungary | 282 | 0.0% |
| India | 6,118 | 0.3% |
| Indonesia | 156 | 0.0% |
| Iran | 526 | 0.0% |
| Iraq | 3,173 | 0.2% |
| Ireland | 177 | 0.0% |
| Israel | 113 | 0.0% |
| Italy | 359 | 0.0% |
| Jamaica | 273 | 0.0% |
| Japan | 1,158 | 0.1% |
| Jordan | 375 | 0.0% |
| Kazakhstan | 86 | 0.0% |
| Kenya | 808 | 0.0% |
| Korea | 2,312 | 0.1% |
| Kuwait | 47 | 0.0% |
| Laos | 492 | 0.0% |
| Latin America | 76,731 | 3.9% |
| Latvia | 128 | 0.0% |
| Lebanon | 107 | 0.0% |
| Liberia | 64 | 0.0% |
| Lithuania | 113 | 0.0% |
| Malaysia | 700 | 0.0% |
| Mexico | 46,610 | 2.4% |
| Micronesia | 24 | 0.0% |
| Middle Africa | 766 | 0.0% |
| Moldova | 53 | 0.0% |
| Morocco | 95 | 0.0% |
| Nepal | 1,612 | 0.1% |
| Netherlands | 165 | 0.0% |
| Nicaragua | 346 | 0.0% |
| Nigeria | 671 | 0.0% |
| North Macedonia | 30 | 0.0% |
| Northern Africa | 3,102 | 0.2% |
| Northern Europe | 1,687 | 0.1% |
| Norway | 11 | 0.0% |
| Oceania | 290 | 0.0% |
| Pakistan | 411 | 0.0% |
| Panama | 156 | 0.0% |
| Peru | 517 | 0.0% |
| Philippines | 3,185 | 0.2% |
| Poland | 507 | 0.0% |
| Portugal | 15 | 0.0% |
| Romania | 224 | 0.0% |
| Russia | 650 | 0.0% |
| Saudi Arabia | 619 | 0.0% |
| Scotland | 123 | 0.0% |
| Serbia | 65 | 0.0% |
| Sierra Leone | 96 | 0.0% |
| Singapore | 4 | 0.0% |
| Somalia | 2,075 | 0.1% |
| South Africa | 636 | 0.0% |
| South America | 4,790 | 0.2% |
| South Central Asia | 11,965 | 0.6% |
| South Eastern Asia | 17,592 | 0.9% |
| Southern Europe | 950 | 0.1% |
| Spain | 405 | 0.0% |
| Sri Lanka | 87 | 0.0% |
| Sudan | 2,482 | 0.1% |
| Sweden | 93 | 0.0% |
| Switzerland | 84 | 0.0% |
| Syria | 266 | 0.0% |
| Taiwan | 591 | 0.0% |
| Thailand | 3,167 | 0.2% |
| Trinidad and Tobago | 106 | 0.0% |
| Turkey | 279 | 0.0% |
| Uganda | 88 | 0.0% |
| Ukraine | 1,220 | 0.1% |
| Uruguay | 25 | 0.0% |
| Uzbekistan | 85 | 0.0% |
| Venezuela | 1,086 | 0.1% |
| Vietnam | 5,832 | 0.3% |
| West Indies | 7 | 0.0% |
| Western Africa | 3,911 | 0.2% |
| Western Asia | 5,104 | 0.3% |
| Western Europe | 2,727 | 0.1% |
| Zaire | 98 | 0.0% |
| Zimbabwe | 151 | 0.0% | View All 130 Rows |
Sex and Age in Nebraska
Sex and Age in Nebraska
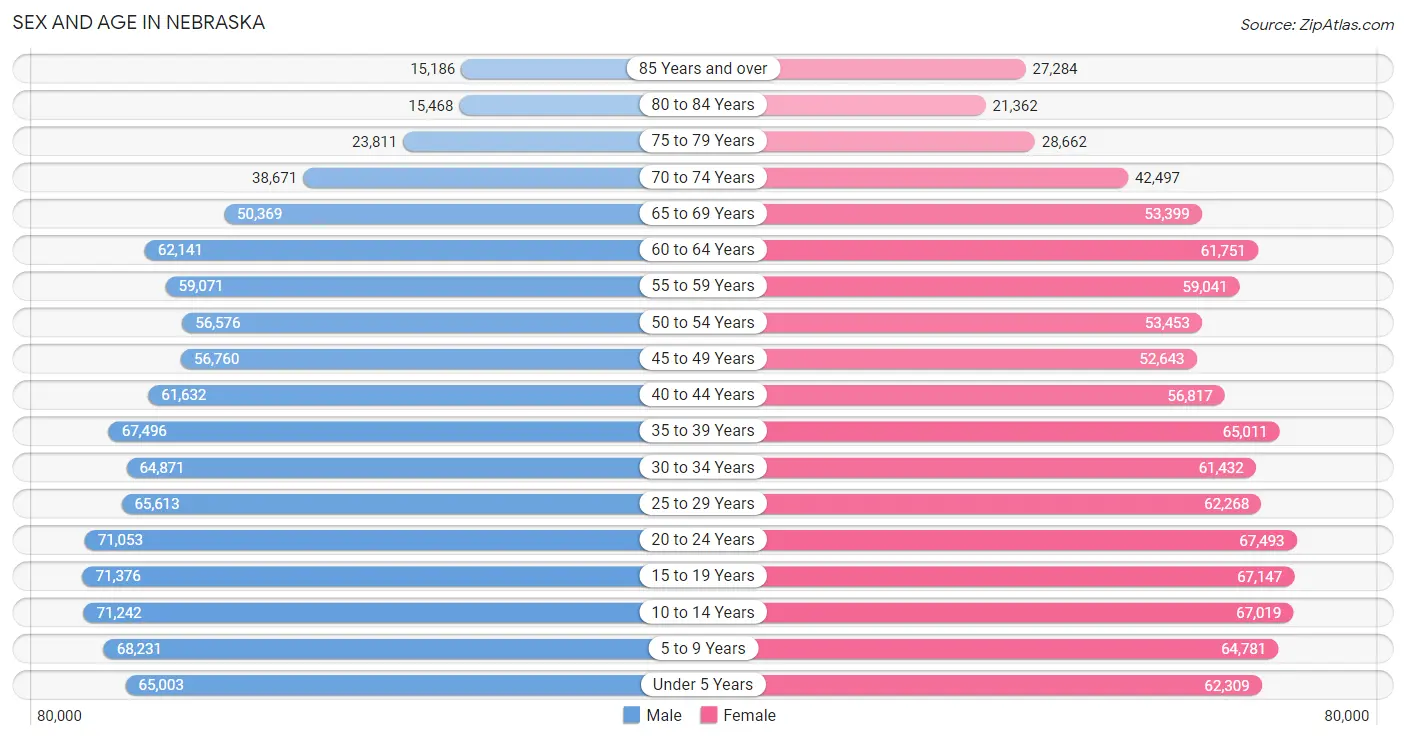
The most populous age groups in Nebraska are 15 to 19 Years (71,376 | 7.2%) for men and 20 to 24 Years (67,493 | 6.9%) for women.
| Age Bracket | Male | Female |
| Under 5 Years | 65,003 (6.6%) | 62,309 (6.4%) |
| 5 to 9 Years | 68,231 (6.9%) | 64,781 (6.7%) |
| 10 to 14 Years | 71,242 (7.2%) | 67,019 (6.9%) |
| 15 to 19 Years | 71,376 (7.2%) | 67,147 (6.9%) |
| 20 to 24 Years | 71,053 (7.2%) | 67,493 (6.9%) |
| 25 to 29 Years | 65,613 (6.7%) | 62,268 (6.4%) |
| 30 to 34 Years | 64,871 (6.6%) | 61,432 (6.3%) |
| 35 to 39 Years | 67,496 (6.9%) | 65,011 (6.7%) |
| 40 to 44 Years | 61,632 (6.3%) | 56,817 (5.8%) |
| 45 to 49 Years | 56,760 (5.8%) | 52,643 (5.4%) |
| 50 to 54 Years | 56,576 (5.8%) | 53,453 (5.5%) |
| 55 to 59 Years | 59,071 (6.0%) | 59,041 (6.1%) |
| 60 to 64 Years | 62,141 (6.3%) | 61,751 (6.3%) |
| 65 to 69 Years | 50,369 (5.1%) | 53,399 (5.5%) |
| 70 to 74 Years | 38,671 (3.9%) | 42,497 (4.4%) |
| 75 to 79 Years | 23,811 (2.4%) | 28,662 (2.9%) |
| 80 to 84 Years | 15,468 (1.6%) | 21,362 (2.2%) |
| 85 Years and over | 15,186 (1.5%) | 27,284 (2.8%) |
| Total | 984,570 (100.0%) | 974,369 (100.0%) |
Families and Households in Nebraska
Median Family Size in Nebraska
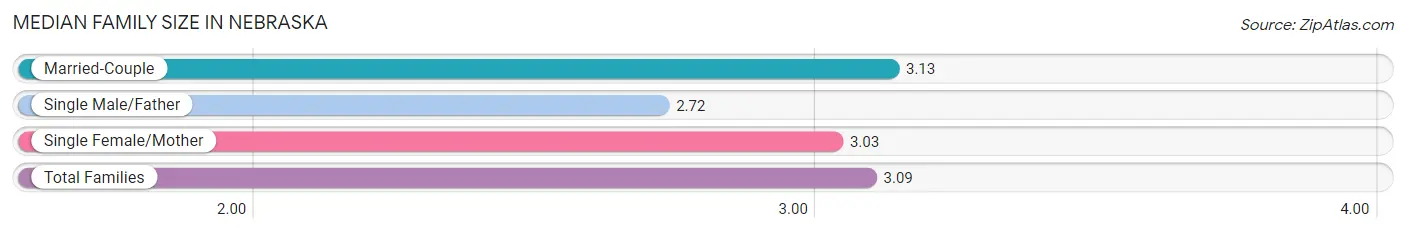
The median family size in Nebraska is 3.09 persons per family, with married-couple families (382,954 | 78.1%) accounting for the largest median family size of 3.13 persons per family. On the other hand, single male/father families (35,404 | 7.2%) represent the smallest median family size with 2.72 persons per family.
| Family Type | # Families | Family Size |
| Married-Couple | 382,954 (78.1%) | 3.13 |
| Single Male/Father | 35,404 (7.2%) | 2.72 |
| Single Female/Mother | 72,173 (14.7%) | 3.03 |
| Total Families | 490,531 (100.0%) | 3.09 |
Median Household Size in Nebraska
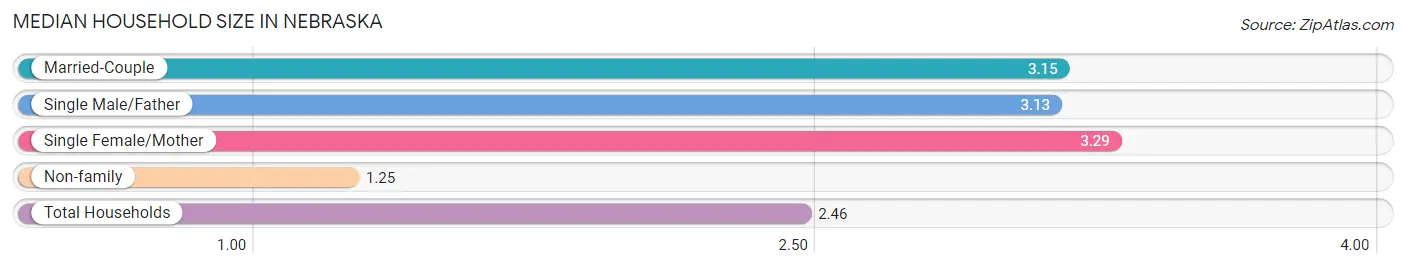
The median household size in Nebraska is 2.46 persons per household, with single female/mother households (72,173 | 9.3%) accounting for the largest median household size of 3.29 persons per household. non-family households (285,848 | 36.8%) represent the smallest median household size with 1.25 persons per household.
| Household Type | # Households | Household Size |
| Married-Couple | 382,954 (49.3%) | 3.15 |
| Single Male/Father | 35,404 (4.6%) | 3.13 |
| Single Female/Mother | 72,173 (9.3%) | 3.29 |
| Non-family | 285,848 (36.8%) | 1.25 |
| Total Households | 776,379 (100.0%) | 2.46 |
Household Size by Marriage Status in Nebraska
Out of a total of 776,379 households in Nebraska, 490,531 (63.2%) are family households, while 285,848 (36.8%) are nonfamily households. The most numerous type of family households are 2-person households, comprising 228,459, and the most common type of nonfamily households are 1-person households, comprising 233,106.
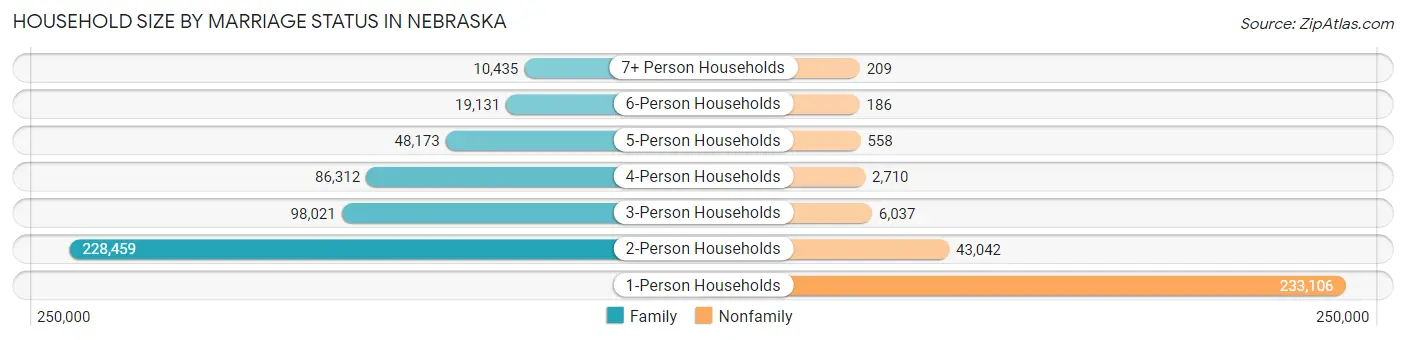
| Household Size | Family Households | Nonfamily Households |
| 1-Person Households | - | 233,106 (30.0%) |
| 2-Person Households | 228,459 (29.4%) | 43,042 (5.5%) |
| 3-Person Households | 98,021 (12.6%) | 6,037 (0.8%) |
| 4-Person Households | 86,312 (11.1%) | 2,710 (0.4%) |
| 5-Person Households | 48,173 (6.2%) | 558 (0.1%) |
| 6-Person Households | 19,131 (2.5%) | 186 (0.0%) |
| 7+ Person Households | 10,435 (1.3%) | 209 (0.0%) |
| Total | 490,531 (63.2%) | 285,848 (36.8%) |
Female Fertility in Nebraska
Fertility by Age in Nebraska
Average fertility rate in Nebraska is 61.0 births per 1,000 women. Women in the age bracket of 20 to 34 years have the highest fertility rate with 105.0 births per 1,000 women. Women in the age bracket of 20 to 34 years acount for 74.1% of all women with births.
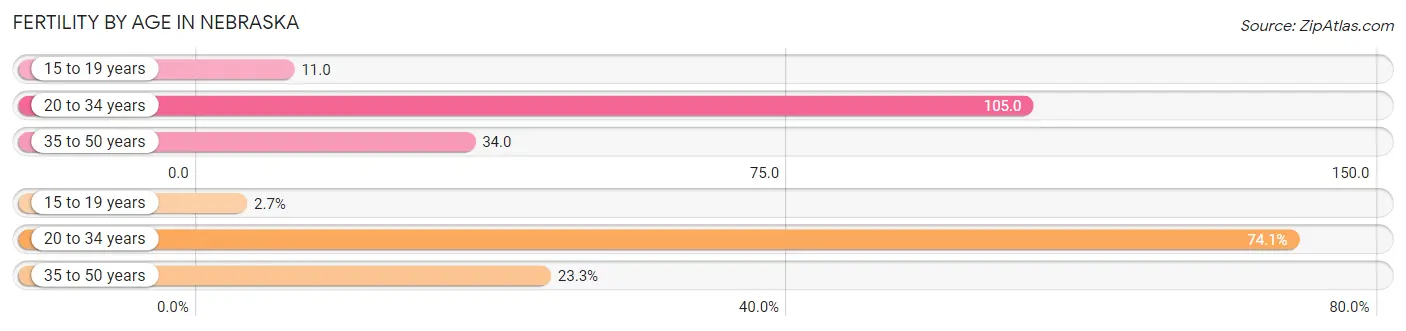
| Age Bracket | Women with Births | Births / 1,000 Women |
| 15 to 19 years | 716 (2.6%) | 11.0 |
| 20 to 34 years | 20,003 (74.1%) | 105.0 |
| 35 to 50 years | 6,285 (23.3%) | 34.0 |
| Total | 27,004 (100.0%) | 61.0 |
Fertility by Age by Marriage Status in Nebraska
69.7% of women with births (27,004) in Nebraska are married. The highest percentage of unmarried women with births falls into 15 to 19 years age bracket with 90.4% of them unmarried at the time of birth, while the lowest percentage of unmarried women with births belong to 35 to 50 years age bracket with 22.8% of them unmarried.
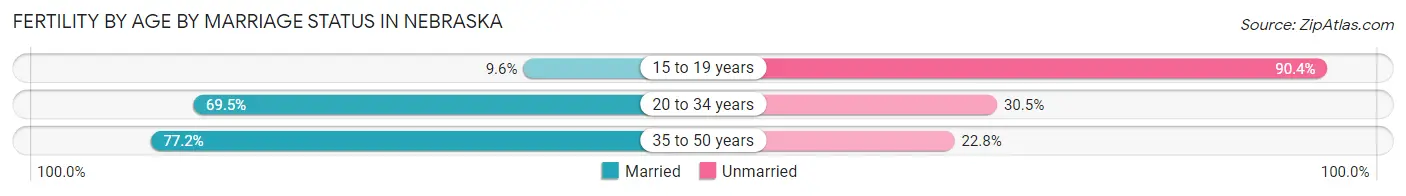
| Age Bracket | Married | Unmarried |
| 15 to 19 years | 69 (9.6%) | 647 (90.4%) |
| 20 to 34 years | 13,902 (69.5%) | 6,101 (30.5%) |
| 35 to 50 years | 4,852 (77.2%) | 1,433 (22.8%) |
| Total | 18,822 (69.7%) | 8,182 (30.3%) |
Fertility by Education in Nebraska
Average fertility rate in Nebraska is 61.0 births per 1,000 women. Women with the education attainment of graduate degree have the highest fertility rate of 79.0 births per 1,000 women, while women with the education attainment of less than high school have the lowest fertility at 37.0 births per 1,000 women. Women with the education attainment of college or associate's degree represent 32.4% of all women with births.
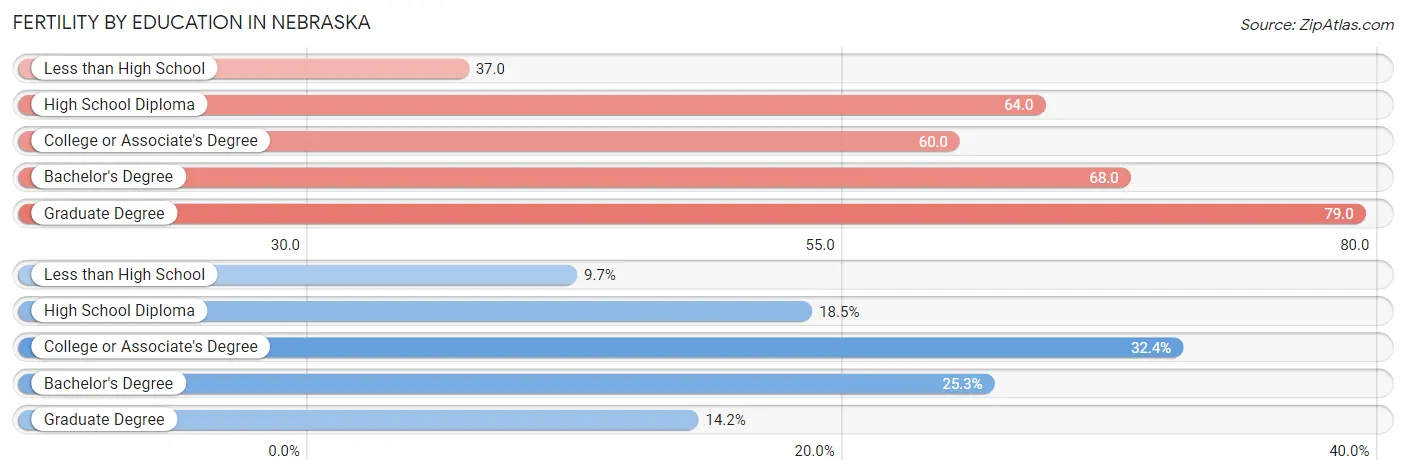
| Educational Attainment | Women with Births | Births / 1,000 Women |
| Less than High School | 2,609 (9.7%) | 37.0 |
| High School Diploma | 4,988 (18.5%) | 64.0 |
| College or Associate's Degree | 8,739 (32.4%) | 60.0 |
| Bachelor's Degree | 6,830 (25.3%) | 68.0 |
| Graduate Degree | 3,838 (14.2%) | 79.0 |
| Total | 27,004 (100.0%) | 61.0 |
Fertility by Education by Marriage Status in Nebraska
30.3% of women with births in Nebraska are unmarried. Women with the educational attainment of graduate degree are most likely to be married with 91.0% of them married at childbirth, while women with the educational attainment of high school diploma are least likely to be married with 54.5% of them unmarried at childbirth.
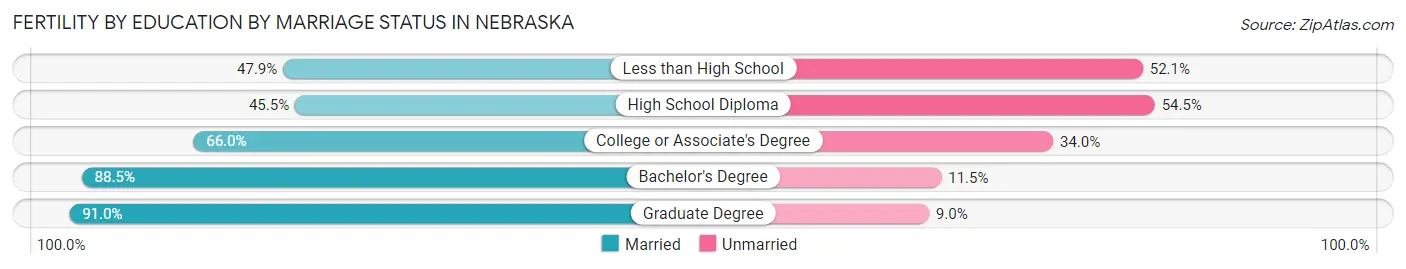
| Educational Attainment | Married | Unmarried |
| Less than High School | 1,250 (47.9%) | 1,359 (52.1%) |
| High School Diploma | 2,270 (45.5%) | 2,718 (54.5%) |
| College or Associate's Degree | 5,768 (66.0%) | 2,971 (34.0%) |
| Bachelor's Degree | 6,045 (88.5%) | 785 (11.5%) |
| Graduate Degree | 3,493 (91.0%) | 345 (9.0%) |
| Total | 18,822 (69.7%) | 8,182 (30.3%) |
Employment Characteristics in Nebraska
Employment by Class of Employer in Nebraska
Among the 1,004,637 employed individuals in Nebraska, private company employees (650,394 | 64.7%), not-for-profit organizations (95,693 | 9.5%), and local government employees (76,067 | 7.6%) make up the most common classes of employment.
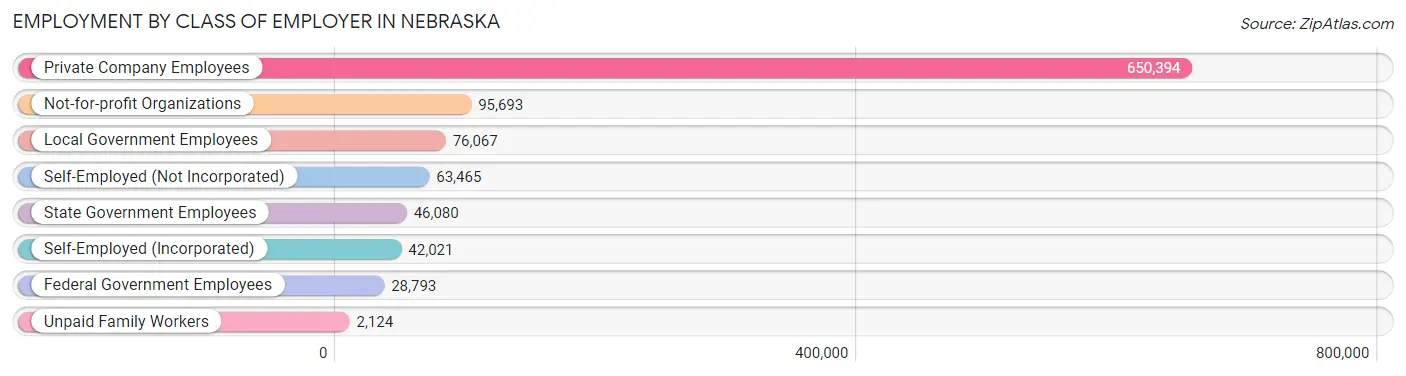
| Employer Class | # Employees | % Employees |
| Private Company Employees | 650,394 | 64.7% |
| Self-Employed (Incorporated) | 42,021 | 4.2% |
| Self-Employed (Not Incorporated) | 63,465 | 6.3% |
| Not-for-profit Organizations | 95,693 | 9.5% |
| Local Government Employees | 76,067 | 7.6% |
| State Government Employees | 46,080 | 4.6% |
| Federal Government Employees | 28,793 | 2.9% |
| Unpaid Family Workers | 2,124 | 0.2% |
| Total | 1,004,637 | 100.0% |
Employment Status by Age in Nebraska
According to the labor force statistics for Nebraska, out of the total population over 16 years of age (1,532,351), 68.8% or 1,054,257 individuals are in the labor force, with 3.1% or 32,682 of them unemployed. The age group with the highest labor force participation rate is 35 to 44 years, with 87.6% or 219,837 individuals in the labor force. Within the labor force, the 16 to 19 years age range has the highest percentage of unemployed individuals, with 11.0% or 6,480 of them being unemployed.
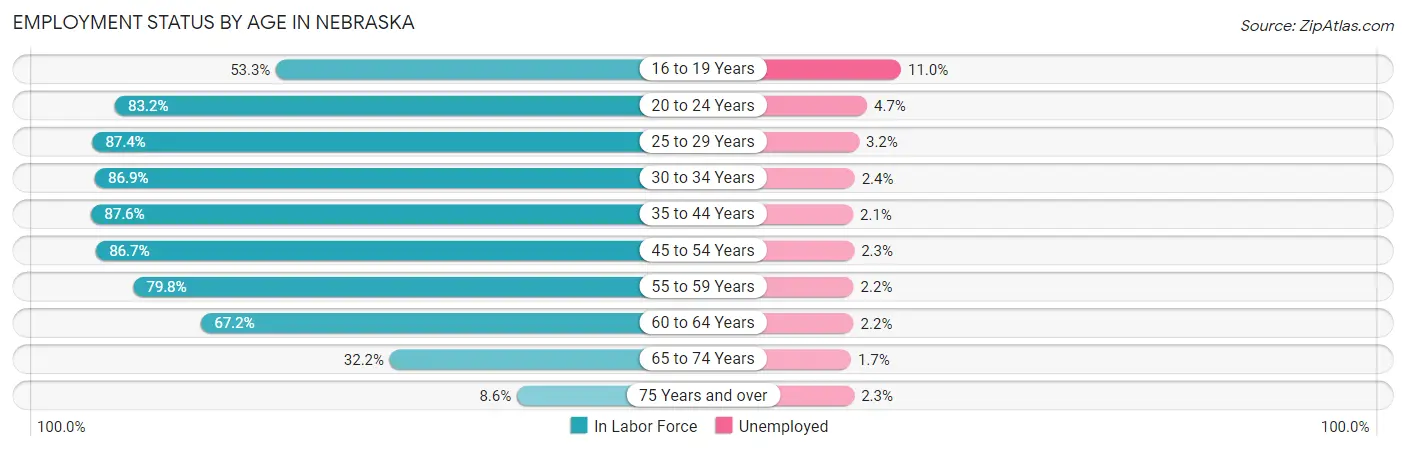
| Age Bracket | In Labor Force | Unemployed |
| 16 to 19 Years | 58,907 (53.3%) | 6,480 (11.0%) |
| 20 to 24 Years | 115,270 (83.2%) | 5,418 (4.7%) |
| 25 to 29 Years | 111,768 (87.4%) | 3,577 (3.2%) |
| 30 to 34 Years | 109,757 (86.9%) | 2,634 (2.4%) |
| 35 to 44 Years | 219,837 (87.6%) | 4,617 (2.1%) |
| 45 to 54 Years | 190,248 (86.7%) | 4,376 (2.3%) |
| 55 to 59 Years | 94,253 (79.8%) | 2,074 (2.2%) |
| 60 to 64 Years | 83,255 (67.2%) | 1,832 (2.2%) |
| 65 to 74 Years | 59,549 (32.2%) | 1,012 (1.7%) |
| 75 Years and over | 11,332 (8.6%) | 261 (2.3%) |
| Total | 1,054,257 (68.8%) | 32,682 (3.1%) |
Employment Status by Educational Attainment in Nebraska
According to labor force statistics for Nebraska, 83.7% of individuals (809,024) out of the total population between 25 and 64 years of age (966,576) are in the labor force, with 2.4% or 19,417 of them being unemployed. The group with the highest labor force participation rate are those with the educational attainment of bachelor's degree or higher, with 90.1% or 310,886 individuals in the labor force. Within the labor force, individuals with less than high school education have the highest percentage of unemployment, with 5.0% or 2,655 of them being unemployed.
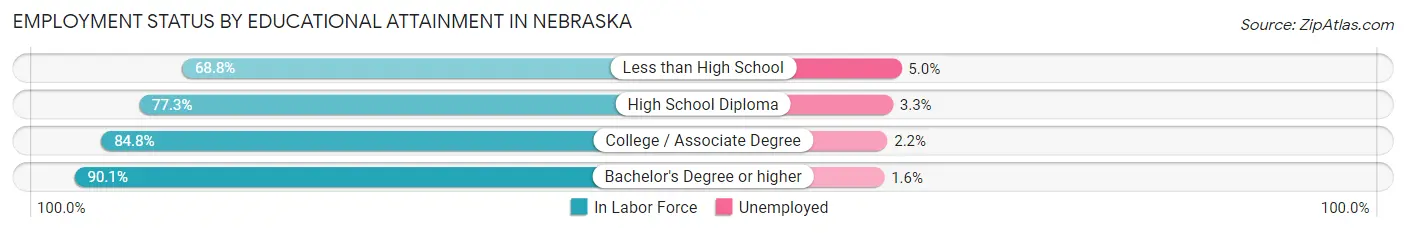
| Educational Attainment | In Labor Force | Unemployed |
| Less than High School | 53,107 (68.8%) | 3,860 (5.0%) |
| High School Diploma | 169,094 (77.3%) | 7,219 (3.3%) |
| College / Associate Degree | 276,099 (84.8%) | 7,163 (2.2%) |
| Bachelor's Degree or higher | 310,886 (90.1%) | 5,521 (1.6%) |
| Total | 809,024 (83.7%) | 23,198 (2.4%) |
Employment Occupations by Sex in Nebraska
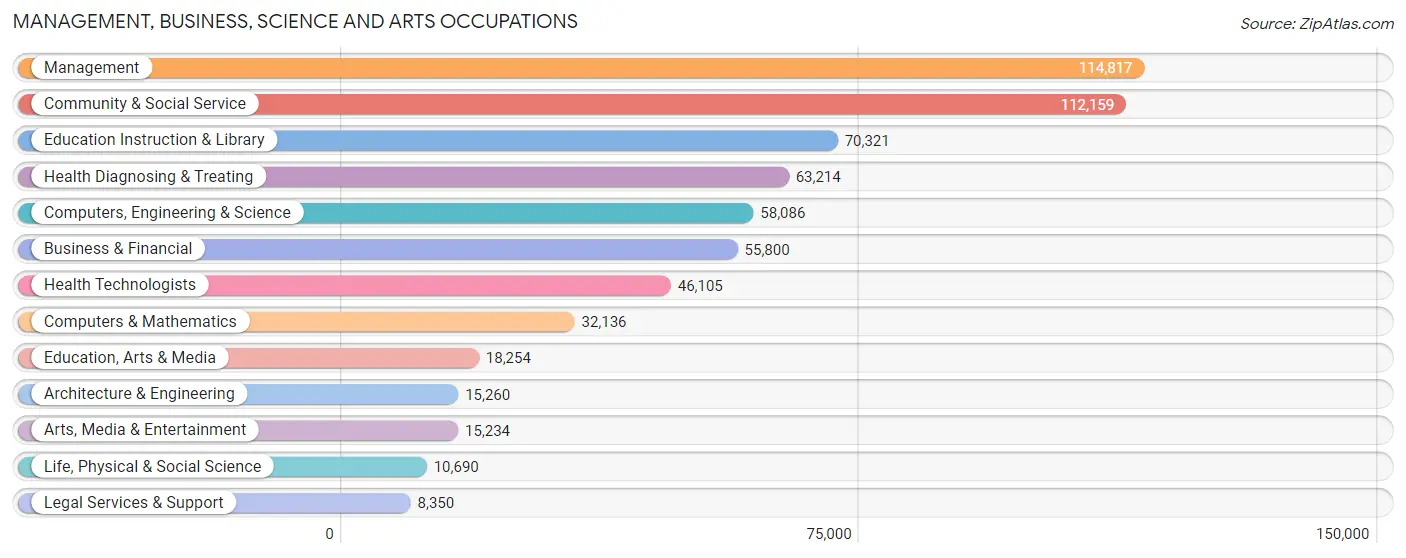
Management, Business, Science and Arts Occupations
The most common Management, Business, Science and Arts occupations in Nebraska are Management (114,817 | 11.3%), Community & Social Service (112,159 | 11.0%), Education Instruction & Library (70,321 | 6.9%), Health Diagnosing & Treating (63,214 | 6.2%), and Computers, Engineering & Science (58,086 | 5.7%).
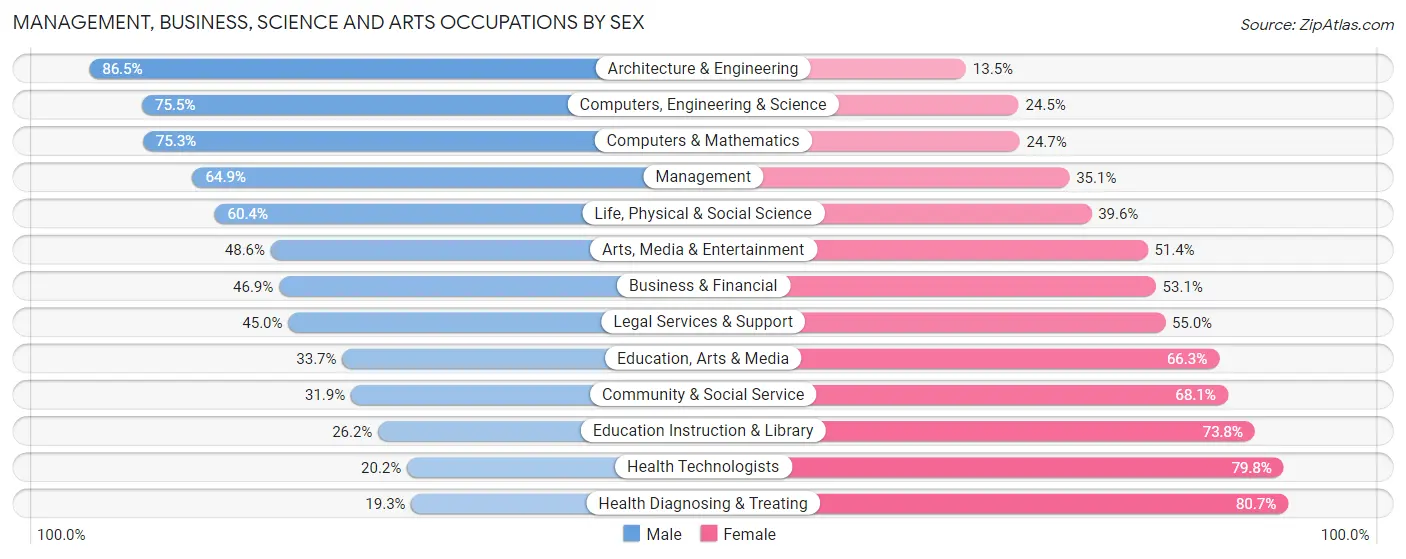
Management, Business, Science and Arts Occupations by Sex
Within the Management, Business, Science and Arts occupations in Nebraska, the most male-oriented occupations are Architecture & Engineering (86.5%), Computers, Engineering & Science (75.5%), and Computers & Mathematics (75.3%), while the most female-oriented occupations are Health Diagnosing & Treating (80.7%), Health Technologists (79.8%), and Education Instruction & Library (73.8%).
| Occupation | Male | Female |
| Management | 74,560 (64.9%) | 40,257 (35.1%) |
| Business & Financial | 26,173 (46.9%) | 29,627 (53.1%) |
| Computers, Engineering & Science | 43,851 (75.5%) | 14,235 (24.5%) |
| Computers & Mathematics | 24,201 (75.3%) | 7,935 (24.7%) |
| Architecture & Engineering | 13,198 (86.5%) | 2,062 (13.5%) |
| Life, Physical & Social Science | 6,452 (60.4%) | 4,238 (39.6%) |
| Community & Social Service | 35,774 (31.9%) | 76,385 (68.1%) |
| Education, Arts & Media | 6,154 (33.7%) | 12,100 (66.3%) |
| Legal Services & Support | 3,756 (45.0%) | 4,594 (55.0%) |
| Education Instruction & Library | 18,455 (26.2%) | 51,866 (73.8%) |
| Arts, Media & Entertainment | 7,409 (48.6%) | 7,825 (51.4%) |
| Health Diagnosing & Treating | 12,209 (19.3%) | 51,005 (80.7%) |
| Health Technologists | 9,319 (20.2%) | 36,786 (79.8%) |
| Total (Category) | 192,567 (47.7%) | 211,509 (52.3%) |
| Total (Overall) | 539,150 (53.1%) | 476,506 (46.9%) |
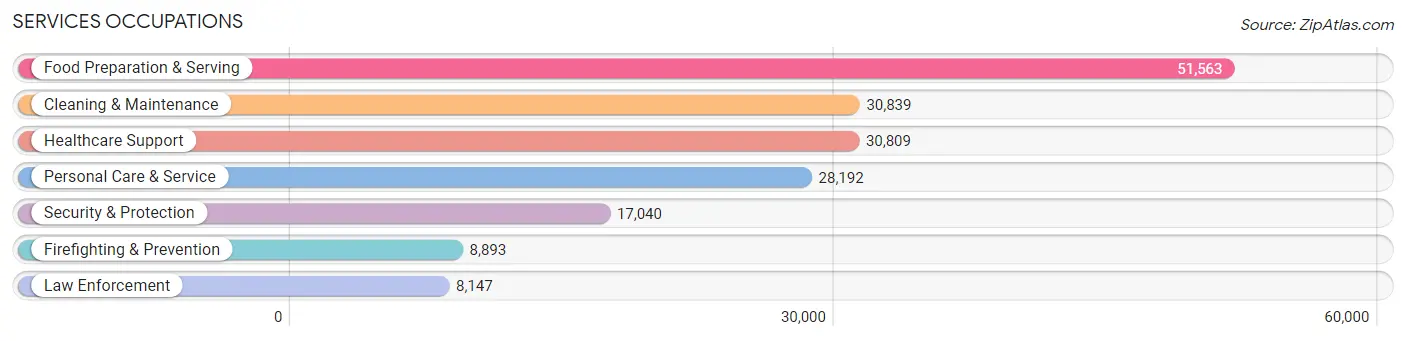
Services Occupations
The most common Services occupations in Nebraska are Food Preparation & Serving (51,563 | 5.1%), Cleaning & Maintenance (30,839 | 3.0%), Healthcare Support (30,809 | 3.0%), Personal Care & Service (28,192 | 2.8%), and Security & Protection (17,040 | 1.7%).
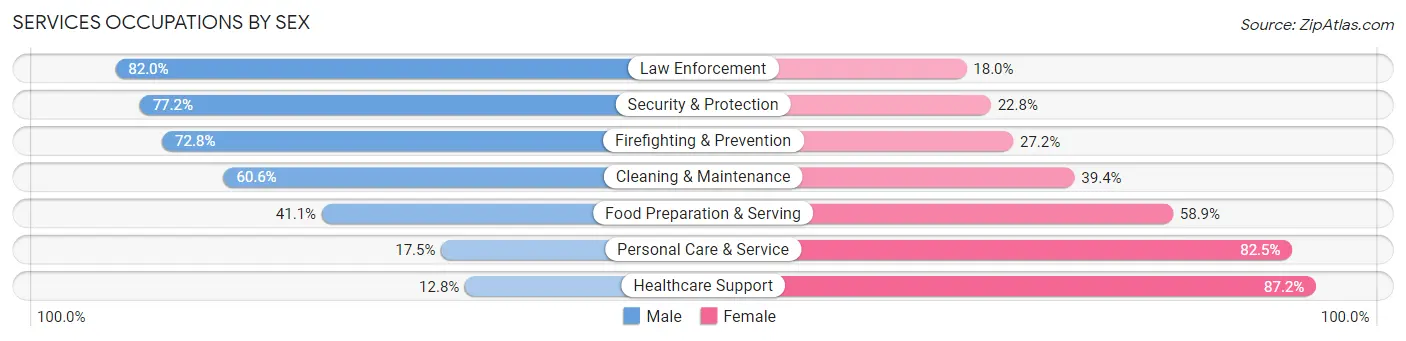
Services Occupations by Sex
Within the Services occupations in Nebraska, the most male-oriented occupations are Law Enforcement (82.0%), Security & Protection (77.2%), and Firefighting & Prevention (72.8%), while the most female-oriented occupations are Healthcare Support (87.2%), Personal Care & Service (82.5%), and Food Preparation & Serving (58.9%).
| Occupation | Male | Female |
| Healthcare Support | 3,932 (12.8%) | 26,877 (87.2%) |
| Security & Protection | 13,153 (77.2%) | 3,887 (22.8%) |
| Firefighting & Prevention | 6,471 (72.8%) | 2,422 (27.2%) |
| Law Enforcement | 6,682 (82.0%) | 1,465 (18.0%) |
| Food Preparation & Serving | 21,209 (41.1%) | 30,354 (58.9%) |
| Cleaning & Maintenance | 18,696 (60.6%) | 12,143 (39.4%) |
| Personal Care & Service | 4,929 (17.5%) | 23,263 (82.5%) |
| Total (Category) | 61,919 (39.1%) | 96,524 (60.9%) |
| Total (Overall) | 539,150 (53.1%) | 476,506 (46.9%) |
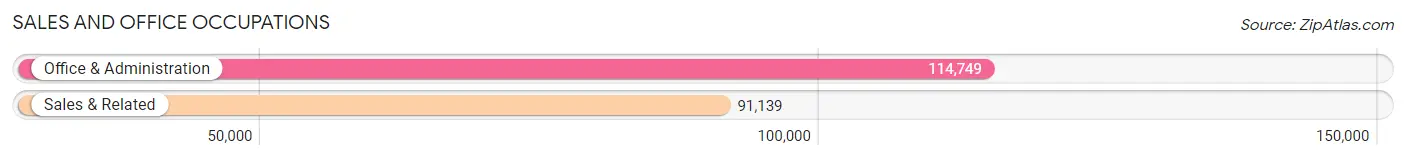
Sales and Office Occupations
The most common Sales and Office occupations in Nebraska are Office & Administration (114,749 | 11.3%), and Sales & Related (91,139 | 9.0%).
Sales and Office Occupations by Sex
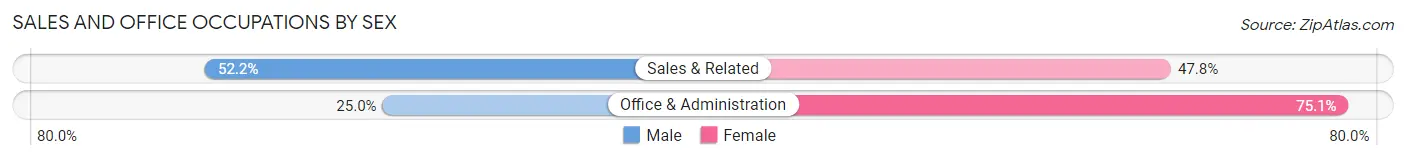
| Occupation | Male | Female |
| Sales & Related | 47,603 (52.2%) | 43,536 (47.8%) |
| Office & Administration | 28,629 (24.9%) | 86,120 (75.0%) |
| Total (Category) | 76,232 (37.0%) | 129,656 (63.0%) |
| Total (Overall) | 539,150 (53.1%) | 476,506 (46.9%) |
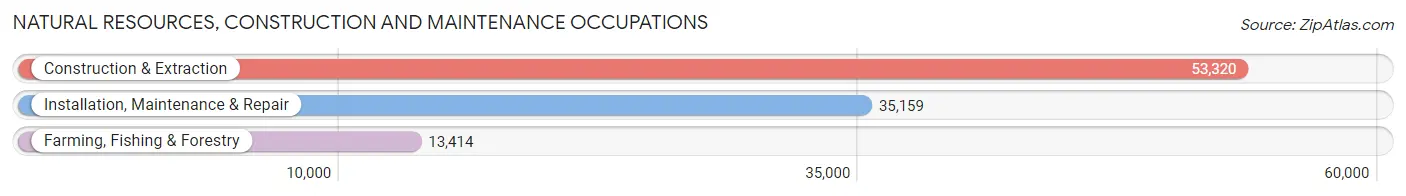
Natural Resources, Construction and Maintenance Occupations
The most common Natural Resources, Construction and Maintenance occupations in Nebraska are Construction & Extraction (53,320 | 5.2%), Installation, Maintenance & Repair (35,159 | 3.5%), and Farming, Fishing & Forestry (13,414 | 1.3%).
Natural Resources, Construction and Maintenance Occupations by Sex
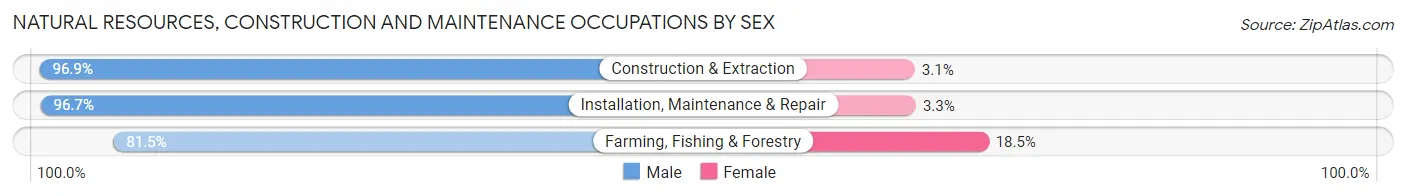
| Occupation | Male | Female |
| Farming, Fishing & Forestry | 10,937 (81.5%) | 2,477 (18.5%) |
| Construction & Extraction | 51,658 (96.9%) | 1,662 (3.1%) |
| Installation, Maintenance & Repair | 33,986 (96.7%) | 1,173 (3.3%) |
| Total (Category) | 96,581 (94.8%) | 5,312 (5.2%) |
| Total (Overall) | 539,150 (53.1%) | 476,506 (46.9%) |
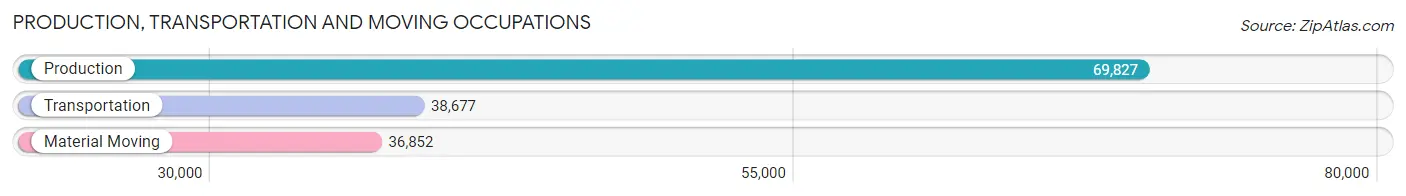
Production, Transportation and Moving Occupations
The most common Production, Transportation and Moving occupations in Nebraska are Production (69,827 | 6.9%), Transportation (38,677 | 3.8%), and Material Moving (36,852 | 3.6%).
Production, Transportation and Moving Occupations by Sex
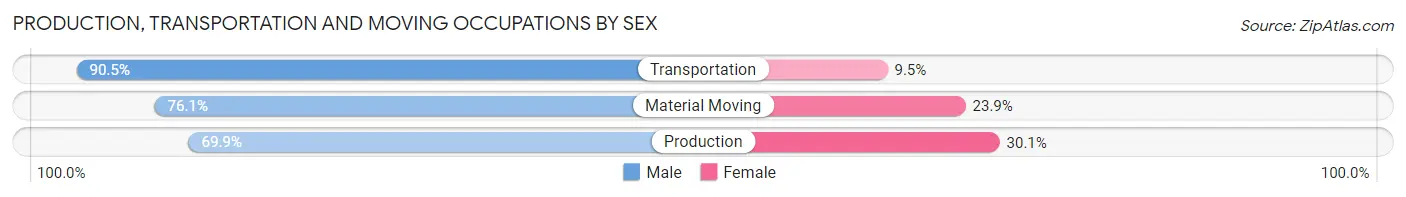
| Occupation | Male | Female |
| Production | 48,809 (69.9%) | 21,018 (30.1%) |
| Transportation | 34,988 (90.5%) | 3,689 (9.5%) |
| Material Moving | 28,054 (76.1%) | 8,798 (23.9%) |
| Total (Category) | 111,851 (76.9%) | 33,505 (23.1%) |
| Total (Overall) | 539,150 (53.1%) | 476,506 (46.9%) |
Employment Industries by Sex in Nebraska
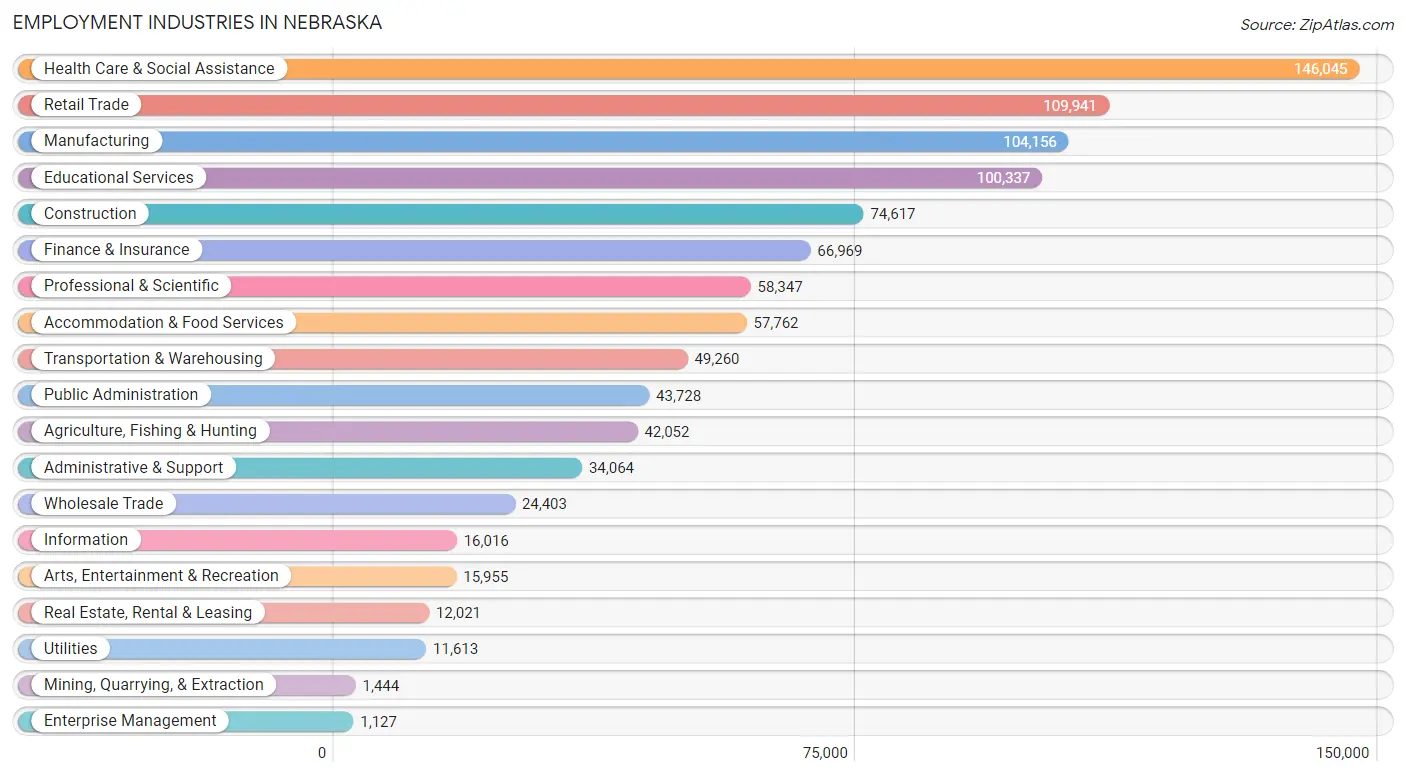
Employment Industries in Nebraska
The major employment industries in Nebraska include Health Care & Social Assistance (146,045 | 14.4%), Retail Trade (109,941 | 10.8%), Manufacturing (104,156 | 10.3%), Educational Services (100,337 | 9.9%), and Construction (74,617 | 7.3%).
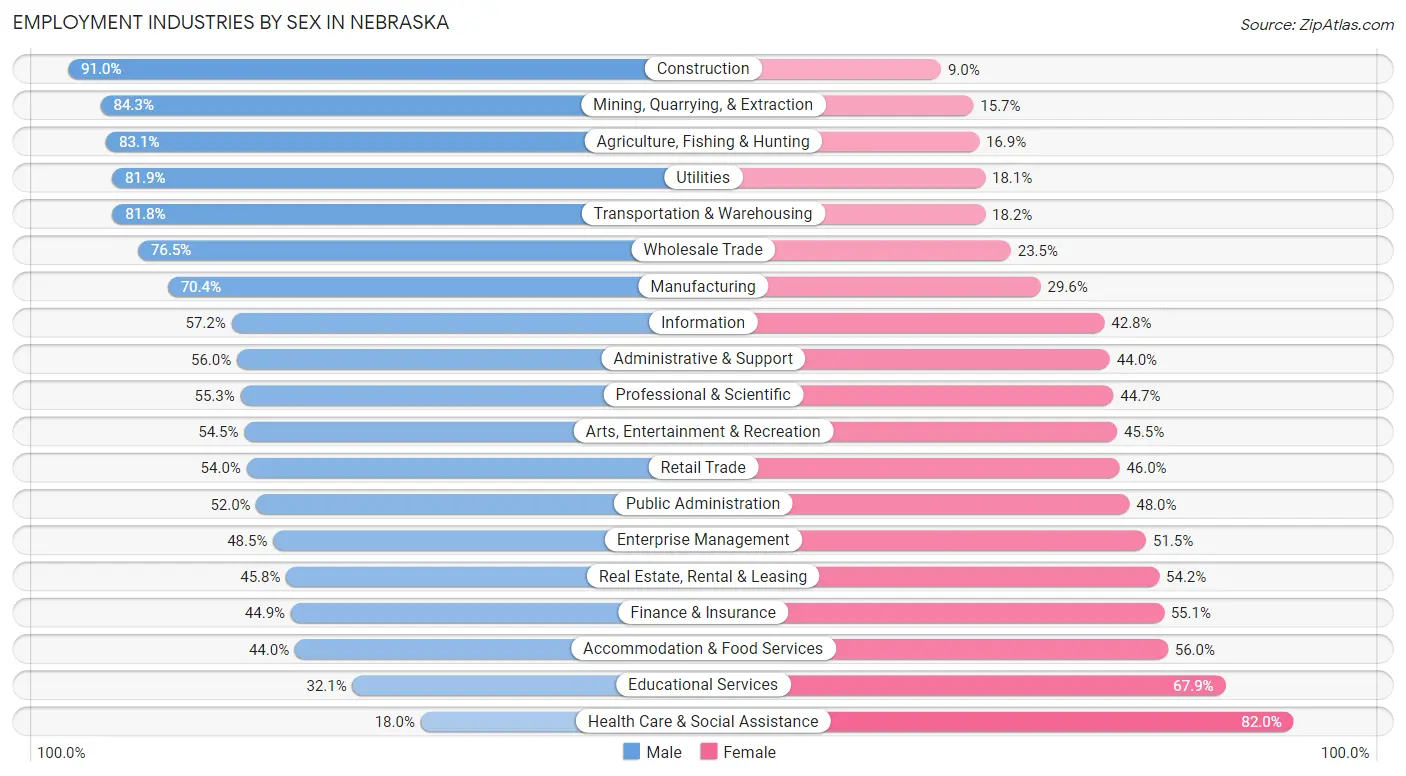
Employment Industries by Sex in Nebraska
The Nebraska industries that see more men than women are Construction (91.0%), Mining, Quarrying, & Extraction (84.3%), and Agriculture, Fishing & Hunting (83.1%), whereas the industries that tend to have a higher number of women are Health Care & Social Assistance (82.0%), Educational Services (67.9%), and Accommodation & Food Services (56.0%).
| Industry | Male | Female |
| Agriculture, Fishing & Hunting | 34,953 (83.1%) | 7,099 (16.9%) |
| Mining, Quarrying, & Extraction | 1,217 (84.3%) | 227 (15.7%) |
| Construction | 67,897 (91.0%) | 6,720 (9.0%) |
| Manufacturing | 73,293 (70.4%) | 30,863 (29.6%) |
| Wholesale Trade | 18,679 (76.5%) | 5,724 (23.5%) |
| Retail Trade | 59,412 (54.0%) | 50,529 (46.0%) |
| Transportation & Warehousing | 40,315 (81.8%) | 8,945 (18.2%) |
| Utilities | 9,508 (81.9%) | 2,105 (18.1%) |
| Information | 9,155 (57.2%) | 6,861 (42.8%) |
| Finance & Insurance | 30,059 (44.9%) | 36,910 (55.1%) |
| Real Estate, Rental & Leasing | 5,511 (45.8%) | 6,510 (54.2%) |
| Professional & Scientific | 32,268 (55.3%) | 26,079 (44.7%) |
| Enterprise Management | 547 (48.5%) | 580 (51.5%) |
| Administrative & Support | 19,081 (56.0%) | 14,983 (44.0%) |
| Educational Services | 32,226 (32.1%) | 68,111 (67.9%) |
| Health Care & Social Assistance | 26,300 (18.0%) | 119,745 (82.0%) |
| Arts, Entertainment & Recreation | 8,701 (54.5%) | 7,254 (45.5%) |
| Accommodation & Food Services | 25,435 (44.0%) | 32,327 (56.0%) |
| Public Administration | 22,742 (52.0%) | 20,986 (48.0%) |
| Total | 539,150 (53.1%) | 476,506 (46.9%) |
Education in Nebraska
School Enrollment in Nebraska
The most common levels of schooling among the 514,103 students in Nebraska are high school (110,588 | 21.5%), middle school (106,942 | 20.8%), and elementary school (102,831 | 20.0%).
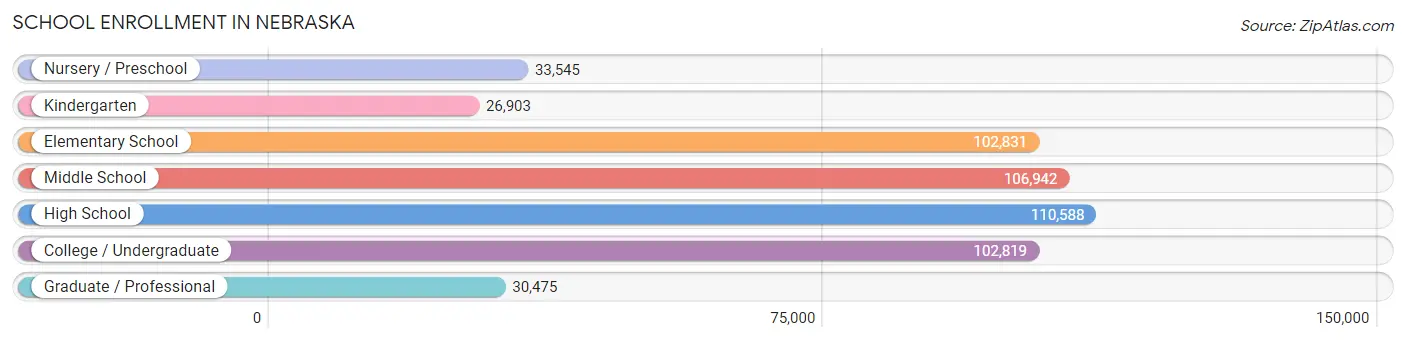
| School Level | # Students | % Students |
| Nursery / Preschool | 33,545 | 6.5% |
| Kindergarten | 26,903 | 5.2% |
| Elementary School | 102,831 | 20.0% |
| Middle School | 106,942 | 20.8% |
| High School | 110,588 | 21.5% |
| College / Undergraduate | 102,819 | 20.0% |
| Graduate / Professional | 30,475 | 5.9% |
| Total | 514,103 | 100.0% |
School Enrollment by Age by Funding Source in Nebraska
Out of a total of 514,103 students who are enrolled in schools in Nebraska, 89,454 (17.4%) attend a private institution, while the remaining 424,649 (82.6%) are enrolled in public schools. The age group of 3 to 4 year olds has the highest likelihood of being enrolled in private schools, with 9,010 (39.3% in the age bracket) enrolled. Conversely, the age group of 15 to 17 year olds has the lowest likelihood of being enrolled in a private school, with 70,309 (88.5% in the age bracket) attending a public institution.
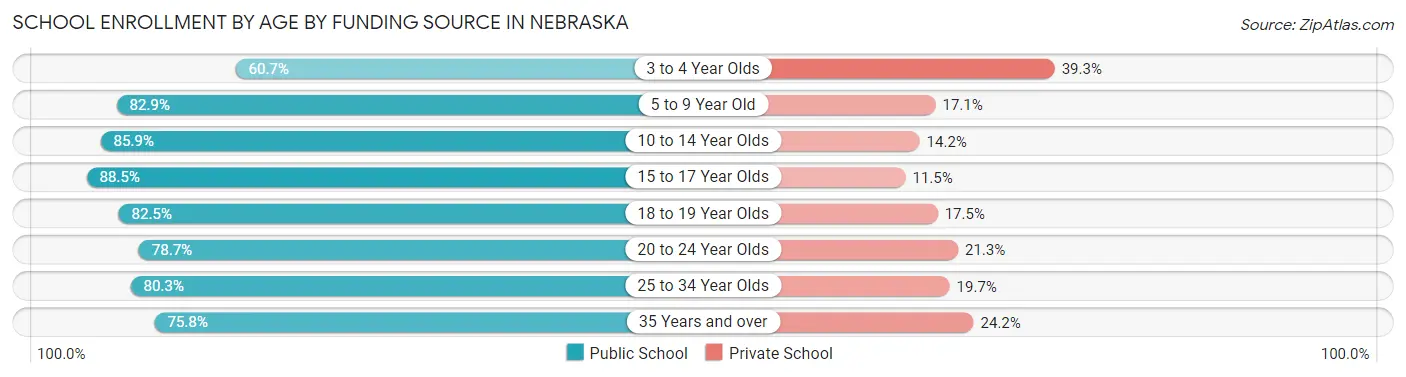
| Age Bracket | Public School | Private School |
| 3 to 4 Year Olds | 13,912 (60.7%) | 9,010 (39.3%) |
| 5 to 9 Year Old | 103,260 (82.9%) | 21,336 (17.1%) |
| 10 to 14 Year Olds | 116,396 (85.9%) | 19,180 (14.1%) |
| 15 to 17 Year Olds | 70,309 (88.5%) | 9,162 (11.5%) |
| 18 to 19 Year Olds | 36,455 (82.5%) | 7,745 (17.5%) |
| 20 to 24 Year Olds | 45,105 (78.7%) | 12,206 (21.3%) |
| 25 to 34 Year Olds | 22,023 (80.3%) | 5,415 (19.7%) |
| 35 Years and over | 17,123 (75.8%) | 5,466 (24.2%) |
| Total | 424,649 (82.6%) | 89,454 (17.4%) |
Educational Attainment by Field of Study in Nebraska
Business (98,945 | 21.1%), education (77,553 | 16.5%), science & technology (51,816 | 11.0%), bio, nature & agricultural (40,655 | 8.6%), and arts & humanities (35,762 | 7.6%) are the most common fields of study among 469,889 individuals in Nebraska who have obtained a bachelor's degree or higher.
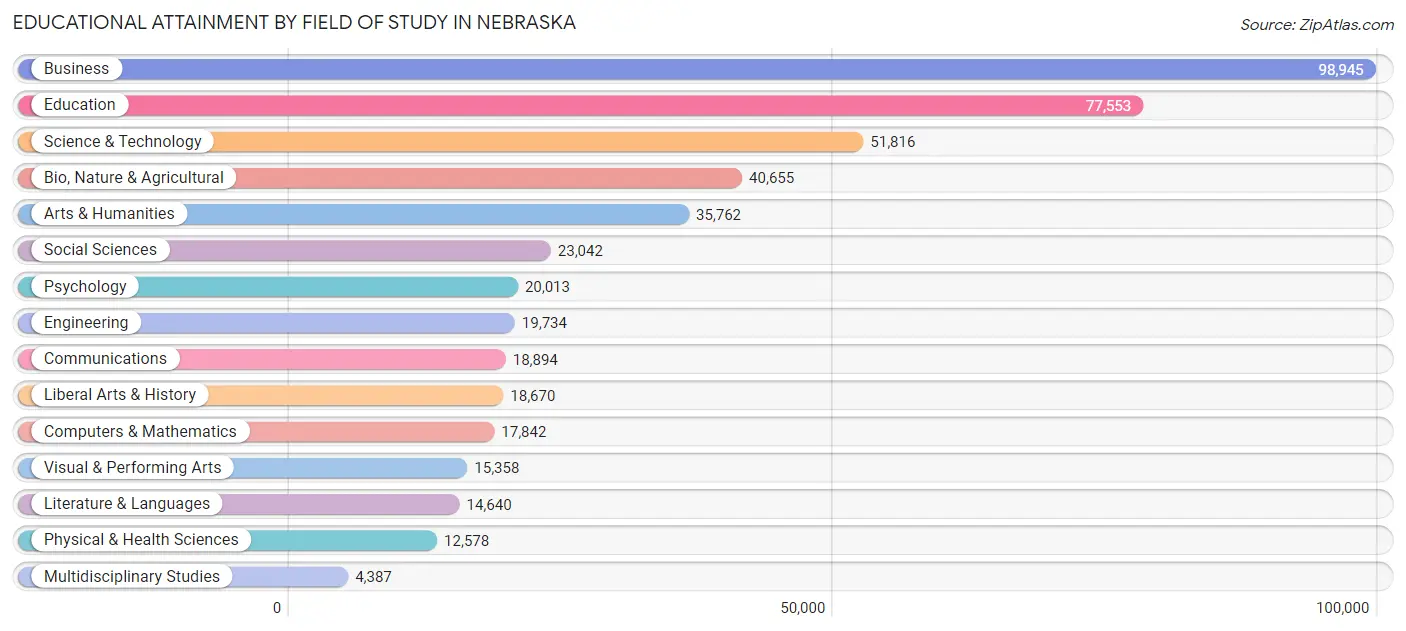
| Field of Study | # Graduates | % Graduates |
| Computers & Mathematics | 17,842 | 3.8% |
| Bio, Nature & Agricultural | 40,655 | 8.6% |
| Physical & Health Sciences | 12,578 | 2.7% |
| Psychology | 20,013 | 4.3% |
| Social Sciences | 23,042 | 4.9% |
| Engineering | 19,734 | 4.2% |
| Multidisciplinary Studies | 4,387 | 0.9% |
| Science & Technology | 51,816 | 11.0% |
| Business | 98,945 | 21.1% |
| Education | 77,553 | 16.5% |
| Literature & Languages | 14,640 | 3.1% |
| Liberal Arts & History | 18,670 | 4.0% |
| Visual & Performing Arts | 15,358 | 3.3% |
| Communications | 18,894 | 4.0% |
| Arts & Humanities | 35,762 | 7.6% |
| Total | 469,889 | 100.0% |
Transportation & Commute in Nebraska
Vehicle Availability by Sex in Nebraska
The most prevalent vehicle ownership categories in Nebraska are males with 2 vehicles (222,903, accounting for 41.9%) and females with 2 vehicles (189,344, making up 48.2%).
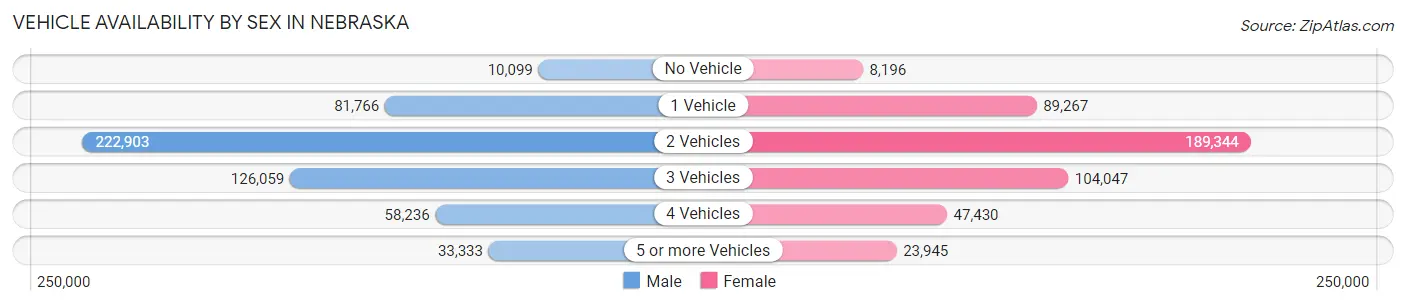
| Vehicles Available | Male | Female |
| No Vehicle | 10,099 (1.9%) | 8,196 (1.8%) |
| 1 Vehicle | 81,766 (15.4%) | 89,267 (19.3%) |
| 2 Vehicles | 222,903 (41.9%) | 189,344 (41.0%) |
| 3 Vehicles | 126,059 (23.7%) | 104,047 (22.5%) |
| 4 Vehicles | 58,236 (10.9%) | 47,430 (10.3%) |
| 5 or more Vehicles | 33,333 (6.3%) | 23,945 (5.2%) |
| Total | 532,396 (100.0%) | 462,229 (100.0%) |
Commute Time in Nebraska
The most frequently occuring commute durations in Nebraska are 10 to 14 minutes (165,427 commuters, 18.1%), 15 to 19 minutes (163,075 commuters, 17.8%), and 5 to 9 minutes (154,332 commuters, 16.9%).
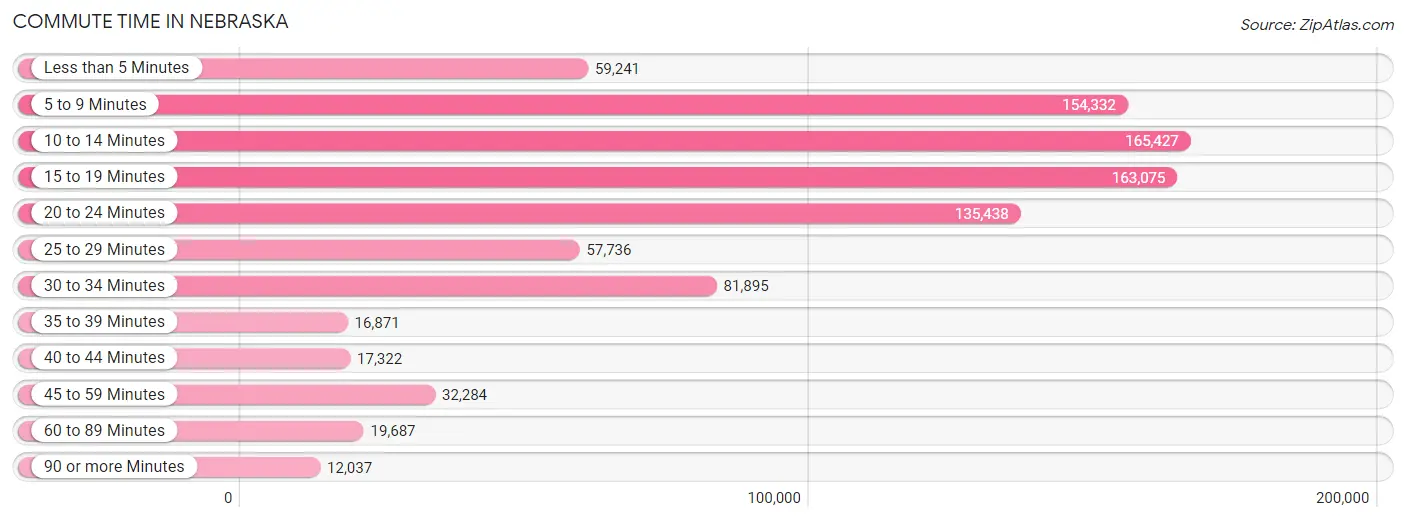
| Commute Time | # Commuters | % Commuters |
| Less than 5 Minutes | 59,241 | 6.5% |
| 5 to 9 Minutes | 154,332 | 16.9% |
| 10 to 14 Minutes | 165,427 | 18.1% |
| 15 to 19 Minutes | 163,075 | 17.8% |
| 20 to 24 Minutes | 135,438 | 14.8% |
| 25 to 29 Minutes | 57,736 | 6.3% |
| 30 to 34 Minutes | 81,895 | 8.9% |
| 35 to 39 Minutes | 16,871 | 1.8% |
| 40 to 44 Minutes | 17,322 | 1.9% |
| 45 to 59 Minutes | 32,284 | 3.5% |
| 60 to 89 Minutes | 19,687 | 2.1% |
| 90 or more Minutes | 12,037 | 1.3% |
Commute Time by Sex in Nebraska
The most common commute times in Nebraska are 15 to 19 minutes (87,984 commuters, 17.8%) for males and 10 to 14 minutes (78,266 commuters, 18.5%) for females.
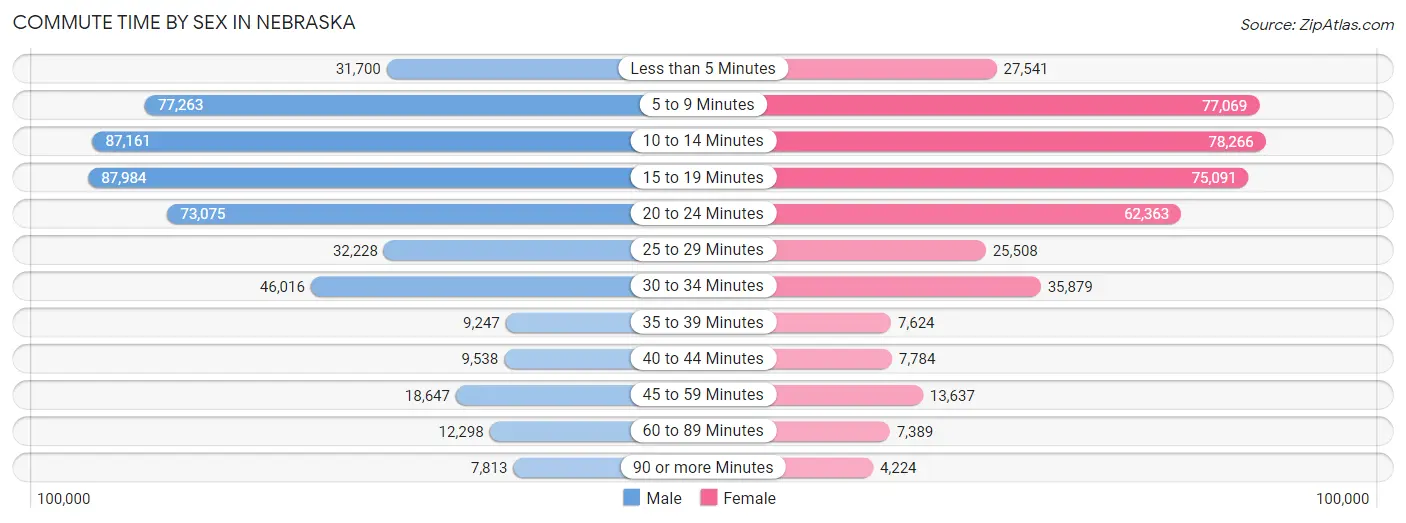
| Commute Time | Male | Female |
| Less than 5 Minutes | 31,700 (6.4%) | 27,541 (6.5%) |
| 5 to 9 Minutes | 77,263 (15.7%) | 77,069 (18.2%) |
| 10 to 14 Minutes | 87,161 (17.7%) | 78,266 (18.5%) |
| 15 to 19 Minutes | 87,984 (17.8%) | 75,091 (17.8%) |
| 20 to 24 Minutes | 73,075 (14.8%) | 62,363 (14.8%) |
| 25 to 29 Minutes | 32,228 (6.5%) | 25,508 (6.0%) |
| 30 to 34 Minutes | 46,016 (9.3%) | 35,879 (8.5%) |
| 35 to 39 Minutes | 9,247 (1.9%) | 7,624 (1.8%) |
| 40 to 44 Minutes | 9,538 (1.9%) | 7,784 (1.8%) |
| 45 to 59 Minutes | 18,647 (3.8%) | 13,637 (3.2%) |
| 60 to 89 Minutes | 12,298 (2.5%) | 7,389 (1.8%) |
| 90 or more Minutes | 7,813 (1.6%) | 4,224 (1.0%) |
Time of Departure to Work by Sex in Nebraska
The most frequent times of departure to work in Nebraska are 7:00 AM to 7:29 AM (75,753, 15.4%) for males and 7:30 AM to 7:59 AM (80,766, 19.1%) for females.
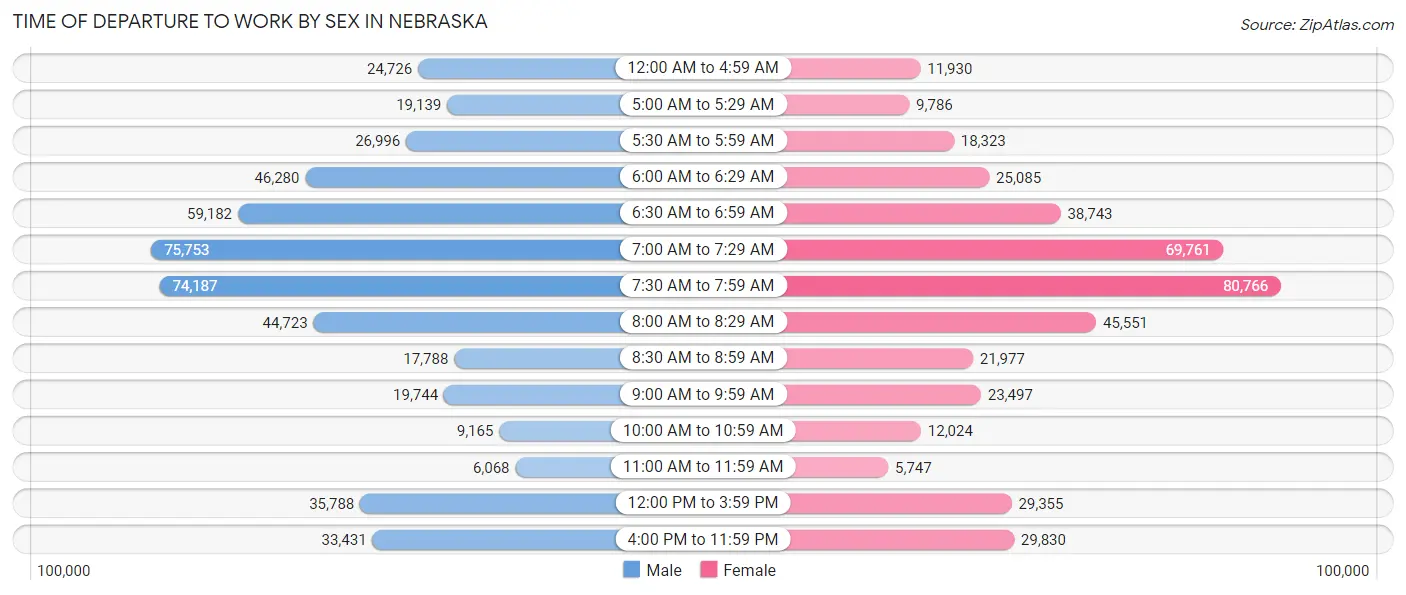
| Time of Departure | Male | Female |
| 12:00 AM to 4:59 AM | 24,726 (5.0%) | 11,930 (2.8%) |
| 5:00 AM to 5:29 AM | 19,139 (3.9%) | 9,786 (2.3%) |
| 5:30 AM to 5:59 AM | 26,996 (5.5%) | 18,323 (4.3%) |
| 6:00 AM to 6:29 AM | 46,280 (9.4%) | 25,085 (5.9%) |
| 6:30 AM to 6:59 AM | 59,182 (12.0%) | 38,743 (9.2%) |
| 7:00 AM to 7:29 AM | 75,753 (15.4%) | 69,761 (16.5%) |
| 7:30 AM to 7:59 AM | 74,187 (15.0%) | 80,766 (19.1%) |
| 8:00 AM to 8:29 AM | 44,723 (9.1%) | 45,551 (10.8%) |
| 8:30 AM to 8:59 AM | 17,788 (3.6%) | 21,977 (5.2%) |
| 9:00 AM to 9:59 AM | 19,744 (4.0%) | 23,497 (5.6%) |
| 10:00 AM to 10:59 AM | 9,165 (1.9%) | 12,024 (2.9%) |
| 11:00 AM to 11:59 AM | 6,068 (1.2%) | 5,747 (1.4%) |
| 12:00 PM to 3:59 PM | 35,788 (7.3%) | 29,355 (7.0%) |
| 4:00 PM to 11:59 PM | 33,431 (6.8%) | 29,830 (7.1%) |
| Total | 492,970 (100.0%) | 422,375 (100.0%) |
Housing Occupancy in Nebraska
Occupancy by Ownership in Nebraska
Of the total 776,379 dwellings in Nebraska, owner-occupied units account for 516,651 (66.5%), while renter-occupied units make up 259,728 (33.5%).
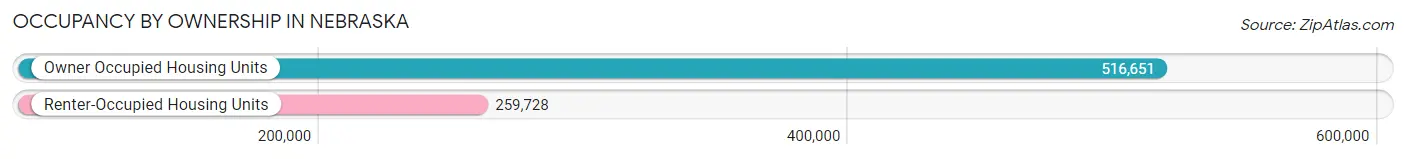
| Occupancy | # Housing Units | % Housing Units |
| Owner Occupied Housing Units | 516,651 | 66.5% |
| Renter-Occupied Housing Units | 259,728 | 33.5% |
| Total Occupied Housing Units | 776,379 | 100.0% |
Occupancy by Household Size in Nebraska
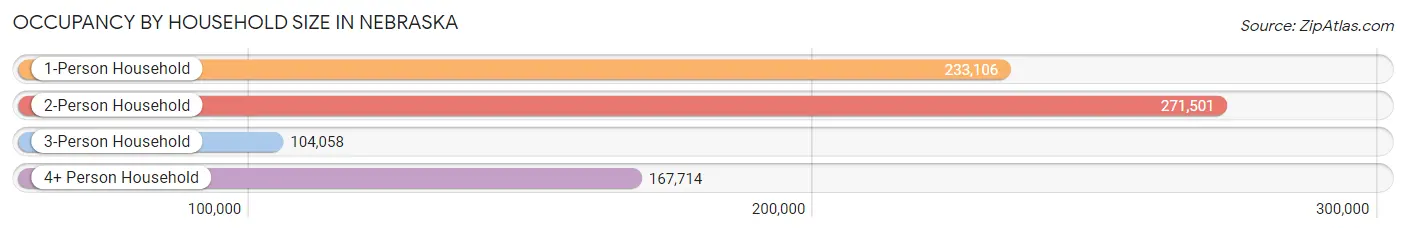
| Household Size | # Housing Units | % Housing Units |
| 1-Person Household | 233,106 | 30.0% |
| 2-Person Household | 271,501 | 35.0% |
| 3-Person Household | 104,058 | 13.4% |
| 4+ Person Household | 167,714 | 21.6% |
| Total Housing Units | 776,379 | 100.0% |
Occupancy by Ownership by Household Size in Nebraska
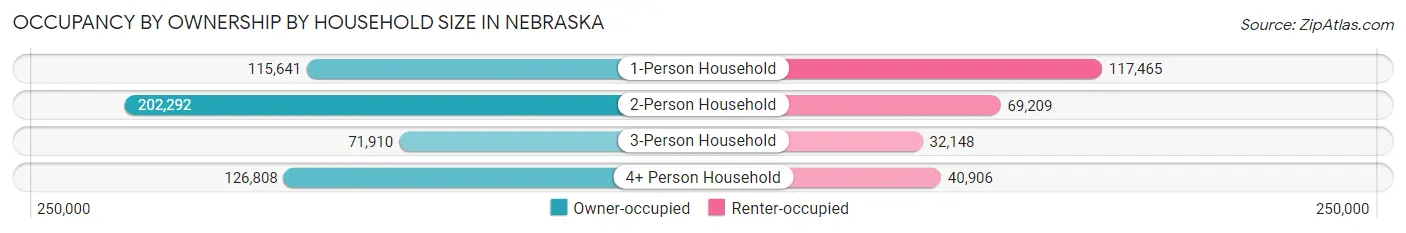
| Household Size | Owner-occupied | Renter-occupied |
| 1-Person Household | 115,641 (49.6%) | 117,465 (50.4%) |
| 2-Person Household | 202,292 (74.5%) | 69,209 (25.5%) |
| 3-Person Household | 71,910 (69.1%) | 32,148 (30.9%) |
| 4+ Person Household | 126,808 (75.6%) | 40,906 (24.4%) |
| Total Housing Units | 516,651 (66.5%) | 259,728 (33.5%) |
Occupancy by Educational Attainment in Nebraska
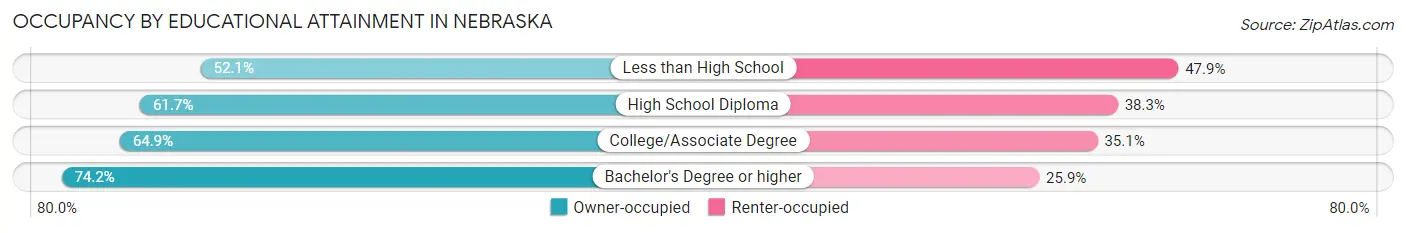
| Household Size | Owner-occupied | Renter-occupied |
| Less than High School | 26,949 (52.1%) | 24,784 (47.9%) |
| High School Diploma | 111,513 (61.7%) | 69,244 (38.3%) |
| College/Associate Degree | 176,149 (64.9%) | 95,255 (35.1%) |
| Bachelor's Degree or higher | 202,040 (74.2%) | 70,445 (25.9%) |
Occupancy by Age of Householder in Nebraska
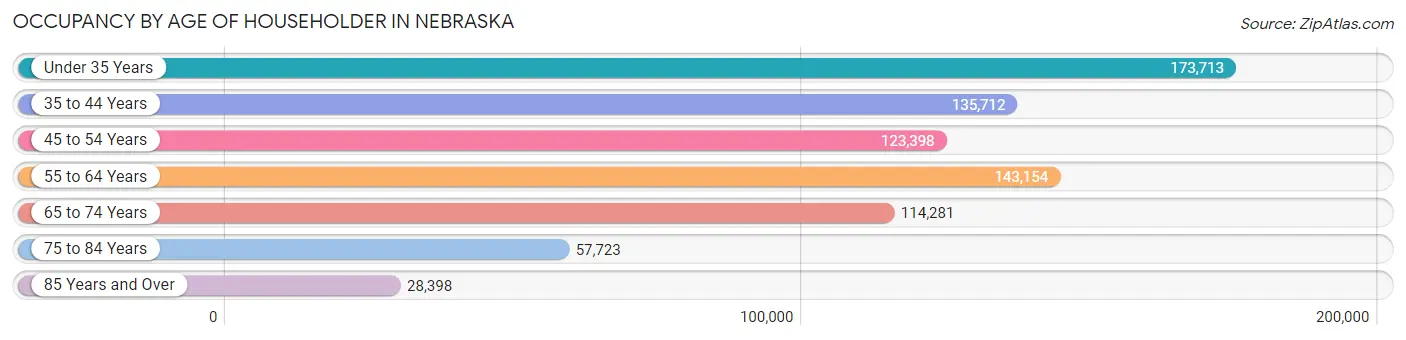
| Age Bracket | # Households | % Households |
| Under 35 Years | 173,713 | 22.4% |
| 35 to 44 Years | 135,712 | 17.5% |
| 45 to 54 Years | 123,398 | 15.9% |
| 55 to 64 Years | 143,154 | 18.4% |
| 65 to 74 Years | 114,281 | 14.7% |
| 75 to 84 Years | 57,723 | 7.4% |
| 85 Years and Over | 28,398 | 3.7% |
| Total | 776,379 | 100.0% |
Housing Finances in Nebraska
Median Income by Occupancy in Nebraska
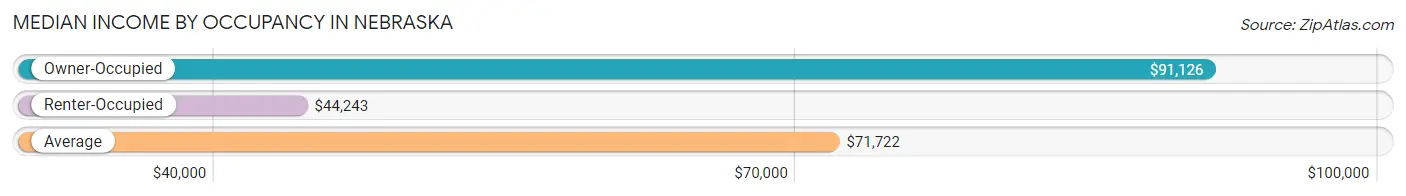
| Occupancy Type | # Households | Median Income |
| Owner-Occupied | 516,651 (66.5%) | $91,126 |
| Renter-Occupied | 259,728 (33.5%) | $44,243 |
| Average | 776,379 (100.0%) | $71,722 |
Occupancy by Householder Income Bracket in Nebraska
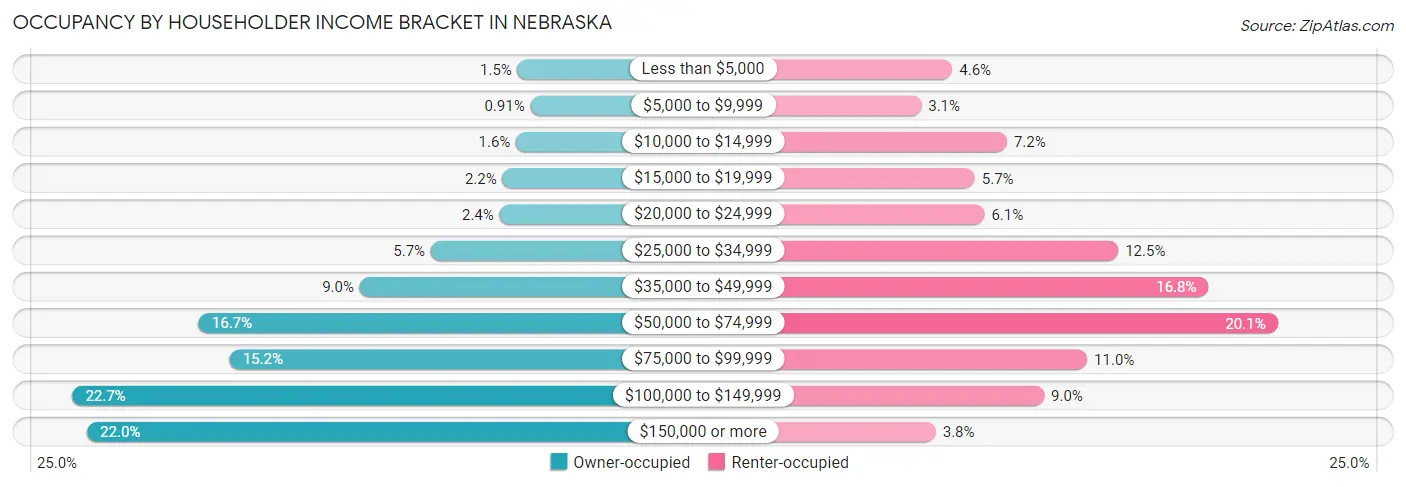
| Income Bracket | Owner-occupied | Renter-occupied |
| Less than $5,000 | 7,866 (1.5%) | 11,969 (4.6%) |
| $5,000 to $9,999 | 4,695 (0.9%) | 8,124 (3.1%) |
| $10,000 to $14,999 | 8,204 (1.6%) | 18,731 (7.2%) |
| $15,000 to $19,999 | 11,587 (2.2%) | 14,750 (5.7%) |
| $20,000 to $24,999 | 12,293 (2.4%) | 15,955 (6.1%) |
| $25,000 to $34,999 | 29,171 (5.7%) | 32,504 (12.5%) |
| $35,000 to $49,999 | 46,725 (9.0%) | 43,626 (16.8%) |
| $50,000 to $74,999 | 86,282 (16.7%) | 52,185 (20.1%) |
| $75,000 to $99,999 | 78,669 (15.2%) | 28,649 (11.0%) |
| $100,000 to $149,999 | 117,375 (22.7%) | 23,318 (9.0%) |
| $150,000 or more | 113,784 (22.0%) | 9,917 (3.8%) |
| Total | 516,651 (100.0%) | 259,728 (100.0%) |
Monthly Housing Cost Tiers in Nebraska
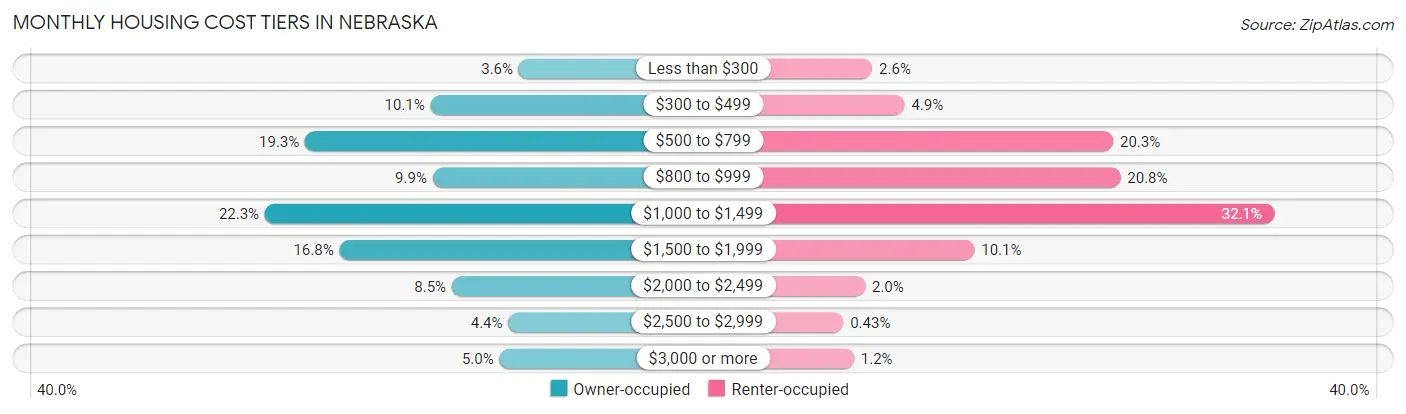
| Monthly Cost | Owner-occupied | Renter-occupied |
| Less than $300 | 18,580 (3.6%) | 6,644 (2.6%) |
| $300 to $499 | 52,163 (10.1%) | 12,834 (4.9%) |
| $500 to $799 | 99,919 (19.3%) | 52,725 (20.3%) |
| $800 to $999 | 51,349 (9.9%) | 54,140 (20.8%) |
| $1,000 to $1,499 | 115,213 (22.3%) | 83,465 (32.1%) |
| $1,500 to $1,999 | 86,853 (16.8%) | 26,190 (10.1%) |
| $2,000 to $2,499 | 44,076 (8.5%) | 5,266 (2.0%) |
| $2,500 to $2,999 | 22,558 (4.4%) | 1,106 (0.4%) |
| $3,000 or more | 25,940 (5.0%) | 3,133 (1.2%) |
| Total | 516,651 (100.0%) | 259,728 (100.0%) |
Physical Housing Characteristics in Nebraska
Housing Structures in Nebraska
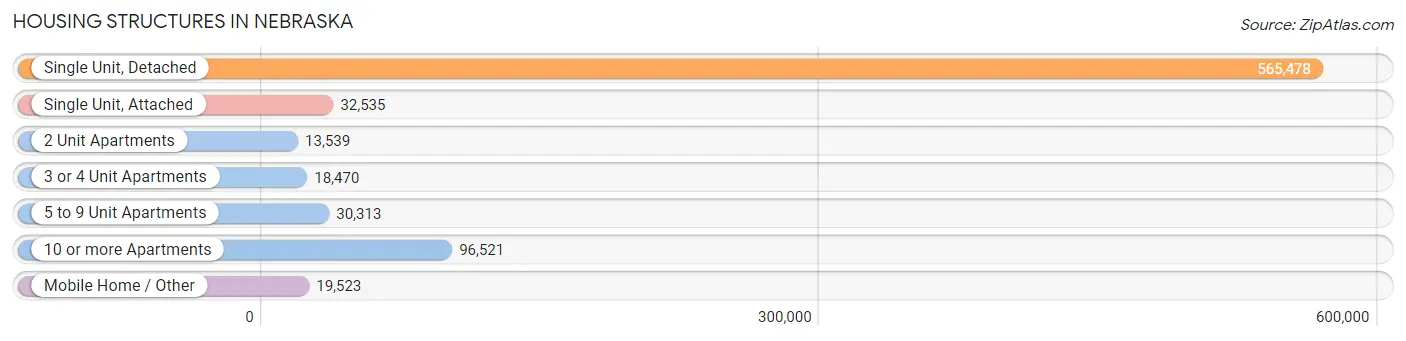
| Structure Type | # Housing Units | % Housing Units |
| Single Unit, Detached | 565,478 | 72.8% |
| Single Unit, Attached | 32,535 | 4.2% |
| 2 Unit Apartments | 13,539 | 1.7% |
| 3 or 4 Unit Apartments | 18,470 | 2.4% |
| 5 to 9 Unit Apartments | 30,313 | 3.9% |
| 10 or more Apartments | 96,521 | 12.4% |
| Mobile Home / Other | 19,523 | 2.5% |
| Total | 776,379 | 100.0% |
Housing Structures by Occupancy in Nebraska
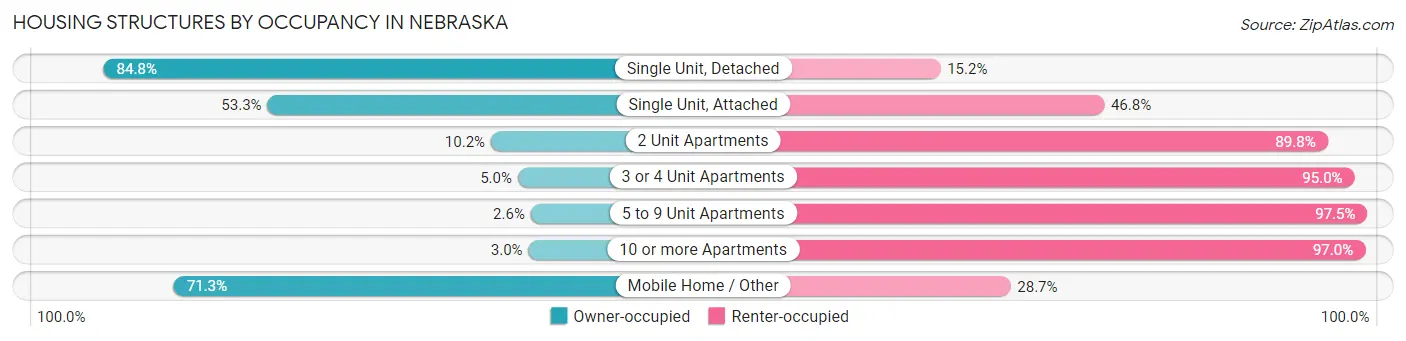
| Structure Type | Owner-occupied | Renter-occupied |
| Single Unit, Detached | 479,428 (84.8%) | 86,050 (15.2%) |
| Single Unit, Attached | 17,326 (53.2%) | 15,209 (46.8%) |
| 2 Unit Apartments | 1,384 (10.2%) | 12,155 (89.8%) |
| 3 or 4 Unit Apartments | 931 (5.0%) | 17,539 (95.0%) |
| 5 to 9 Unit Apartments | 773 (2.5%) | 29,540 (97.5%) |
| 10 or more Apartments | 2,894 (3.0%) | 93,627 (97.0%) |
| Mobile Home / Other | 13,915 (71.3%) | 5,608 (28.7%) |
| Total | 516,651 (66.5%) | 259,728 (33.5%) |
Housing Structures by Number of Rooms in Nebraska
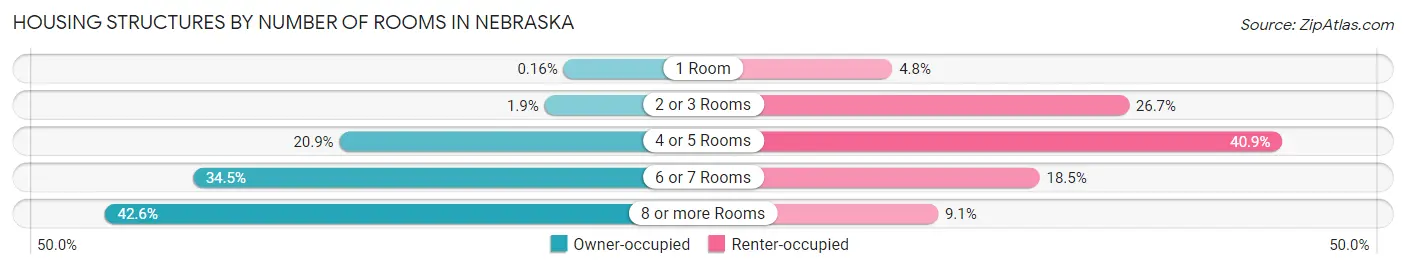
| Number of Rooms | Owner-occupied | Renter-occupied |
| 1 Room | 805 (0.2%) | 12,573 (4.8%) |
| 2 or 3 Rooms | 9,893 (1.9%) | 69,400 (26.7%) |
| 4 or 5 Rooms | 107,872 (20.9%) | 106,248 (40.9%) |
| 6 or 7 Rooms | 177,998 (34.4%) | 47,950 (18.5%) |
| 8 or more Rooms | 220,083 (42.6%) | 23,557 (9.1%) |
| Total | 516,651 (100.0%) | 259,728 (100.0%) |
Housing Structure by Heating Type in Nebraska
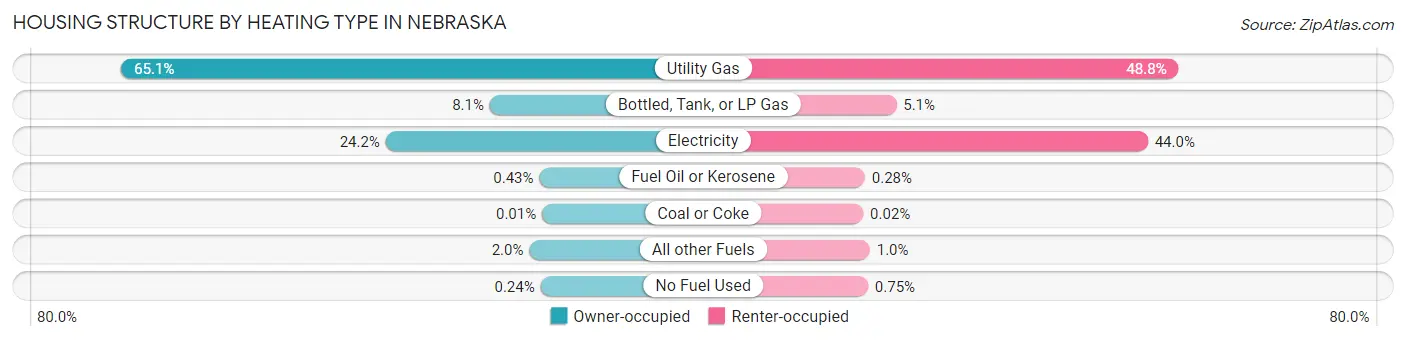
| Heating Type | Owner-occupied | Renter-occupied |
| Utility Gas | 336,304 (65.1%) | 126,650 (48.8%) |
| Bottled, Tank, or LP Gas | 41,727 (8.1%) | 13,361 (5.1%) |
| Electricity | 124,935 (24.2%) | 114,310 (44.0%) |
| Fuel Oil or Kerosene | 2,199 (0.4%) | 723 (0.3%) |
| Coal or Coke | 41 (0.0%) | 51 (0.0%) |
| All other Fuels | 10,205 (2.0%) | 2,695 (1.0%) |
| No Fuel Used | 1,240 (0.2%) | 1,938 (0.7%) |
| Total | 516,651 (100.0%) | 259,728 (100.0%) |
Household Vehicle Usage in Nebraska
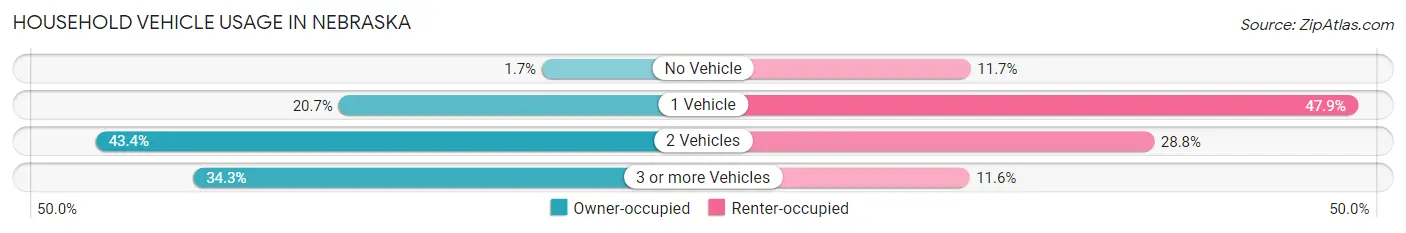
| Vehicles per Household | Owner-occupied | Renter-occupied |
| No Vehicle | 8,816 (1.7%) | 30,424 (11.7%) |
| 1 Vehicle | 106,832 (20.7%) | 124,278 (47.8%) |
| 2 Vehicles | 224,007 (43.4%) | 74,900 (28.8%) |
| 3 or more Vehicles | 176,996 (34.3%) | 30,126 (11.6%) |
| Total | 516,651 (100.0%) | 259,728 (100.0%) |
Real Estate & Mortgages in Nebraska
Real Estate and Mortgage Overview in Nebraska
| Characteristic | Without Mortgage | With Mortgage |
| Housing Units | 212,052 | 304,599 |
| Median Property Value | $175,900 | $222,200 |
| Median Household Income | $68,634 | $83,257 |
| Monthly Housing Costs | $616 | $25,345 |
| Real Estate Taxes | $2,720 | $7,797 |
Property Value by Mortgage Status in Nebraska
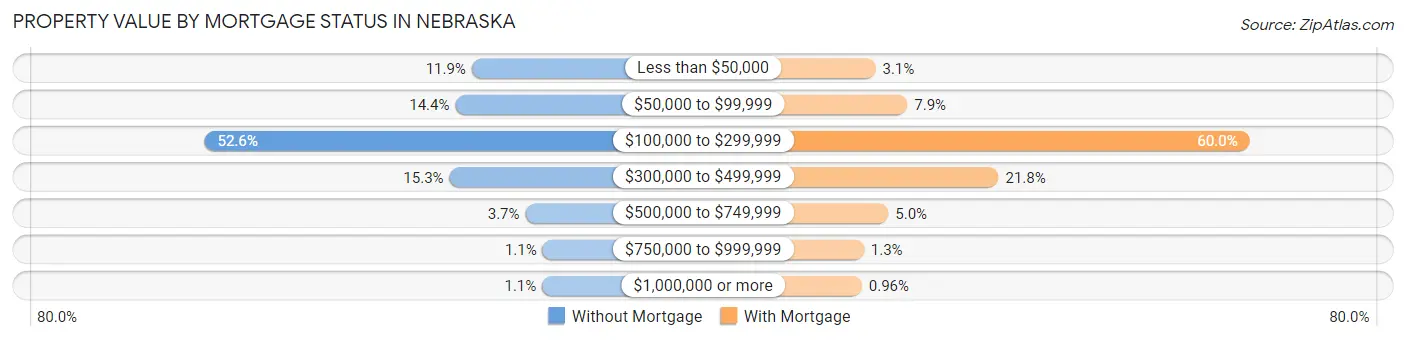
| Property Value | Without Mortgage | With Mortgage |
| Less than $50,000 | 25,177 (11.9%) | 9,298 (3.0%) |
| $50,000 to $99,999 | 30,472 (14.4%) | 24,033 (7.9%) |
| $100,000 to $299,999 | 111,505 (52.6%) | 182,849 (60.0%) |
| $300,000 to $499,999 | 32,383 (15.3%) | 66,379 (21.8%) |
| $500,000 to $749,999 | 7,819 (3.7%) | 15,236 (5.0%) |
| $750,000 to $999,999 | 2,276 (1.1%) | 3,873 (1.3%) |
| $1,000,000 or more | 2,420 (1.1%) | 2,931 (1.0%) |
| Total | 212,052 (100.0%) | 304,599 (100.0%) |
Household Income by Mortgage Status in Nebraska
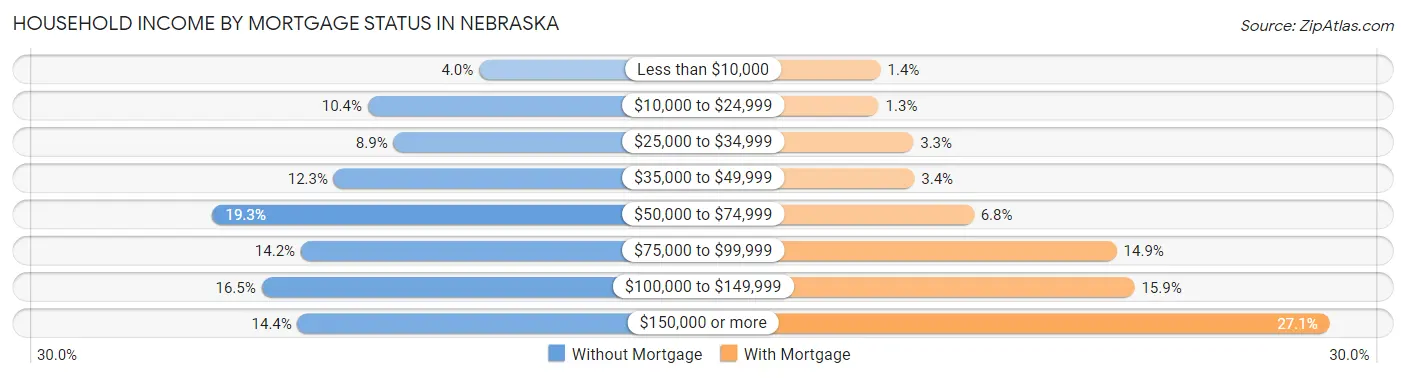
| Household Income | Without Mortgage | With Mortgage |
| Less than $10,000 | 8,544 (4.0%) | 4,351 (1.4%) |
| $10,000 to $24,999 | 22,042 (10.4%) | 4,017 (1.3%) |
| $25,000 to $34,999 | 18,925 (8.9%) | 10,042 (3.3%) |
| $35,000 to $49,999 | 26,151 (12.3%) | 10,246 (3.4%) |
| $50,000 to $74,999 | 40,843 (19.3%) | 20,574 (6.8%) |
| $75,000 to $99,999 | 30,123 (14.2%) | 45,439 (14.9%) |
| $100,000 to $149,999 | 34,897 (16.5%) | 48,546 (15.9%) |
| $150,000 or more | 30,527 (14.4%) | 82,478 (27.1%) |
| Total | 212,052 (100.0%) | 304,599 (100.0%) |
Property Value to Household Income Ratio in Nebraska
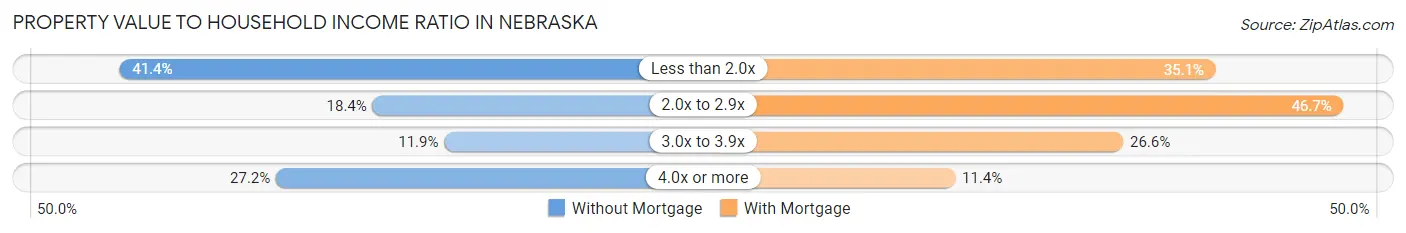
| Value-to-Income Ratio | Without Mortgage | With Mortgage |
| Less than 2.0x | 87,799 (41.4%) | 106,751 (35.0%) |
| 2.0x to 2.9x | 39,020 (18.4%) | 142,106 (46.7%) |
| 3.0x to 3.9x | 25,203 (11.9%) | 81,079 (26.6%) |
| 4.0x or more | 57,585 (27.2%) | 34,641 (11.4%) |
| Total | 212,052 (100.0%) | 304,599 (100.0%) |
Real Estate Taxes by Mortgage Status in Nebraska
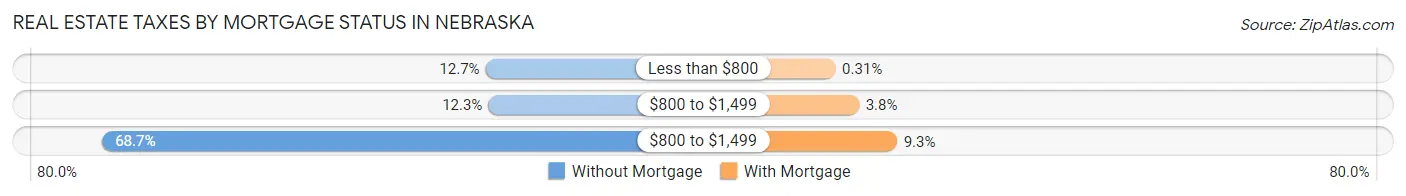
| Property Taxes | Without Mortgage | With Mortgage |
| Less than $800 | 26,846 (12.7%) | 951 (0.3%) |
| $800 to $1,499 | 25,988 (12.3%) | 11,411 (3.7%) |
| $800 to $1,499 | 145,574 (68.6%) | 28,325 (9.3%) |
| Total | 212,052 (100.0%) | 304,599 (100.0%) |
Health & Disability in Nebraska
Health Insurance Coverage by Age in Nebraska
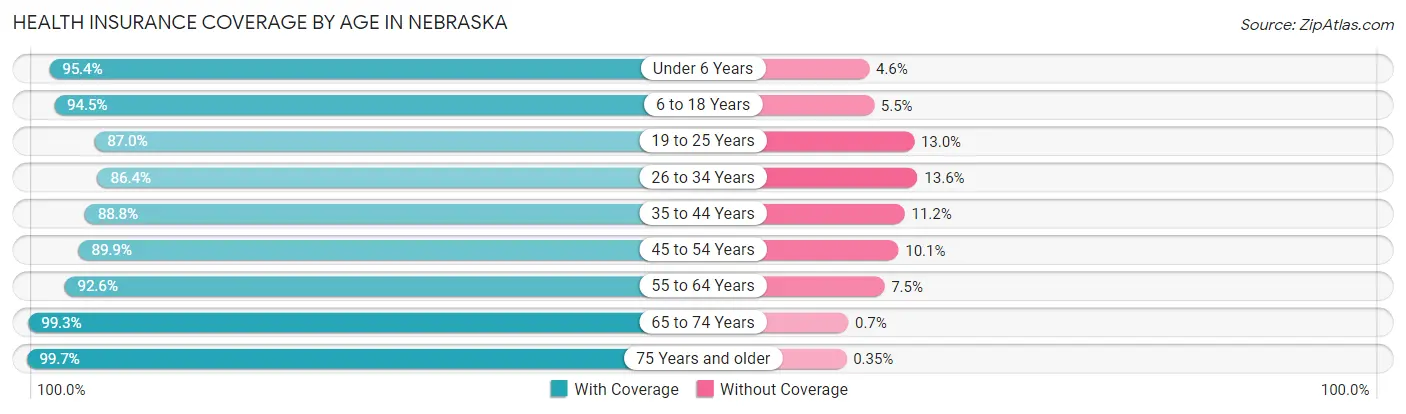
| Age Bracket | With Coverage | Without Coverage |
| Under 6 Years | 147,537 (95.4%) | 7,129 (4.6%) |
| 6 to 18 Years | 334,964 (94.5%) | 19,539 (5.5%) |
| 19 to 25 Years | 163,918 (87.0%) | 24,479 (13.0%) |
| 26 to 34 Years | 192,053 (86.4%) | 30,296 (13.6%) |
| 35 to 44 Years | 219,042 (88.8%) | 27,719 (11.2%) |
| 45 to 54 Years | 195,570 (89.9%) | 21,908 (10.1%) |
| 55 to 64 Years | 222,041 (92.5%) | 17,880 (7.4%) |
| 65 to 74 Years | 181,758 (99.3%) | 1,284 (0.7%) |
| 75 Years and older | 122,560 (99.7%) | 430 (0.4%) |
| Total | 1,779,443 (92.2%) | 150,664 (7.8%) |
Health Insurance Coverage by Citizenship Status in Nebraska
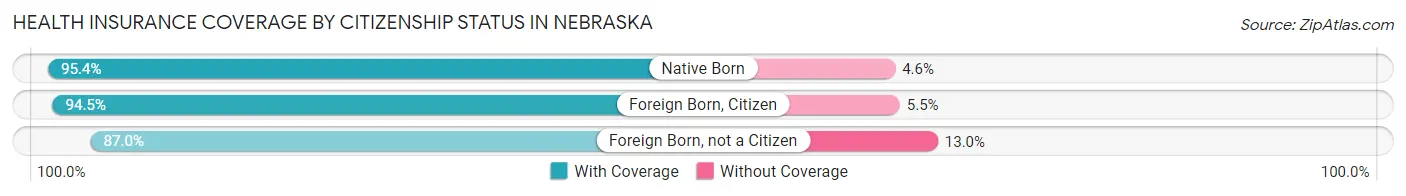
| Citizenship Status | With Coverage | Without Coverage |
| Native Born | 147,537 (95.4%) | 7,129 (4.6%) |
| Foreign Born, Citizen | 334,964 (94.5%) | 19,539 (5.5%) |
| Foreign Born, not a Citizen | 163,918 (87.0%) | 24,479 (13.0%) |
Health Insurance Coverage by Household Income in Nebraska
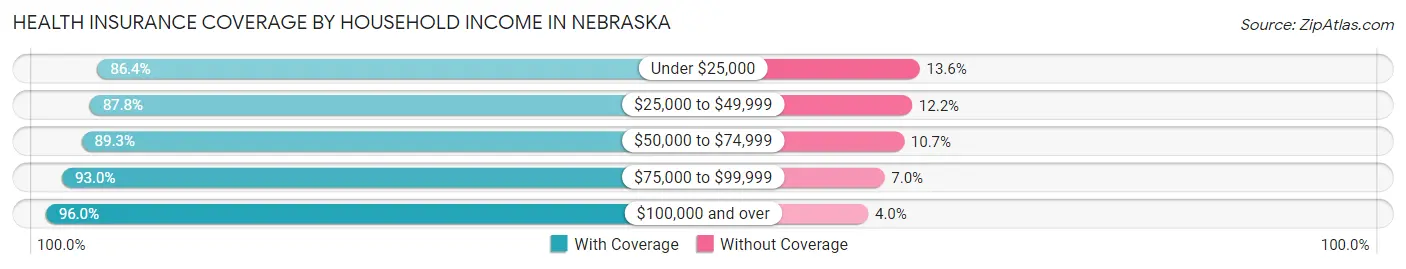
| Household Income | With Coverage | Without Coverage |
| Under $25,000 | 152,987 (86.4%) | 24,143 (13.6%) |
| $25,000 to $49,999 | 260,270 (87.8%) | 36,180 (12.2%) |
| $50,000 to $74,999 | 286,826 (89.3%) | 34,332 (10.7%) |
| $75,000 to $99,999 | 265,923 (93.0%) | 20,115 (7.0%) |
| $100,000 and over | 790,608 (96.0%) | 32,797 (4.0%) |
Public vs Private Health Insurance Coverage by Age in Nebraska
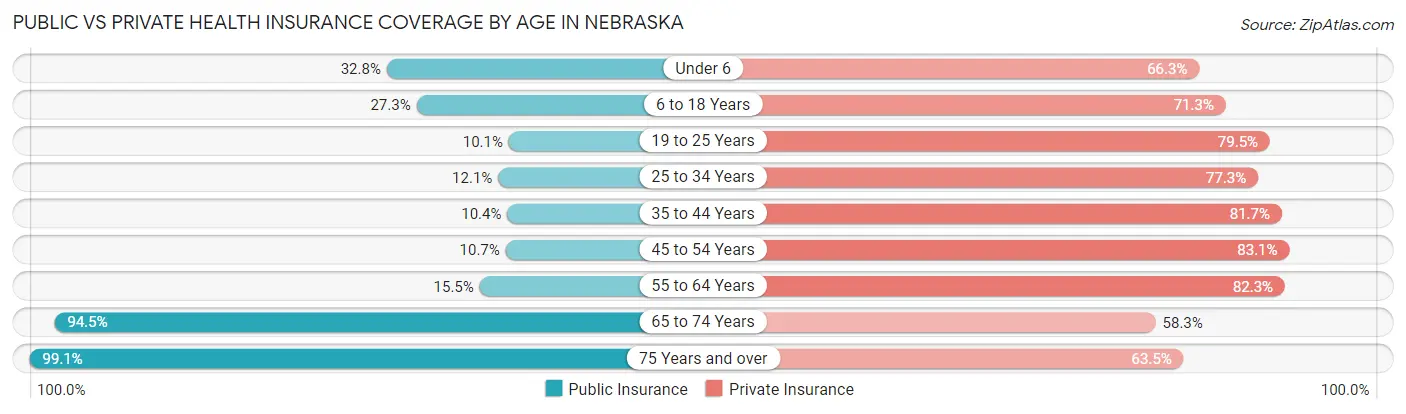
| Age Bracket | Public Insurance | Private Insurance |
| Under 6 | 50,698 (32.8%) | 102,605 (66.3%) |
| 6 to 18 Years | 96,628 (27.3%) | 252,622 (71.3%) |
| 19 to 25 Years | 19,057 (10.1%) | 149,707 (79.5%) |
| 25 to 34 Years | 26,904 (12.1%) | 171,795 (77.3%) |
| 35 to 44 Years | 25,679 (10.4%) | 201,525 (81.7%) |
| 45 to 54 Years | 23,317 (10.7%) | 180,651 (83.1%) |
| 55 to 64 Years | 37,286 (15.5%) | 197,334 (82.3%) |
| 65 to 74 Years | 172,946 (94.5%) | 106,619 (58.3%) |
| 75 Years and over | 121,880 (99.1%) | 78,043 (63.4%) |
| Total | 574,395 (29.8%) | 1,440,901 (74.7%) |
Disability Status by Sex by Age in Nebraska
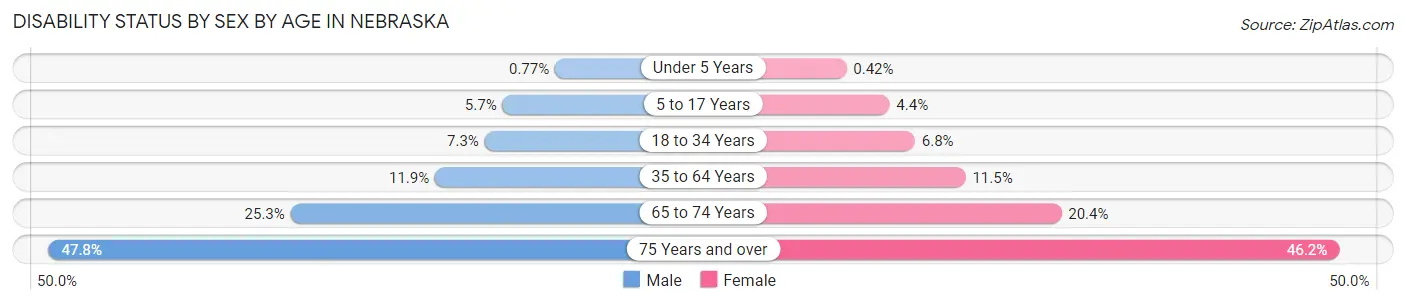
| Age Bracket | Male | Female |
| Under 5 Years | 502 (0.8%) | 261 (0.4%) |
| 5 to 17 Years | 10,242 (5.7%) | 7,571 (4.4%) |
| 18 to 34 Years | 16,293 (7.3%) | 14,726 (6.8%) |
| 35 to 64 Years | 42,528 (11.9%) | 39,854 (11.5%) |
| 65 to 74 Years | 22,306 (25.3%) | 19,336 (20.4%) |
| 75 Years and over | 24,622 (47.8%) | 32,972 (46.2%) |
Disability Class by Sex by Age in Nebraska
Disability Class: Hearing Difficulty
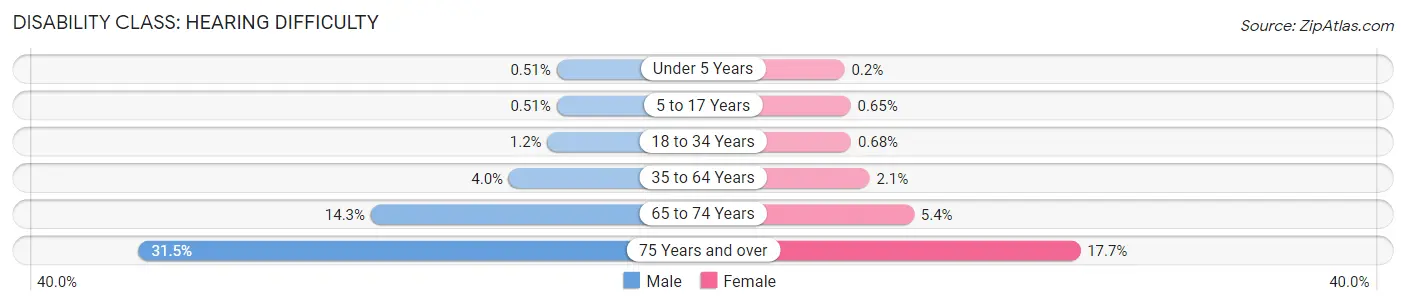
| Age Bracket | Male | Female |
| Under 5 Years | 332 (0.5%) | 124 (0.2%) |
| 5 to 17 Years | 924 (0.5%) | 1,104 (0.6%) |
| 18 to 34 Years | 2,623 (1.2%) | 1,486 (0.7%) |
| 35 to 64 Years | 14,406 (4.0%) | 7,165 (2.1%) |
| 65 to 74 Years | 12,595 (14.3%) | 5,079 (5.3%) |
| 75 Years and over | 16,250 (31.5%) | 12,645 (17.7%) |
Disability Class: Vision Difficulty
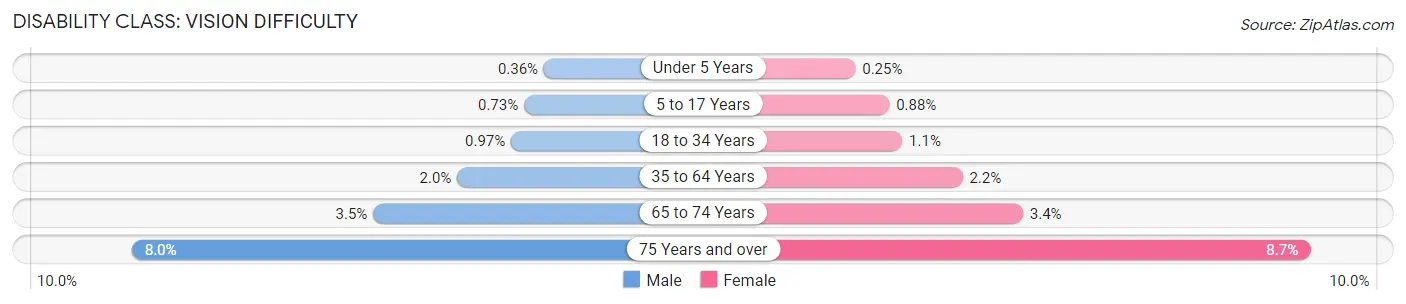
| Age Bracket | Male | Female |
| Under 5 Years | 236 (0.4%) | 155 (0.3%) |
| 5 to 17 Years | 1,318 (0.7%) | 1,506 (0.9%) |
| 18 to 34 Years | 2,167 (1.0%) | 2,438 (1.1%) |
| 35 to 64 Years | 7,037 (2.0%) | 7,768 (2.2%) |
| 65 to 74 Years | 3,110 (3.5%) | 3,188 (3.4%) |
| 75 Years and over | 4,128 (8.0%) | 6,211 (8.7%) |
Disability Class: Cognitive Difficulty
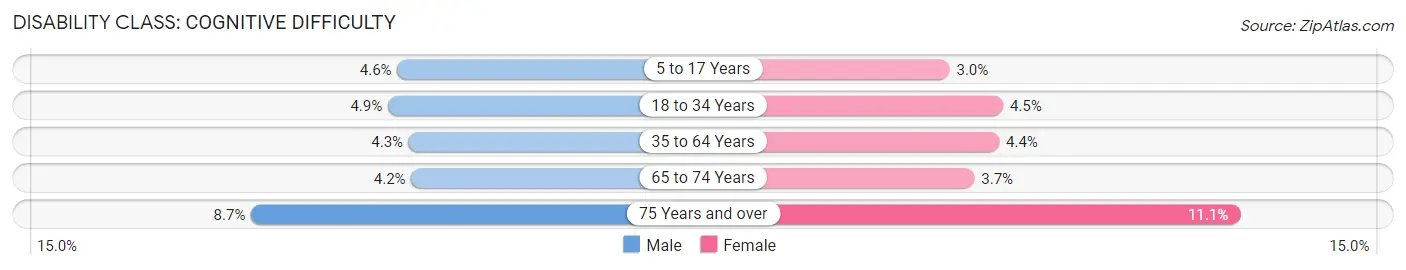
| Age Bracket | Male | Female |
| 5 to 17 Years | 8,366 (4.6%) | 5,130 (3.0%) |
| 18 to 34 Years | 10,878 (4.9%) | 9,765 (4.5%) |
| 35 to 64 Years | 15,367 (4.3%) | 15,214 (4.4%) |
| 65 to 74 Years | 3,732 (4.2%) | 3,504 (3.7%) |
| 75 Years and over | 4,480 (8.7%) | 7,921 (11.1%) |
Disability Class: Ambulatory Difficulty
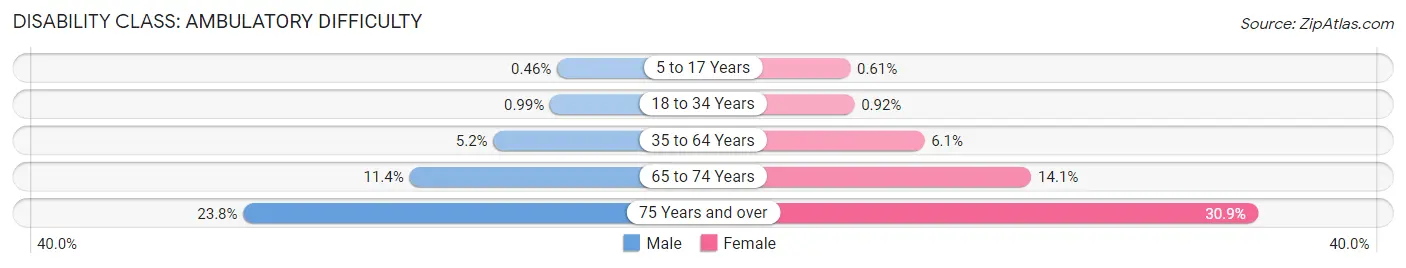
| Age Bracket | Male | Female |
| 5 to 17 Years | 840 (0.5%) | 1,042 (0.6%) |
| 18 to 34 Years | 2,215 (1.0%) | 1,991 (0.9%) |
| 35 to 64 Years | 18,512 (5.2%) | 21,259 (6.1%) |
| 65 to 74 Years | 10,067 (11.4%) | 13,347 (14.1%) |
| 75 Years and over | 12,245 (23.8%) | 22,048 (30.9%) |
Disability Class: Self-Care Difficulty
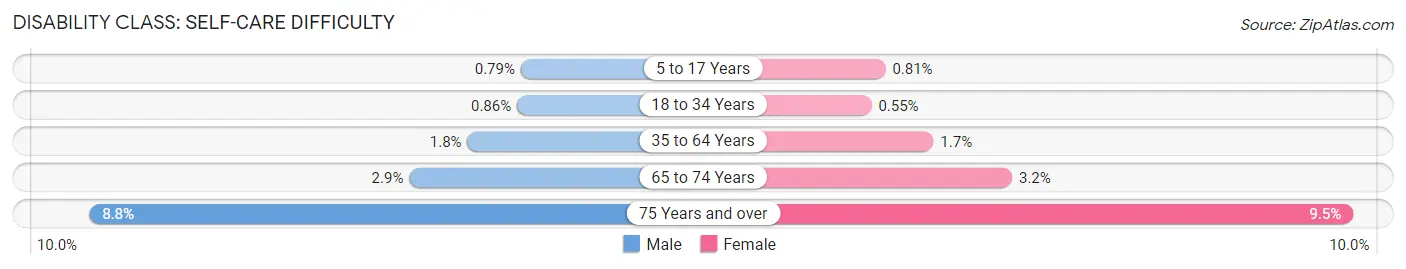
| Age Bracket | Male | Female |
| 5 to 17 Years | 1,429 (0.8%) | 1,388 (0.8%) |
| 18 to 34 Years | 1,909 (0.9%) | 1,205 (0.5%) |
| 35 to 64 Years | 6,355 (1.8%) | 5,899 (1.7%) |
| 65 to 74 Years | 2,522 (2.9%) | 2,996 (3.2%) |
| 75 Years and over | 4,538 (8.8%) | 6,783 (9.5%) |
Technology Access in Nebraska
Computing Device Access in Nebraska
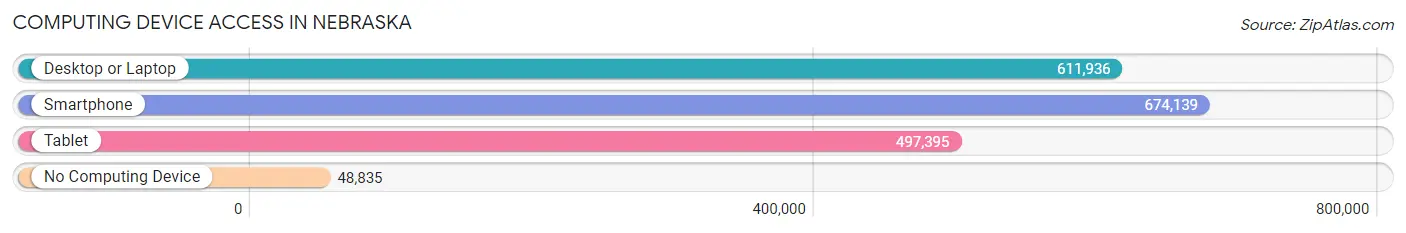
| Device Type | # Households | % Households |
| Desktop or Laptop | 611,936 | 78.8% |
| Smartphone | 674,139 | 86.8% |
| Tablet | 497,395 | 64.1% |
| No Computing Device | 48,835 | 6.3% |
| Total | 776,379 | 100.0% |
Internet Access in Nebraska
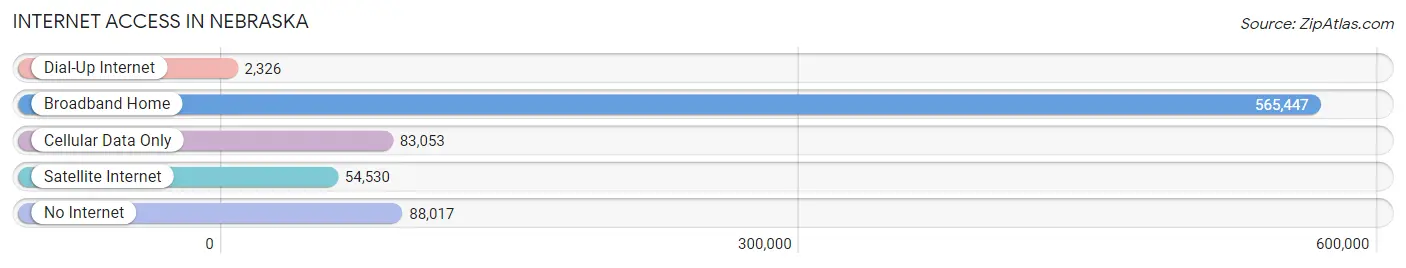
| Internet Type | # Households | % Households |
| Dial-Up Internet | 2,326 | 0.3% |
| Broadband Home | 565,447 | 72.8% |
| Cellular Data Only | 83,053 | 10.7% |
| Satellite Internet | 54,530 | 7.0% |
| No Internet | 88,017 | 11.3% |
| Total | 776,379 | 100.0% |
Nebraska Summary
Nebraska is a state located in the Midwestern United States. It is bordered by South Dakota to the north, Iowa to the east, Missouri to the southeast, Kansas to the south, Colorado to the southwest, and Wyoming to the west. Nebraska is the 16th largest state in the United States, with an area of 77,354 square miles (200,000 km2). It is the 37th most populous state, with a population of 1,929,268 as of 2019.
History
The first inhabitants of Nebraska were Native Americans, including the Omaha, Ponca, Pawnee, and Otoe tribes. The first Europeans to explore the area were French fur traders, who arrived in the late 1700s. In 1803, the United States acquired the area as part of the Louisiana Purchase.
In 1854, the Kansas-Nebraska Act created the Nebraska Territory, which included the present-day states of Nebraska, South Dakota, North Dakota, and parts of Wyoming and Montana. The territory was divided into two parts, the northern part becoming the Dakota Territory and the southern part becoming the Nebraska Territory.
In 1867, Nebraska became the 37th state in the Union. The state's economy was largely based on agriculture, with the majority of the population living in rural areas.
Geography
Nebraska is located in the Great Plains region of the United States. It is bordered by South Dakota to the north, Iowa to the east, Missouri to the southeast, Kansas to the south, Colorado to the southwest, and Wyoming to the west.
The state is divided into two distinct regions: the eastern part of the state is characterized by rolling hills and fertile soil, while the western part is characterized by rugged terrain and dry climate. The state's highest point is Panorama Point, located in the Panorama Hills of the Nebraska Sandhills, at 5,424 feet (1,655 m). The state's lowest point is the Missouri River, at 840 feet (256 m).
Economy
Nebraska's economy is largely based on agriculture, with the majority of the state's population living in rural areas. The state is a major producer of corn, soybeans, wheat, and other grains. It is also a major producer of beef, pork, and dairy products.
The state is also home to a number of large companies, including ConAgra Foods, Union Pacific Railroad, and Berkshire Hathaway. The state's largest city, Omaha, is home to several Fortune 500 companies, including Mutual of Omaha, Kiewit Corporation, and TD Ameritrade.
Demographics
As of 2019, the population of Nebraska was estimated to be 1,929,268. The state is predominantly white, with a population that is 85.3% non-Hispanic white. The state's largest racial/ethnic group is Hispanic or Latino, making up 8.7% of the population. Other racial/ethnic groups include African American (4.3%), Asian (2.2%), and Native American (1.2%).
The median household income in Nebraska is $58,906, and the median home value is $164,400. The state's poverty rate is 11.2%, slightly lower than the national average of 11.8%.
Conclusion
Nebraska is a state located in the Midwestern United States. It is bordered by South Dakota to the north, Iowa to the east, Missouri to the southeast, Kansas to the south, Colorado to the southwest, and Wyoming to the west. Nebraska is the 16th largest state in the United States, with an area of 77,354 square miles (200,000 km2). It is the 37th most populous state, with a population of 1,929,268 as of 2019. The state's economy is largely based on agriculture, with the majority of the population living in rural areas. The state is predominantly white, with a population that is 85.3% non-Hispanic white. The median household income in Nebraska is $58,906, and the median home value is $164,400. The state's poverty rate is 11.2%, slightly lower than the national average of 11.8%.
Common Questions
When was Nebraska Incorporated?
Nebraska was Incorporated into the Union on Mar 1, 1867.
What is the Total Area of Nebraska?
Total Area of Nebraska is 77,349 Square Miles.
What is the Total Land Area of Nebraska?
Total Land Area of Nebraska is 76,825 Square Miles.
What is the Total Water Area of Nebraska?
Total Water Area of Nebraska is 524 Square Miles.
What is the Average Elevation in Nebraska?
Average Elevation in Nebraska is 2,600 Feet.
What is the Highest Elevation in Nebraska?
Highest Elevation in Nebraska is 5,424 Feet.
What is the Lowest Elevation in Nebraska?
Lowest Elevation in Nebraska is 840 Feet.
What is the Population Density in Nebraska?
Population Density in Nebraska is 25.5 People per Square Mile.
What is Per Capita Income in Nebraska?
Per Capita income in Nebraska is $38,585.
What is the Median Family Income in Nebraska?
Median Family Income in Nebraska is $92,614.
What is the Median Household income in Nebraska?
Median Household Income in Nebraska is $71,722.
What is Income or Wage Gap in Nebraska?
Income or Wage Gap in Nebraska is 29.0%.
Women in Nebraska earn 71.0 cents for every dollar earned by a man.
What is Family Income Deficit in Nebraska?
Family Income Deficit in Nebraska is $10,263.
Families that are below poverty line in Nebraska earn $10,263 less on average than the poverty threshold level.
What is Inequality or Gini Index in Nebraska?
Inequality or Gini Index in Nebraska is 0.45.
What is the Total Population of Nebraska?
Total Population of Nebraska is 1,958,939.
What is the Total Male Population of Nebraska?
Total Male Population of Nebraska is 984,570.
What is the Total Female Population of Nebraska?
Total Female Population of Nebraska is 974,369.
What is the Ratio of Males per 100 Females in Nebraska?
There are 101.05 Males per 100 Females in Nebraska.
What is the Ratio of Females per 100 Males in Nebraska?
There are 98.96 Females per 100 Males in Nebraska.
What is the Median Population Age in Nebraska?
Median Population Age in Nebraska is 36.9 Years.
What is the Average Family Size in Nebraska
Average Family Size in Nebraska is 3.1 People.
What is the Average Household Size in Nebraska
Average Household Size in Nebraska is 2.5 People.
How Large is the Labor Force in Nebraska?
There are 1,054,257 People in the Labor Forcein in Nebraska.
What is the Percentage of People in the Labor Force in Nebraska?
68.8% of People are in the Labor Force in Nebraska.
What is the Unemployment Rate in Nebraska?
Unemployment Rate in Nebraska is 3.1%.