Latvian Disability Age 5 to 17

COMPARE

Latvian
Race
Ancestry
AfghanAfricanAlaska NativeAlaskan AthabascanAlbanianAleutAlsatianAmericanApacheArabArapahoArgentineanArmenianAssyrian/Chaldean/SyriacAustralianAustrianBahamianBangladeshiBarbadianBasqueBelgianBelizeanBermudanBhutaneseBlackfeetBolivianBrazilianBritishBritish West IndianBulgarianBurmeseCajunCambodianCanadianCape VerdeanCarpatho RusynCelticCentral AmericanCentral American IndianCherokeeCheyenneChickasawChileanChineseChippewaChoctawColombianColvilleComancheCosta RicanCreeCreekCroatianCrowCubanCypriotCzechCzechoslovakianDanishDelawareDominicanDutchDutch West IndianEastern EuropeanEcuadorianEgyptianEnglishEstonianEthiopianEuropeanFijianFilipinoFinnishFrenchFrench American IndianFrench CanadianGermanGerman RussianGhanaianGreekGuamanian/ChamorroGuatemalanGuyaneseHaitianHmongHonduranHopiHoumaHungarianIcelanderIndian (Asian)IndonesianInupiatIranianIraqiIrishIroquoisIsraeliItalianJamaicanJapaneseJordanianKenyanKiowaKoreanLaotianLatvianLebaneseLiberianLithuanianLumbeeLuxembourgerMacedonianMalaysianMalteseMarshalleseMenomineeMexicanMexican American IndianMongolianMoroccanNative HawaiianNavajoNepaleseNew ZealanderNicaraguanNigerianNorthern EuropeanNorwegianOkinawanOsageOttawaPaiutePakistaniPalestinianPanamanianParaguayanPennsylvania GermanPeruvianPimaPolishPortuguesePotawatomiPuebloPuerto RicanPuget Sound SalishRomanianRussianSalvadoranSamoanScandinavianScotch-IrishScottishSeminoleSenegaleseSerbianShoshoneSierra LeoneanSiouxSlavicSlovakSloveneSomaliSouth AfricanSouth AmericanSouth American IndianSoviet UnionSpaniardSpanishSpanish AmericanSpanish American IndianSri LankanSubsaharan AfricanSudaneseSwedishSwissSyrianTaiwaneseThaiTlingit-HaidaTohono O'OdhamTonganTrinidadian and TobagonianTsimshianTurkishU.S. Virgin IslanderUgandanUkrainianUruguayanUteVenezuelanVietnameseWelshWest IndianYakamaYaquiYugoslavianYumanYup'ikZimbabwean
Immigration
NonimmigrantsImmigrantsAfghanistanAfricaAlbaniaArgentinaArmeniaAsiaAustraliaAustriaBahamasBangladeshBarbadosBelarusBelgiumBelizeBoliviaBosnia and HerzegovinaBrazilBulgariaBurma/MyanmarCabo VerdeCambodiaCameroonCanadaCaribbeanCentral AmericaChileChinaColombiaCongoCosta RicaCroatiaCubaCzechoslovakiaDenmarkDominicaDominican RepublicEastern AfricaEastern AsiaEastern EuropeEcuadorEgyptEl SalvadorEnglandEritreaEthiopiaEuropeFijiFranceGermanyGhanaGreeceGrenadaGuatemalaGuyanaHaitiHondurasHong KongHungaryIndiaIndonesiaIranIraqIrelandIsraelItalyJamaicaJapanJordanKazakhstanKenyaKoreaKuwaitLaosLatin AmericaLatviaLebanonLiberiaLithuaniaMalaysiaMexicoMicronesiaMiddle AfricaMoldovaMoroccoNepalNetherlandsNicaraguaNigeriaNorth AmericaNorth MacedoniaNorthern AfricaNorthern EuropeNorwayOceaniaPakistanPanamaPeruPhilippinesPolandPortugalRomaniaRussiaSaudi ArabiaScotlandSenegalSerbiaSierra LeoneSingaporeSomaliaSouth AfricaSouth AmericaSouth Central AsiaSouth Eastern AsiaSouthern EuropeSpainSri LankaSt. Vincent and the GrenadinesSudanSwedenSwitzerlandSyriaTaiwanThailandTrinidad and TobagoTurkeyUgandaUkraineUruguayUzbekistanVenezuelaVietnamWest IndiesWestern AfricaWestern AsiaWestern EuropeYemenZaireZimbabweAzores
Select to Compare
Race
Ancestry
AfghanAfricanAlaska NativeAlaskan AthabascanAlbanianAleutAlsatianAmericanApacheArabArapahoArgentineanArmenianAssyrian/Chaldean/SyriacAustralianAustrianBahamianBangladeshiBarbadianBasqueBelgianBelizeanBermudanBhutaneseBlackfeetBolivianBrazilianBritishBritish West IndianBulgarianBurmeseCajunCambodianCanadianCape VerdeanCarpatho RusynCelticCentral AmericanCentral American IndianCherokeeCheyenneChickasawChileanChineseChippewaChoctawColombianColvilleComancheCosta RicanCreeCreekCroatianCrowCubanCypriotCzechCzechoslovakianDanishDelawareDominicanDutchDutch West IndianEastern EuropeanEcuadorianEgyptianEnglishEstonianEthiopianEuropeanFijianFilipinoFinnishFrenchFrench American IndianFrench CanadianGermanGerman RussianGhanaianGreekGuamanian/ChamorroGuatemalanGuyaneseHaitianHmongHonduranHopiHoumaHungarianIcelanderIndian (Asian)IndonesianInupiatIranianIraqiIrishIroquoisIsraeliItalianJamaicanJapaneseJordanianKenyanKiowaKoreanLaotianLebaneseLiberianLithuanianLumbeeLuxembourgerMacedonianMalaysianMalteseMarshalleseMenomineeMexicanMexican American IndianMongolianMoroccanNative HawaiianNavajoNepaleseNew ZealanderNicaraguanNigerianNorthern EuropeanNorwegianOkinawanOsageOttawaPaiutePakistaniPalestinianPanamanianParaguayanPennsylvania GermanPeruvianPimaPolishPortuguesePotawatomiPuebloPuerto RicanPuget Sound SalishRomanianRussianSalvadoranSamoanScandinavianScotch-IrishScottishSeminoleSenegaleseSerbianShoshoneSierra LeoneanSiouxSlavicSlovakSloveneSomaliSouth AfricanSouth AmericanSouth American IndianSoviet UnionSpaniardSpanishSpanish AmericanSpanish American IndianSri LankanSubsaharan AfricanSudaneseSwedishSwissSyrianTaiwaneseThaiTlingit-HaidaTohono O'OdhamTonganTrinidadian and TobagonianTsimshianTurkishU.S. Virgin IslanderUgandanUkrainianUruguayanUteVenezuelanVietnameseWelshWest IndianYakamaYaquiYugoslavianYumanYup'ikZimbabwean
Immigration
NonimmigrantsImmigrantsAfghanistanAfricaAlbaniaArgentinaArmeniaAsiaAustraliaAustriaBahamasBangladeshBarbadosBelarusBelgiumBelizeBoliviaBosnia and HerzegovinaBrazilBulgariaBurma/MyanmarCabo VerdeCambodiaCameroonCanadaCaribbeanCentral AmericaChileChinaColombiaCongoCosta RicaCroatiaCubaCzechoslovakiaDenmarkDominicaDominican RepublicEastern AfricaEastern AsiaEastern EuropeEcuadorEgyptEl SalvadorEnglandEritreaEthiopiaEuropeFijiFranceGermanyGhanaGreeceGrenadaGuatemalaGuyanaHaitiHondurasHong KongHungaryIndiaIndonesiaIranIraqIrelandIsraelItalyJamaicaJapanJordanKazakhstanKenyaKoreaKuwaitLaosLatin AmericaLatviaLebanonLiberiaLithuaniaMalaysiaMexicoMicronesiaMiddle AfricaMoldovaMoroccoNepalNetherlandsNicaraguaNigeriaNorth AmericaNorth MacedoniaNorthern AfricaNorthern EuropeNorwayOceaniaPakistanPanamaPeruPhilippinesPolandPortugalRomaniaRussiaSaudi ArabiaScotlandSenegalSerbiaSierra LeoneSingaporeSomaliaSouth AfricaSouth AmericaSouth Central AsiaSouth Eastern AsiaSouthern EuropeSpainSri LankaSt. Vincent and the GrenadinesSudanSwedenSwitzerlandSyriaTaiwanThailandTrinidad and TobagoTurkeyUgandaUkraineUruguayUzbekistanVenezuelaVietnamWest IndiesWestern AfricaWestern AsiaWestern EuropeYemenZaireZimbabweAzores
Disability Age 5 to 17
Income
Poverty
Unemployment
Labor Participation
Family Structure
Vehicle Availability
Education Level
Disability

Latvian Disability Age 5 to 17
Exceptional

5.4%
DISABILITY | AGE 5 TO 17
95.0/ 100
METRIC RATING
127th/ 347
METRIC RANK

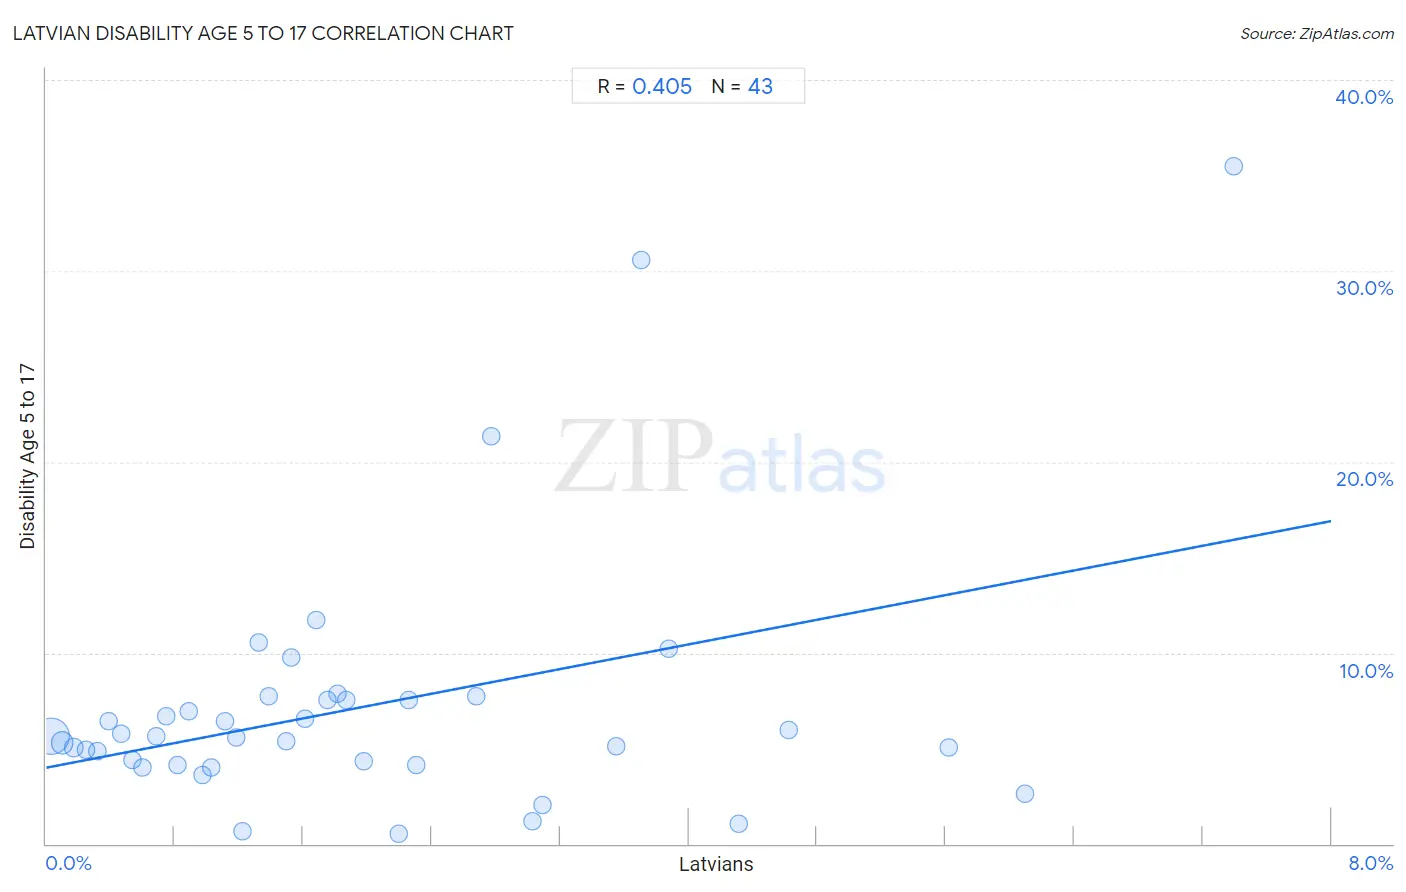
Latvian Disability Age 5 to 17 Correlation Chart

The statistical analysis conducted on geographies consisting of 219,260,682 people shows a moderate positive correlation between the proportion of Latvians and percentage of population with a disability between the ages 5 and 17 in the United States with a correlation coefficient (R) of 0.405 and weighted average of 5.4%. On average, for every 1% (one percent) increase in Latvians within a typical geography, there is an increase of 1.6% in percentage of population with a disability between the ages 5 and 17.
Latvian Disability Age 5 to 17
It is essential to understand that the correlation between the percentage of Latvians and percentage of population with a disability between the ages 5 and 17 does not imply a direct cause-and-effect relationship. It remains uncertain whether the presence of Latvians influences an upward or downward trend in the level of percentage of population with a disability between the ages 5 and 17 within an area, or if Latvians simply ended up residing in those areas with higher or lower levels of percentage of population with a disability between the ages 5 and 17 due to other factors.

Demographics Similar to Latvians by Disability Age 5 to 17

In terms of disability age 5 to 17, the demographic groups most similar to Latvians are New Zealander (5.4%, a difference of 0.0%), Immigrants from Chile (5.4%, a difference of 0.010%), Crow (5.4%, a difference of 0.030%), Immigrants from Venezuela (5.4%, a difference of 0.11%), and Immigrants from Ethiopia (5.4%, a difference of 0.16%).
DemographicsRating | RankDisability Age 5 to 17
Immigrants
97.0
/100
|
#120
Exceptional
5.4%
Maltese
96.0
/100
|
#121
Exceptional
5.4%
Chileans
95.8
/100
|
#122
Exceptional
5.4%
Immigrants from Ethiopia
95.5
/100
|
#123
Exceptional
5.4%
Crow
95.0
/100
|
#124
Exceptional
5.4%
Immigrants from Chile
95.0
/100
|
#125
Exceptional
5.4%
New Zealanders
95.0
/100
|
#126
Exceptional
5.4%
Latvians
95.0
/100
|
#127
Exceptional
5.4%
Immigrants from Venezuela
94.5
/100
|
#128
Exceptional
5.4%
Romanians
94.1
/100
|
#129
Exceptional
5.4%
Immigrants from Bulgaria
94.0
/100
|
#130
Exceptional
5.4%
Arabs
92.9
/100
|
#131
Exceptional
5.4%
Immigrants from Colombia
92.9
/100
|
#132
Exceptional
5.4%
Venezuelans
92.7
/100
|
#133
Exceptional
5.4%
Yuman
92.3
/100
|
#134
Exceptional
5.4%

Latvian Disability Age 5 to 17 Correlation Summary

MeasurementLatvian DataDisability Age 5 to 17 Data
Minimum0.030%0.51%
Maximum7.4%35.5%
Range7.4%35.0%
Mean2.0%7.2%
Median1.5%5.6%
Interquartile 25% (IQ1)0.75%4.1%
Interquartile 75% (IQ3)2.8%7.5%
Interquartile Range (IQR)2.0%3.4%
Standard Deviation (Sample)1.7%6.8%
Standard Deviation (Population)1.7%6.7%

Correlation Details

Latvian PercentileSample SizeDisability Age 5 to 17
[
0.0%
-
0.5%
]
0.030%
161,429,1835.6%
[
0.0%
-
0.5%
]
0.100%
37,112,9955.3%
[
0.0%
-
0.5%
]
0.17%
9,828,8595.0%
[
0.0%
-
0.5%
]
0.25%
4,486,6414.9%
[
0.0%
-
0.5%
]
0.32%
2,542,8684.9%
[
0.0%
-
0.5%
]
0.39%
1,296,5226.4%
[
0.0%
-
0.5%
]
0.47%
559,8415.8%
[
0.5%
-
1.0%
]
0.53%
579,7454.4%
[
0.5%
-
1.0%
]
0.60%
437,8394.0%
[
0.5%
-
1.0%
]
0.69%
237,7235.6%
[
0.5%
-
1.0%
]
0.75%
183,4986.7%
[
0.5%
-
1.0%
]
0.81%
84,6604.1%
[
0.5%
-
1.0%
]
0.89%
100,5126.9%
[
0.5%
-
1.0%
]
0.97%
65,9093.6%
[
1.0%
-
1.5%
]
1.03%
96,5704.0%
[
1.0%
-
1.5%
]
1.11%
7,9896.4%
[
1.0%
-
1.5%
]
1.18%
24,9205.6%
[
1.0%
-
1.5%
]
1.23%
4,1620.65%
[
1.0%
-
1.5%
]
1.32%
11,63810.5%
[
1.0%
-
1.5%
]
1.39%
10,4687.7%
[
1.0%
-
1.5%
]
1.49%
8,1615.3%
[
1.5%
-
2.0%
]
1.53%
38,4199.8%
[
1.5%
-
2.0%
]
1.61%
7,6316.6%
[
1.5%
-
2.0%
]
1.68%
12,51611.7%
[
1.5%
-
2.0%
]
1.75%
4,5027.5%
[
1.5%
-
2.0%
]
1.81%
7,9407.9%
[
1.5%
-
2.0%
]
1.87%
6,7897.5%
[
1.5%
-
2.0%
]
1.98%
13,2544.3%
[
2.0%
-
2.5%
]
2.19%
16,1490.51%
[
2.0%
-
2.5%
]
2.26%
2,9647.5%
[
2.0%
-
2.5%
]
2.30%
5644.1%
[
2.5%
-
3.0%
]
2.67%
13,4977.8%
[
2.5%
-
3.0%
]
2.77%
3,57521.3%
[
3.0%
-
3.5%
]
3.03%
8,4251.2%
[
3.0%
-
3.5%
]
3.09%
1622.0%
[
3.5%
-
4.0%
]
3.55%
7325.1%
[
3.5%
-
4.0%
]
3.70%
45930.6%
[
3.5%
-
4.0%
]
3.87%
1,47210.2%
[
4.0%
-
4.5%
]
4.31%
1,0911.0%
[
4.5%
-
5.0%
]
4.62%
2,1435.9%
[
5.5%
-
6.0%
]
5.62%
4,6115.0%
[
6.0%
-
6.5%
]
6.10%
7712.6%
[
7.0%
-
7.5%
]
7.39%
2,31335.5%