Immigrants from Africa Disability Age 5 to 17
COMPARE
Immigrants from Africa
Select to Compare
Disability Age 5 to 17
Immigrants from Africa Disability Age 5 to 17
5.7%
DISABILITY | AGE 5 TO 17
10.8/ 100
METRIC RATING
206th/ 347
METRIC RANK
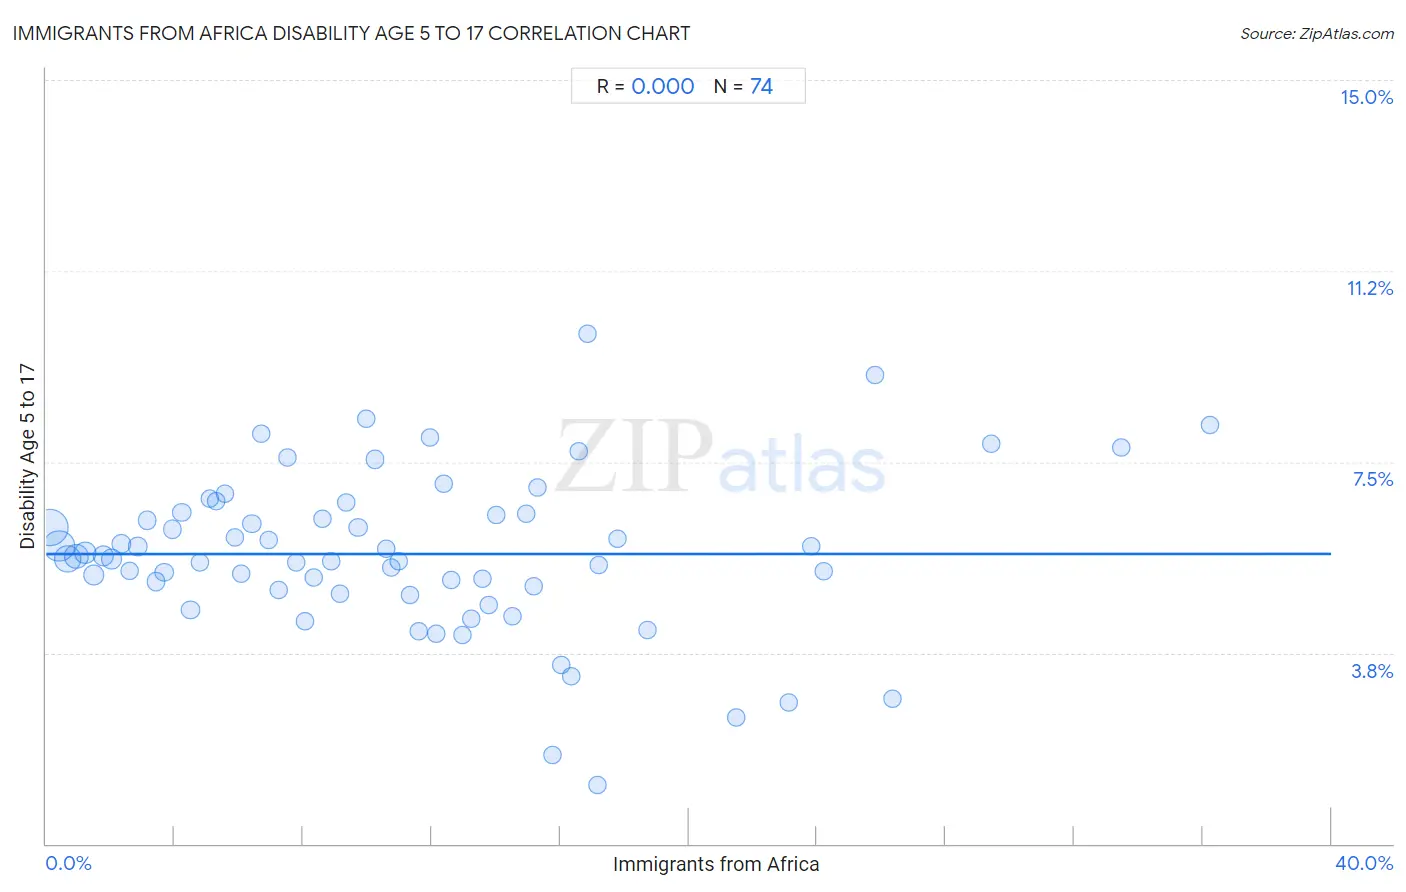
Immigrants from Africa Disability Age 5 to 17 Correlation Chart
The statistical analysis conducted on geographies consisting of 464,573,115 people shows no correlation between the proportion of Immigrants from Africa and percentage of population with a disability between the ages 5 and 17 in the United States with a correlation coefficient (R) of 0.000 and weighted average of 5.7%. On average, for every 1% (one percent) increase in Immigrants from Africa within a typical geography, there is an increase of 0.00004% in percentage of population with a disability between the ages 5 and 17.
It is essential to understand that the correlation between the percentage of Immigrants from Africa and percentage of population with a disability between the ages 5 and 17 does not imply a direct cause-and-effect relationship. It remains uncertain whether the presence of Immigrants from Africa influences an upward or downward trend in the level of percentage of population with a disability between the ages 5 and 17 within an area, or if Immigrants from Africa simply ended up residing in those areas with higher or lower levels of percentage of population with a disability between the ages 5 and 17 due to other factors.
Demographics Similar to Immigrants from Africa by Disability Age 5 to 17
In terms of disability age 5 to 17, the demographic groups most similar to Immigrants from Africa are Trinidadian and Tobagonian (5.7%, a difference of 0.0%), Moroccan (5.7%, a difference of 0.050%), Paiute (5.7%, a difference of 0.060%), Kenyan (5.8%, a difference of 0.10%), and Immigrants from Uganda (5.8%, a difference of 0.14%).
| Demographics | Rating | Rank | Disability Age 5 to 17 |
| Northern Europeans | 15.2 /100 | #199 | Poor 5.7% |
| Icelanders | 14.6 /100 | #200 | Poor 5.7% |
| Basques | 13.7 /100 | #201 | Poor 5.7% |
| Austrians | 13.2 /100 | #202 | Poor 5.7% |
| Spanish American Indians | 12.8 /100 | #203 | Poor 5.7% |
| Paiute | 11.2 /100 | #204 | Poor 5.7% |
| Trinidadians and Tobagonians | 10.8 /100 | #205 | Poor 5.7% |
| Immigrants from Africa | 10.8 /100 | #206 | Poor 5.7% |
| Moroccans | 10.4 /100 | #207 | Poor 5.7% |
| Kenyans | 10.0 /100 | #208 | Poor 5.8% |
| Immigrants from Uganda | 9.7 /100 | #209 | Tragic 5.8% |
| Immigrants from Haiti | 9.5 /100 | #210 | Tragic 5.8% |
| Yugoslavians | 9.1 /100 | #211 | Tragic 5.8% |
| Immigrants from Panama | 8.7 /100 | #212 | Tragic 5.8% |
| Immigrants from Cameroon | 8.3 /100 | #213 | Tragic 5.8% |
Immigrants from Africa Disability Age 5 to 17 Correlation Summary
| Measurement | Immigrants from Africa Data | Disability Age 5 to 17 Data |
| Minimum | 0.13% | 1.2% |
| Maximum | 36.2% | 10.0% |
| Range | 36.1% | 8.9% |
| Mean | 11.1% | 5.7% |
| Median | 10.1% | 5.6% |
| Interquartile 25% (IQ1) | 5.1% | 5.0% |
| Interquartile 75% (IQ3) | 15.3% | 6.5% |
| Interquartile Range (IQR) | 10.2% | 1.5% |
| Standard Deviation (Sample) | 7.9% | 1.6% |
| Standard Deviation (Population) | 7.9% | 1.6% |
Correlation Details
| Immigrants from Africa Percentile | Sample Size | Disability Age 5 to 17 |
[ 0.0% - 0.5% ] 0.13% | 136,326,448 | 6.2% |
[ 0.0% - 0.5% ] 0.40% | 94,871,210 | 5.8% |
[ 0.5% - 1.0% ] 0.67% | 61,433,428 | 5.6% |
[ 0.5% - 1.0% ] 0.94% | 43,828,252 | 5.6% |
[ 1.0% - 1.5% ] 1.21% | 23,790,078 | 5.7% |
[ 1.0% - 1.5% ] 1.50% | 17,540,243 | 5.3% |
[ 1.5% - 2.0% ] 1.78% | 23,291,226 | 5.7% |
[ 2.0% - 2.5% ] 2.04% | 14,302,662 | 5.6% |
[ 2.0% - 2.5% ] 2.32% | 7,908,738 | 5.9% |
[ 2.5% - 3.0% ] 2.59% | 5,333,838 | 5.4% |
[ 2.5% - 3.0% ] 2.85% | 5,826,880 | 5.8% |
[ 3.0% - 3.5% ] 3.14% | 4,469,929 | 6.4% |
[ 3.0% - 3.5% ] 3.41% | 3,450,894 | 5.2% |
[ 3.5% - 4.0% ] 3.67% | 2,627,941 | 5.3% |
[ 3.5% - 4.0% ] 3.92% | 1,593,492 | 6.2% |
[ 4.0% - 4.5% ] 4.22% | 1,688,870 | 6.5% |
[ 4.0% - 4.5% ] 4.49% | 1,405,105 | 4.6% |
[ 4.5% - 5.0% ] 4.78% | 1,510,061 | 5.5% |
[ 5.0% - 5.5% ] 5.09% | 2,180,096 | 6.8% |
[ 5.0% - 5.5% ] 5.30% | 1,229,419 | 6.7% |
[ 5.5% - 6.0% ] 5.56% | 729,657 | 6.9% |
[ 5.5% - 6.0% ] 5.86% | 1,492,429 | 6.0% |
[ 6.0% - 6.5% ] 6.08% | 783,856 | 5.3% |
[ 6.0% - 6.5% ] 6.40% | 579,219 | 6.3% |
[ 6.5% - 7.0% ] 6.67% | 506,159 | 8.0% |
[ 6.5% - 7.0% ] 6.92% | 545,560 | 6.0% |
[ 7.0% - 7.5% ] 7.23% | 479,749 | 5.0% |
[ 7.0% - 7.5% ] 7.50% | 236,674 | 7.6% |
[ 7.5% - 8.0% ] 7.80% | 462,644 | 5.5% |
[ 8.0% - 8.5% ] 8.05% | 249,770 | 4.4% |
[ 8.0% - 8.5% ] 8.32% | 272,323 | 5.2% |
[ 8.5% - 9.0% ] 8.61% | 217,488 | 6.4% |
[ 8.5% - 9.0% ] 8.88% | 164,994 | 5.6% |
[ 9.0% - 9.5% ] 9.13% | 270,132 | 4.9% |
[ 9.0% - 9.5% ] 9.34% | 173,736 | 6.7% |
[ 9.5% - 10.0% ] 9.71% | 410,565 | 6.2% |
[ 9.5% - 10.0% ] 9.94% | 110,519 | 8.3% |
[ 10.0% - 10.5% ] 10.23% | 186,181 | 7.5% |
[ 10.5% - 11.0% ] 10.60% | 106,284 | 5.8% |
[ 10.5% - 11.0% ] 10.74% | 29,184 | 5.4% |
[ 10.5% - 11.0% ] 10.99% | 216,663 | 5.5% |
[ 11.0% - 11.5% ] 11.33% | 128,651 | 4.9% |
[ 11.5% - 12.0% ] 11.60% | 171,611 | 4.2% |
[ 11.5% - 12.0% ] 11.94% | 47,305 | 8.0% |
[ 12.0% - 12.5% ] 12.12% | 198,710 | 4.1% |
[ 12.0% - 12.5% ] 12.39% | 85,199 | 7.1% |
[ 12.5% - 13.0% ] 12.60% | 31,679 | 5.2% |
[ 12.5% - 13.0% ] 12.94% | 211,069 | 4.1% |
[ 13.0% - 13.5% ] 13.24% | 107,661 | 4.4% |
[ 13.5% - 14.0% ] 13.57% | 151,008 | 5.2% |
[ 13.5% - 14.0% ] 13.77% | 65,413 | 4.7% |
[ 14.0% - 14.5% ] 14.03% | 54,073 | 6.5% |
[ 14.0% - 14.5% ] 14.50% | 28,019 | 4.5% |
[ 14.5% - 15.0% ] 14.95% | 37,693 | 6.5% |
[ 15.0% - 15.5% ] 15.19% | 29,516 | 5.0% |
[ 15.0% - 15.5% ] 15.28% | 28,172 | 7.0% |
[ 15.5% - 16.0% ] 15.78% | 9,781 | 1.7% |
[ 16.0% - 16.5% ] 16.04% | 32,191 | 3.5% |
[ 16.0% - 16.5% ] 16.33% | 72,621 | 3.3% |
[ 16.5% - 17.0% ] 16.59% | 31,018 | 7.7% |
[ 16.5% - 17.0% ] 16.87% | 25,987 | 10.0% |
[ 17.0% - 17.5% ] 17.15% | 3,056 | 1.2% |
[ 17.0% - 17.5% ] 17.20% | 56,532 | 5.5% |
[ 17.5% - 18.0% ] 17.78% | 27,919 | 6.0% |
[ 18.5% - 19.0% ] 18.73% | 19,531 | 4.2% |
[ 21.0% - 21.5% ] 21.47% | 8,290 | 2.5% |
[ 23.0% - 23.5% ] 23.11% | 7,703 | 2.8% |
[ 23.5% - 24.0% ] 23.82% | 14,553 | 5.8% |
[ 24.0% - 24.5% ] 24.22% | 2,849 | 5.4% |
[ 25.5% - 26.0% ] 25.78% | 26,684 | 9.2% |
[ 26.0% - 26.5% ] 26.36% | 1,157 | 2.8% |
[ 29.0% - 29.5% ] 29.42% | 15,489 | 7.9% |
[ 33.0% - 33.5% ] 33.47% | 487 | 7.8% |
[ 36.0% - 36.5% ] 36.22% | 8,892 | 8.2% |