Subsaharan African 4 or more Vehicles in Household
COMPARE
Subsaharan African
Select to Compare
4 or more Vehicles in Household
Subsaharan African 4 or more Vehicles in Household
5.7%
4+ VEHICLES AVAILABLE
2.1/ 100
METRIC RATING
252nd/ 347
METRIC RANK
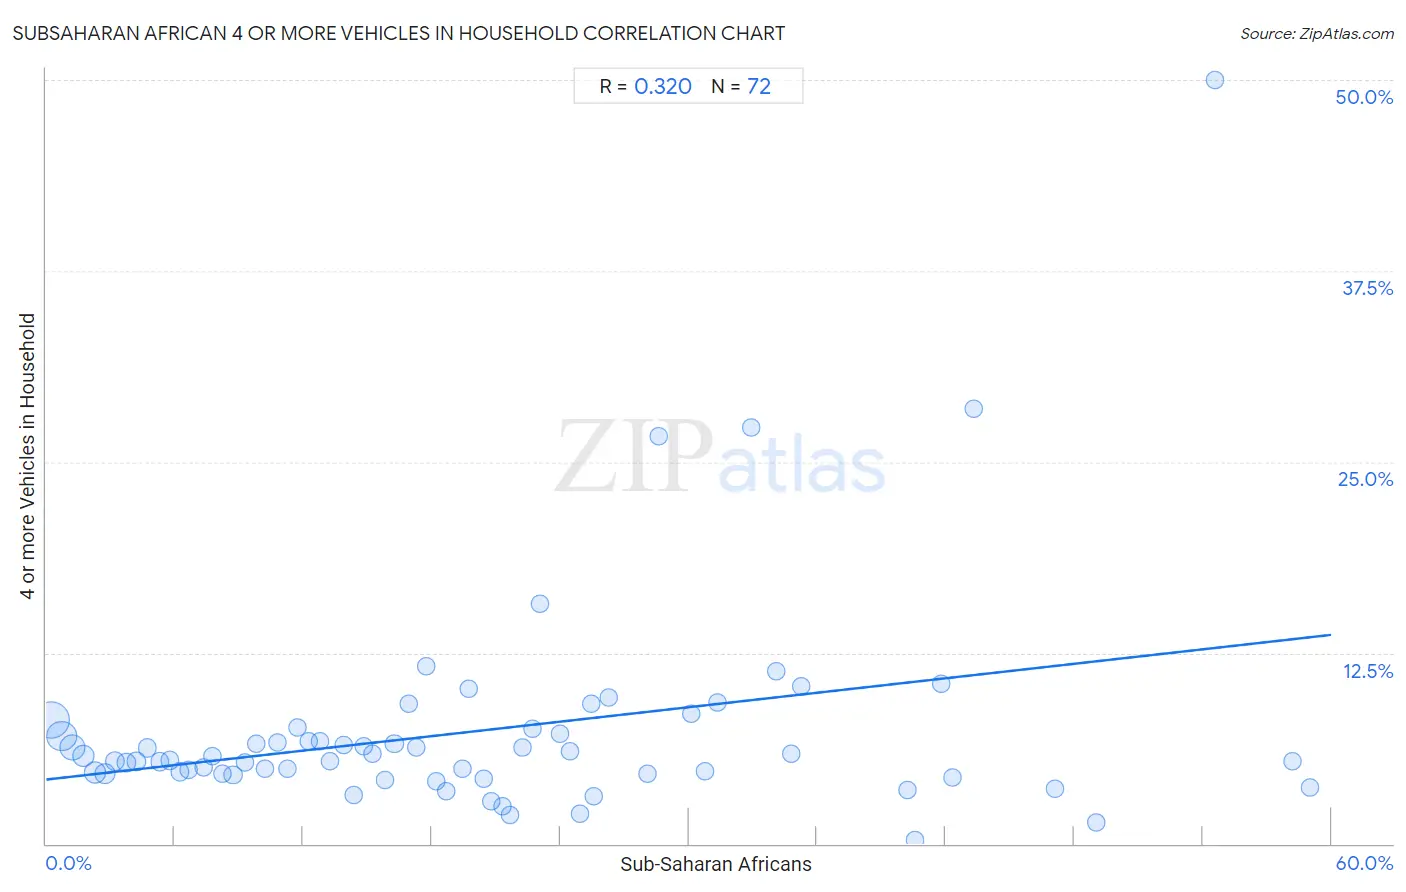
Subsaharan African 4 or more Vehicles in Household Correlation Chart
The statistical analysis conducted on geographies consisting of 505,333,507 people shows a mild positive correlation between the proportion of Sub-Saharan Africans and percentage of households with 4 or more vehicles available in the United States with a correlation coefficient (R) of 0.320 and weighted average of 5.7%. On average, for every 1% (one percent) increase in Sub-Saharan Africans within a typical geography, there is an increase of 0.16% in percentage of households with 4 or more vehicles available.
It is essential to understand that the correlation between the percentage of Sub-Saharan Africans and percentage of households with 4 or more vehicles available does not imply a direct cause-and-effect relationship. It remains uncertain whether the presence of Sub-Saharan Africans influences an upward or downward trend in the level of percentage of households with 4 or more vehicles available within an area, or if Sub-Saharan Africans simply ended up residing in those areas with higher or lower levels of percentage of households with 4 or more vehicles available due to other factors.
Demographics Similar to Sub-Saharan Africans by 4 or more Vehicles in Household
In terms of 4 or more vehicles in household, the demographic groups most similar to Sub-Saharan Africans are Ugandan (5.7%, a difference of 0.23%), Immigrants from Europe (5.7%, a difference of 0.25%), Immigrants from Southern Europe (5.7%, a difference of 0.35%), Immigrants from Eastern Africa (5.7%, a difference of 0.37%), and Immigrants from Ethiopia (5.7%, a difference of 0.48%).
| Demographics | Rating | Rank | 4 or more Vehicles in Household |
| Bulgarians | 3.1 /100 | #245 | Tragic 5.8% |
| Immigrants from North Macedonia | 2.5 /100 | #246 | Tragic 5.7% |
| Immigrants from Ethiopia | 2.4 /100 | #247 | Tragic 5.7% |
| Immigrants from Eastern Africa | 2.4 /100 | #248 | Tragic 5.7% |
| Immigrants from Southern Europe | 2.3 /100 | #249 | Tragic 5.7% |
| Immigrants from Europe | 2.3 /100 | #250 | Tragic 5.7% |
| Ugandans | 2.2 /100 | #251 | Tragic 5.7% |
| Sub-Saharan Africans | 2.1 /100 | #252 | Tragic 5.7% |
| Immigrants from Cuba | 1.6 /100 | #253 | Tragic 5.7% |
| Immigrants from Panama | 1.5 /100 | #254 | Tragic 5.7% |
| Yup'ik | 1.5 /100 | #255 | Tragic 5.7% |
| Immigrants from Turkey | 1.5 /100 | #256 | Tragic 5.7% |
| Immigrants from Northern Africa | 1.4 /100 | #257 | Tragic 5.6% |
| Immigrants from Lithuania | 1.4 /100 | #258 | Tragic 5.6% |
| Immigrants from France | 1.3 /100 | #259 | Tragic 5.6% |
Subsaharan African 4 or more Vehicles in Household Correlation Summary
| Measurement | Subsaharan African Data | 4 or more Vehicles in Household Data |
| Minimum | 0.24% | 0.25% |
| Maximum | 59.0% | 50.0% |
| Range | 58.8% | 49.8% |
| Mean | 20.3% | 7.4% |
| Median | 18.0% | 5.6% |
| Interquartile 25% (IQ1) | 9.0% | 4.6% |
| Interquartile 75% (IQ3) | 28.3% | 7.4% |
| Interquartile Range (IQR) | 19.3% | 2.8% |
| Standard Deviation (Sample) | 14.5% | 7.2% |
| Standard Deviation (Population) | 14.4% | 7.1% |
Correlation Details
| Subsaharan African Percentile | Sample Size | 4 or more Vehicles in Household |
[ 0.0% - 0.5% ] 0.24% | 171,964,923 | 8.1% |
[ 0.5% - 1.0% ] 0.72% | 106,404,376 | 7.1% |
[ 1.0% - 1.5% ] 1.24% | 70,316,039 | 6.3% |
[ 1.5% - 2.0% ] 1.73% | 40,973,404 | 5.8% |
[ 2.0% - 2.5% ] 2.25% | 34,212,787 | 4.6% |
[ 2.5% - 3.0% ] 2.73% | 23,301,346 | 4.6% |
[ 3.0% - 3.5% ] 3.23% | 13,041,997 | 5.4% |
[ 3.5% - 4.0% ] 3.75% | 9,198,275 | 5.3% |
[ 4.0% - 4.5% ] 4.22% | 8,812,931 | 5.4% |
[ 4.5% - 5.0% ] 4.71% | 4,025,481 | 6.3% |
[ 5.0% - 5.5% ] 5.29% | 3,716,806 | 5.4% |
[ 5.5% - 6.0% ] 5.77% | 3,279,526 | 5.4% |
[ 6.0% - 6.5% ] 6.26% | 2,184,489 | 4.7% |
[ 6.5% - 7.0% ] 6.65% | 2,481,465 | 4.9% |
[ 7.0% - 7.5% ] 7.34% | 1,463,648 | 5.0% |
[ 7.5% - 8.0% ] 7.73% | 1,493,789 | 5.7% |
[ 8.0% - 8.5% ] 8.23% | 972,400 | 4.6% |
[ 8.5% - 9.0% ] 8.72% | 984,781 | 4.5% |
[ 9.0% - 9.5% ] 9.27% | 862,542 | 5.3% |
[ 9.5% - 10.0% ] 9.79% | 407,703 | 6.6% |
[ 10.0% - 10.5% ] 10.21% | 719,499 | 4.9% |
[ 10.5% - 11.0% ] 10.78% | 526,330 | 6.6% |
[ 11.0% - 11.5% ] 11.27% | 652,278 | 4.9% |
[ 11.5% - 12.0% ] 11.75% | 277,758 | 7.6% |
[ 12.0% - 12.5% ] 12.27% | 100,779 | 6.7% |
[ 12.5% - 13.0% ] 12.77% | 181,236 | 6.7% |
[ 13.0% - 13.5% ] 13.23% | 438,825 | 5.4% |
[ 13.5% - 14.0% ] 13.92% | 340,538 | 6.4% |
[ 14.0% - 14.5% ] 14.38% | 83,868 | 3.2% |
[ 14.5% - 15.0% ] 14.81% | 134,427 | 6.3% |
[ 15.0% - 15.5% ] 15.22% | 236,677 | 5.9% |
[ 15.5% - 16.0% ] 15.84% | 211,309 | 4.2% |
[ 16.0% - 16.5% ] 16.25% | 194,158 | 6.6% |
[ 16.5% - 17.0% ] 16.91% | 26,439 | 9.2% |
[ 17.0% - 17.5% ] 17.26% | 142,684 | 6.3% |
[ 17.5% - 18.0% ] 17.73% | 65,899 | 11.6% |
[ 18.0% - 18.5% ] 18.20% | 218,635 | 4.1% |
[ 18.5% - 19.0% ] 18.66% | 97,301 | 3.4% |
[ 19.0% - 19.5% ] 19.43% | 243,304 | 4.9% |
[ 19.5% - 20.0% ] 19.74% | 19,739 | 10.2% |
[ 20.0% - 20.5% ] 20.42% | 36,013 | 4.3% |
[ 20.5% - 21.0% ] 20.76% | 26,108 | 2.8% |
[ 21.0% - 21.5% ] 21.30% | 28,219 | 2.5% |
[ 21.5% - 22.0% ] 21.65% | 54,260 | 1.9% |
[ 22.0% - 22.5% ] 22.26% | 283 | 6.3% |
[ 22.5% - 23.0% ] 22.71% | 51,871 | 7.5% |
[ 23.0% - 23.5% ] 23.08% | 208 | 15.7% |
[ 23.5% - 24.0% ] 23.99% | 14,553 | 7.2% |
[ 24.0% - 24.5% ] 24.43% | 25,424 | 6.0% |
[ 24.5% - 25.0% ] 24.91% | 273 | 2.0% |
[ 25.0% - 25.5% ] 25.47% | 267 | 9.2% |
[ 25.5% - 26.0% ] 25.54% | 881 | 3.1% |
[ 26.0% - 26.5% ] 26.24% | 2,069 | 9.6% |
[ 28.0% - 28.5% ] 28.06% | 29,898 | 4.6% |
[ 28.5% - 29.0% ] 28.57% | 154 | 26.7% |
[ 30.0% - 30.5% ] 30.14% | 2,037 | 8.5% |
[ 30.5% - 31.0% ] 30.74% | 15,489 | 4.8% |
[ 31.0% - 31.5% ] 31.35% | 2,485 | 9.3% |
[ 32.5% - 33.0% ] 32.93% | 334 | 27.3% |
[ 34.0% - 34.5% ] 34.07% | 3,824 | 11.3% |
[ 34.5% - 35.0% ] 34.78% | 46 | 5.9% |
[ 35.0% - 35.5% ] 35.23% | 1,286 | 10.3% |
[ 40.0% - 40.5% ] 40.22% | 4,572 | 3.6% |
[ 40.5% - 41.0% ] 40.56% | 9,613 | 0.25% |
[ 41.5% - 42.0% ] 41.76% | 613 | 10.4% |
[ 42.0% - 42.5% ] 42.31% | 338 | 4.3% |
[ 43.0% - 43.5% ] 43.29% | 633 | 28.5% |
[ 47.0% - 47.5% ] 47.10% | 1,157 | 3.6% |
[ 49.0% - 49.5% ] 49.02% | 9,074 | 1.4% |
[ 54.5% - 55.0% ] 54.55% | 11 | 50.0% |
[ 58.0% - 58.5% ] 58.19% | 574 | 5.4% |
[ 59.0% - 59.5% ] 59.02% | 549 | 3.7% |