Subsaharan African No Vehicles in Household
COMPARE
Subsaharan African
Select to Compare
No Vehicles in Household
Subsaharan African No Vehicles in Household
12.2%
NO VEHICLES AVAILABLE
0.6/ 100
METRIC RATING
261st/ 347
METRIC RANK
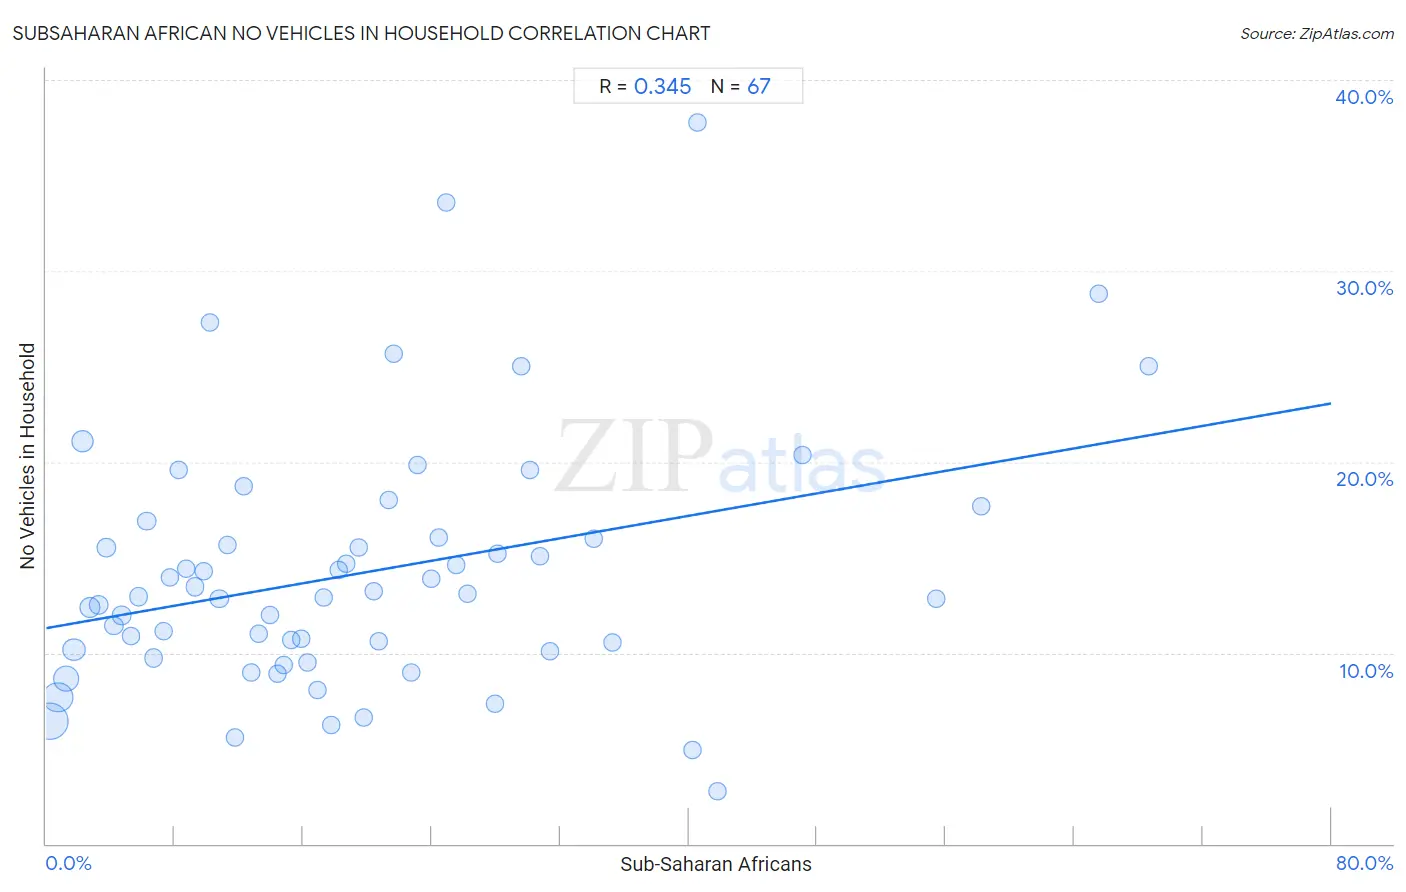
Subsaharan African No Vehicles in Household Correlation Chart
The statistical analysis conducted on geographies consisting of 506,014,655 people shows a mild positive correlation between the proportion of Sub-Saharan Africans and percentage of households with no vehicle available in the United States with a correlation coefficient (R) of 0.345 and weighted average of 12.2%. On average, for every 1% (one percent) increase in Sub-Saharan Africans within a typical geography, there is an increase of 0.15% in percentage of households with no vehicle available.
It is essential to understand that the correlation between the percentage of Sub-Saharan Africans and percentage of households with no vehicle available does not imply a direct cause-and-effect relationship. It remains uncertain whether the presence of Sub-Saharan Africans influences an upward or downward trend in the level of percentage of households with no vehicle available within an area, or if Sub-Saharan Africans simply ended up residing in those areas with higher or lower levels of percentage of households with no vehicle available due to other factors.
Demographics Similar to Sub-Saharan Africans by No Vehicles in Household
In terms of no vehicles in household, the demographic groups most similar to Sub-Saharan Africans are Immigrants from Liberia (12.2%, a difference of 0.070%), Immigrants from Egypt (12.2%, a difference of 0.22%), Macedonian (12.2%, a difference of 0.39%), Immigrants from Switzerland (12.3%, a difference of 0.69%), and African (12.3%, a difference of 0.93%).
| Demographics | Rating | Rank | No Vehicles in Household |
| Immigrants from Uruguay | 1.3 /100 | #254 | Tragic 11.9% |
| Hondurans | 1.2 /100 | #255 | Tragic 12.0% |
| Liberians | 1.2 /100 | #256 | Tragic 12.0% |
| Nigerians | 0.9 /100 | #257 | Tragic 12.1% |
| South American Indians | 0.9 /100 | #258 | Tragic 12.1% |
| Immigrants from Latvia | 0.8 /100 | #259 | Tragic 12.1% |
| Macedonians | 0.7 /100 | #260 | Tragic 12.2% |
| Sub-Saharan Africans | 0.6 /100 | #261 | Tragic 12.2% |
| Immigrants from Liberia | 0.6 /100 | #262 | Tragic 12.2% |
| Immigrants from Egypt | 0.6 /100 | #263 | Tragic 12.2% |
| Immigrants from Switzerland | 0.5 /100 | #264 | Tragic 12.3% |
| Africans | 0.4 /100 | #265 | Tragic 12.3% |
| Israelis | 0.3 /100 | #266 | Tragic 12.4% |
| Immigrants from Europe | 0.3 /100 | #267 | Tragic 12.5% |
| Immigrants from Africa | 0.2 /100 | #268 | Tragic 12.5% |
Subsaharan African No Vehicles in Household Correlation Summary
| Measurement | Subsaharan African Data | No Vehicles in Household Data |
| Minimum | 0.24% | 2.7% |
| Maximum | 68.6% | 37.8% |
| Range | 68.4% | 35.0% |
| Mean | 19.7% | 14.2% |
| Median | 16.9% | 12.9% |
| Interquartile 25% (IQ1) | 8.2% | 10.1% |
| Interquartile 75% (IQ3) | 26.2% | 16.0% |
| Interquartile Range (IQR) | 18.0% | 5.9% |
| Standard Deviation (Sample) | 15.4% | 6.6% |
| Standard Deviation (Population) | 15.3% | 6.5% |
Correlation Details
| Subsaharan African Percentile | Sample Size | No Vehicles in Household |
[ 0.0% - 0.5% ] 0.24% | 171,700,240 | 6.4% |
[ 0.5% - 1.0% ] 0.72% | 106,640,104 | 7.7% |
[ 1.0% - 1.5% ] 1.24% | 70,468,744 | 8.7% |
[ 1.5% - 2.0% ] 1.73% | 41,105,037 | 10.2% |
[ 2.0% - 2.5% ] 2.25% | 34,218,697 | 21.1% |
[ 2.5% - 3.0% ] 2.73% | 23,352,003 | 12.4% |
[ 3.0% - 3.5% ] 3.23% | 13,203,311 | 12.5% |
[ 3.5% - 4.0% ] 3.75% | 9,254,454 | 15.5% |
[ 4.0% - 4.5% ] 4.22% | 8,805,628 | 11.4% |
[ 4.5% - 5.0% ] 4.71% | 4,048,971 | 12.0% |
[ 5.0% - 5.5% ] 5.29% | 3,717,209 | 10.9% |
[ 5.5% - 6.0% ] 5.77% | 3,283,600 | 12.9% |
[ 6.0% - 6.5% ] 6.26% | 2,172,982 | 16.9% |
[ 6.5% - 7.0% ] 6.66% | 2,508,461 | 9.7% |
[ 7.0% - 7.5% ] 7.34% | 1,476,522 | 11.1% |
[ 7.5% - 8.0% ] 7.73% | 1,546,823 | 13.9% |
[ 8.0% - 8.5% ] 8.23% | 987,160 | 19.6% |
[ 8.5% - 9.0% ] 8.72% | 992,285 | 14.4% |
[ 9.0% - 9.5% ] 9.27% | 864,191 | 13.5% |
[ 9.5% - 10.0% ] 9.78% | 405,887 | 14.3% |
[ 10.0% - 10.5% ] 10.22% | 752,808 | 27.3% |
[ 10.5% - 11.0% ] 10.78% | 523,716 | 12.8% |
[ 11.0% - 11.5% ] 11.27% | 647,751 | 15.6% |
[ 11.5% - 12.0% ] 11.75% | 277,407 | 5.6% |
[ 12.0% - 12.5% ] 12.26% | 97,754 | 18.7% |
[ 12.5% - 13.0% ] 12.77% | 181,474 | 9.0% |
[ 13.0% - 13.5% ] 13.23% | 438,825 | 11.0% |
[ 13.5% - 14.0% ] 13.92% | 337,803 | 12.0% |
[ 14.0% - 14.5% ] 14.38% | 83,148 | 8.9% |
[ 14.5% - 15.0% ] 14.81% | 127,491 | 9.4% |
[ 15.0% - 15.5% ] 15.22% | 236,255 | 10.7% |
[ 15.5% - 16.0% ] 15.84% | 217,406 | 10.7% |
[ 16.0% - 16.5% ] 16.25% | 194,091 | 9.5% |
[ 16.5% - 17.0% ] 16.91% | 30,450 | 8.1% |
[ 17.0% - 17.5% ] 17.26% | 145,391 | 12.9% |
[ 17.5% - 18.0% ] 17.73% | 65,973 | 6.2% |
[ 18.0% - 18.5% ] 18.20% | 220,571 | 14.3% |
[ 18.5% - 19.0% ] 18.66% | 97,301 | 14.6% |
[ 19.0% - 19.5% ] 19.43% | 243,423 | 15.5% |
[ 19.5% - 20.0% ] 19.74% | 19,922 | 6.6% |
[ 20.0% - 20.5% ] 20.40% | 38,846 | 13.2% |
[ 20.5% - 21.0% ] 20.73% | 34,686 | 10.6% |
[ 21.0% - 21.5% ] 21.30% | 28,219 | 18.0% |
[ 21.5% - 22.0% ] 21.65% | 54,524 | 25.6% |
[ 22.5% - 23.0% ] 22.71% | 51,198 | 9.0% |
[ 23.0% - 23.5% ] 23.08% | 208 | 19.8% |
[ 23.5% - 24.0% ] 23.99% | 14,696 | 13.9% |
[ 24.0% - 24.5% ] 24.44% | 24,894 | 16.0% |
[ 24.5% - 25.0% ] 24.86% | 370 | 33.6% |
[ 25.5% - 26.0% ] 25.54% | 881 | 14.6% |
[ 26.0% - 26.5% ] 26.24% | 2,069 | 13.1% |
[ 27.5% - 28.0% ] 27.93% | 512 | 7.4% |
[ 28.0% - 28.5% ] 28.06% | 29,898 | 15.2% |
[ 29.5% - 30.0% ] 29.55% | 44 | 25.0% |
[ 30.0% - 30.5% ] 30.12% | 1,932 | 19.6% |
[ 30.5% - 31.0% ] 30.74% | 15,489 | 15.0% |
[ 31.0% - 31.5% ] 31.35% | 2,485 | 10.1% |
[ 34.0% - 34.5% ] 34.07% | 3,824 | 16.0% |
[ 35.0% - 35.5% ] 35.23% | 1,286 | 10.5% |
[ 40.0% - 40.5% ] 40.22% | 4,572 | 4.9% |
[ 40.5% - 41.0% ] 40.56% | 9,613 | 37.8% |
[ 41.5% - 42.0% ] 41.76% | 613 | 2.7% |
[ 47.0% - 47.5% ] 47.10% | 1,157 | 20.4% |
[ 55.0% - 55.5% ] 55.41% | 231 | 12.9% |
[ 58.0% - 58.5% ] 58.19% | 574 | 17.7% |
[ 65.5% - 66.0% ] 65.55% | 479 | 28.8% |
[ 68.5% - 69.0% ] 68.60% | 86 | 25.0% |