Subsaharan African Female Unemployment
COMPARE
Subsaharan African
Select to Compare
Female Unemployment
Subsaharan African Female Unemployment
5.7%
UNEMPLOYMENT | FEMALES
0.4/ 100
METRIC RATING
256th/ 347
METRIC RANK
Subsaharan African Female Unemployment Correlation Chart
The statistical analysis conducted on geographies consisting of 503,774,253 people shows a significant positive correlation between the proportion of Sub-Saharan Africans and unemploymnet rate among females in the United States with a correlation coefficient (R) of 0.606 and weighted average of 5.7%. On average, for every 1% (one percent) increase in Sub-Saharan Africans within a typical geography, there is an increase of 0.54% in unemploymnet rate among females.
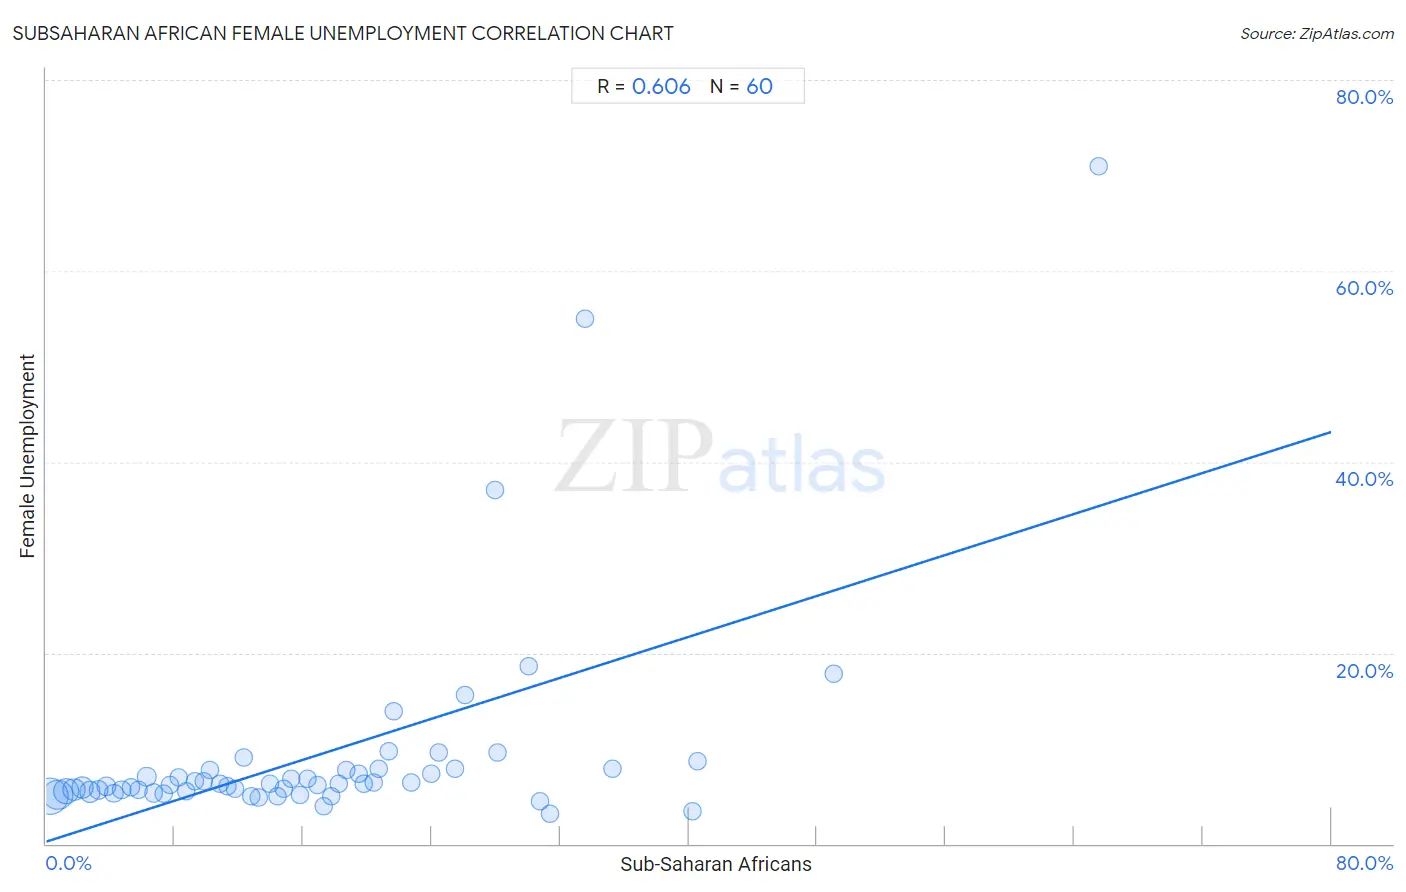
It is essential to understand that the correlation between the percentage of Sub-Saharan Africans and unemploymnet rate among females does not imply a direct cause-and-effect relationship. It remains uncertain whether the presence of Sub-Saharan Africans influences an upward or downward trend in the level of unemploymnet rate among females within an area, or if Sub-Saharan Africans simply ended up residing in those areas with higher or lower levels of unemploymnet rate among females due to other factors.
Demographics Similar to Sub-Saharan Africans by Female Unemployment
In terms of female unemployment, the demographic groups most similar to Sub-Saharan Africans are Dutch West Indian (5.7%, a difference of 0.070%), Immigrants from Cameroon (5.7%, a difference of 0.67%), Immigrants from Sierra Leone (5.7%, a difference of 0.71%), Immigrants (5.7%, a difference of 0.71%), and Cajun (5.7%, a difference of 0.85%).
| Demographics | Rating | Rank | Female Unemployment |
| Immigrants from Uzbekistan | 1.0 /100 | #249 | Tragic 5.6% |
| Immigrants from Syria | 0.8 /100 | #250 | Tragic 5.6% |
| Assyrians/Chaldeans/Syriacs | 0.8 /100 | #251 | Tragic 5.6% |
| Cajuns | 0.7 /100 | #252 | Tragic 5.7% |
| Immigrants from Sierra Leone | 0.6 /100 | #253 | Tragic 5.7% |
| Immigrants | 0.6 /100 | #254 | Tragic 5.7% |
| Immigrants from Cameroon | 0.6 /100 | #255 | Tragic 5.7% |
| Sub-Saharan Africans | 0.4 /100 | #256 | Tragic 5.7% |
| Dutch West Indians | 0.3 /100 | #257 | Tragic 5.7% |
| Immigrants from Portugal | 0.2 /100 | #258 | Tragic 5.8% |
| Immigrants from Fiji | 0.2 /100 | #259 | Tragic 5.8% |
| Nigerians | 0.2 /100 | #260 | Tragic 5.8% |
| Kiowa | 0.1 /100 | #261 | Tragic 5.8% |
| Immigrants from Nigeria | 0.1 /100 | #262 | Tragic 5.8% |
| Immigrants from the Azores | 0.1 /100 | #263 | Tragic 5.8% |
Subsaharan African Female Unemployment Correlation Summary
| Measurement | Subsaharan African Data | Female Unemployment Data |
| Minimum | 0.24% | 3.1% |
| Maximum | 65.6% | 71.0% |
| Range | 65.3% | 67.9% |
| Mean | 17.0% | 9.3% |
| Median | 15.0% | 6.2% |
| Interquartile 25% (IQ1) | 7.5% | 5.5% |
| Interquartile 75% (IQ3) | 23.3% | 7.8% |
| Interquartile Range (IQR) | 15.8% | 2.3% |
| Standard Deviation (Sample) | 12.7% | 11.3% |
| Standard Deviation (Population) | 12.6% | 11.2% |
Correlation Details
| Subsaharan African Percentile | Sample Size | Female Unemployment |
[ 0.0% - 0.5% ] 0.24% | 170,554,775 | 4.9% |
[ 0.5% - 1.0% ] 0.72% | 106,116,459 | 5.2% |
[ 1.0% - 1.5% ] 1.24% | 70,278,307 | 5.5% |
[ 1.5% - 2.0% ] 1.73% | 41,007,763 | 5.7% |
[ 2.0% - 2.5% ] 2.25% | 34,117,949 | 5.9% |
[ 2.5% - 3.0% ] 2.73% | 23,309,998 | 5.4% |
[ 3.0% - 3.5% ] 3.23% | 13,151,308 | 5.6% |
[ 3.5% - 4.0% ] 3.75% | 9,249,209 | 6.1% |
[ 4.0% - 4.5% ] 4.22% | 8,797,977 | 5.3% |
[ 4.5% - 5.0% ] 4.71% | 4,036,123 | 5.7% |
[ 5.0% - 5.5% ] 5.29% | 3,740,228 | 5.9% |
[ 5.5% - 6.0% ] 5.77% | 3,259,760 | 5.6% |
[ 6.0% - 6.5% ] 6.26% | 2,187,270 | 7.0% |
[ 6.5% - 7.0% ] 6.66% | 2,507,524 | 5.3% |
[ 7.0% - 7.5% ] 7.34% | 1,463,686 | 5.3% |
[ 7.5% - 8.0% ] 7.73% | 1,535,138 | 6.2% |
[ 8.0% - 8.5% ] 8.23% | 979,112 | 7.0% |
[ 8.5% - 9.0% ] 8.72% | 986,164 | 5.5% |
[ 9.0% - 9.5% ] 9.27% | 862,618 | 6.6% |
[ 9.5% - 10.0% ] 9.78% | 409,663 | 6.5% |
[ 10.0% - 10.5% ] 10.22% | 743,101 | 7.8% |
[ 10.5% - 11.0% ] 10.78% | 520,297 | 6.2% |
[ 11.0% - 11.5% ] 11.27% | 641,802 | 6.1% |
[ 11.5% - 12.0% ] 11.74% | 272,451 | 5.8% |
[ 12.0% - 12.5% ] 12.27% | 98,655 | 9.0% |
[ 12.5% - 13.0% ] 12.77% | 181,088 | 5.0% |
[ 13.0% - 13.5% ] 13.23% | 435,801 | 4.9% |
[ 13.5% - 14.0% ] 13.92% | 338,434 | 6.2% |
[ 14.0% - 14.5% ] 14.38% | 83,148 | 5.0% |
[ 14.5% - 15.0% ] 14.82% | 131,246 | 5.7% |
[ 15.0% - 15.5% ] 15.22% | 232,562 | 6.8% |
[ 15.5% - 16.0% ] 15.83% | 211,539 | 5.1% |
[ 16.0% - 16.5% ] 16.25% | 194,091 | 6.8% |
[ 16.5% - 17.0% ] 16.91% | 29,053 | 6.1% |
[ 17.0% - 17.5% ] 17.26% | 145,391 | 3.9% |
[ 17.5% - 18.0% ] 17.73% | 64,257 | 5.0% |
[ 18.0% - 18.5% ] 18.20% | 218,635 | 6.3% |
[ 18.5% - 19.0% ] 18.66% | 97,301 | 7.7% |
[ 19.0% - 19.5% ] 19.43% | 243,201 | 7.3% |
[ 19.5% - 20.0% ] 19.74% | 19,112 | 6.2% |
[ 20.0% - 20.5% ] 20.40% | 38,685 | 6.4% |
[ 20.5% - 21.0% ] 20.73% | 34,686 | 7.9% |
[ 21.0% - 21.5% ] 21.30% | 28,219 | 9.7% |
[ 21.5% - 22.0% ] 21.65% | 54,260 | 13.9% |
[ 22.5% - 23.0% ] 22.71% | 50,775 | 6.4% |
[ 23.5% - 24.0% ] 23.99% | 14,553 | 7.3% |
[ 24.0% - 24.5% ] 24.44% | 24,795 | 9.5% |
[ 25.0% - 25.5% ] 25.47% | 267 | 7.8% |
[ 26.0% - 26.5% ] 26.04% | 987 | 15.6% |
[ 27.5% - 28.0% ] 27.93% | 512 | 37.0% |
[ 28.0% - 28.5% ] 28.06% | 29,898 | 9.6% |
[ 30.0% - 30.5% ] 30.05% | 1,431 | 18.6% |
[ 30.5% - 31.0% ] 30.74% | 15,489 | 4.5% |
[ 31.0% - 31.5% ] 31.35% | 2,485 | 3.1% |
[ 33.5% - 34.0% ] 33.53% | 173 | 55.0% |
[ 35.0% - 35.5% ] 35.23% | 1,286 | 7.9% |
[ 40.0% - 40.5% ] 40.22% | 4,572 | 3.4% |
[ 40.5% - 41.0% ] 40.56% | 9,613 | 8.6% |
[ 49.0% - 49.5% ] 49.01% | 8,892 | 17.8% |
[ 65.5% - 66.0% ] 65.55% | 479 | 71.0% |