Subsaharan African Disability Age 18 to 34
COMPARE
Subsaharan African
Select to Compare
Disability Age 18 to 34
Subsaharan African Disability Age 18 to 34
7.1%
DISABILITY | AGE 18 TO 34
1.7/ 100
METRIC RATING
235th/ 347
METRIC RANK
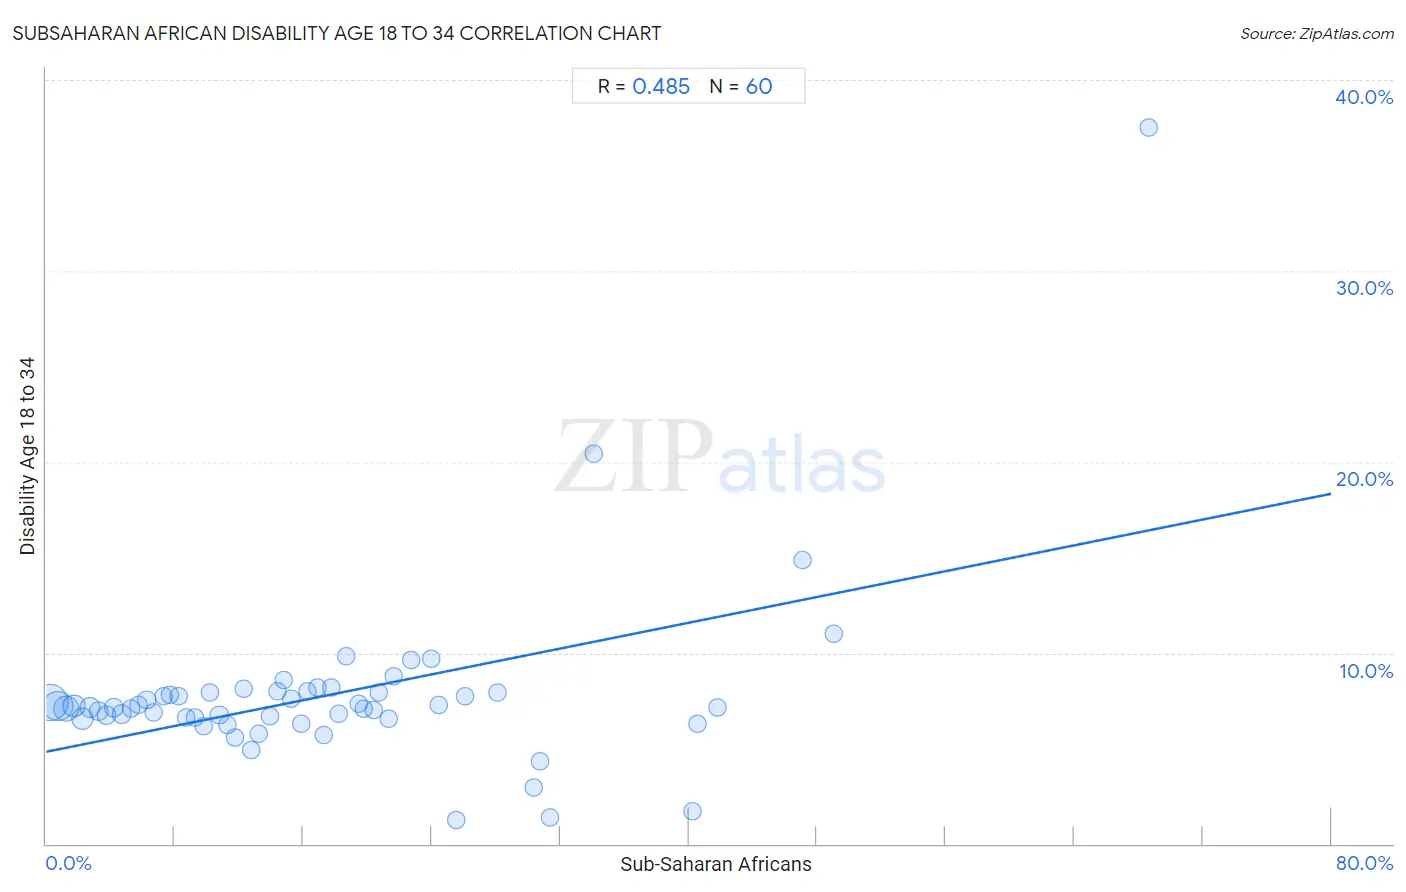
Subsaharan African Disability Age 18 to 34 Correlation Chart
The statistical analysis conducted on geographies consisting of 506,334,183 people shows a moderate positive correlation between the proportion of Sub-Saharan Africans and percentage of population with a disability between the ages 18 and 35 in the United States with a correlation coefficient (R) of 0.485 and weighted average of 7.1%. On average, for every 1% (one percent) increase in Sub-Saharan Africans within a typical geography, there is an increase of 0.17% in percentage of population with a disability between the ages 18 and 35.
It is essential to understand that the correlation between the percentage of Sub-Saharan Africans and percentage of population with a disability between the ages 18 and 35 does not imply a direct cause-and-effect relationship. It remains uncertain whether the presence of Sub-Saharan Africans influences an upward or downward trend in the level of percentage of population with a disability between the ages 18 and 35 within an area, or if Sub-Saharan Africans simply ended up residing in those areas with higher or lower levels of percentage of population with a disability between the ages 18 and 35 due to other factors.
Demographics Similar to Sub-Saharan Africans by Disability Age 18 to 34
In terms of disability age 18 to 34, the demographic groups most similar to Sub-Saharan Africans are Liberian (7.1%, a difference of 0.25%), Alsatian (7.0%, a difference of 0.37%), Austrian (7.1%, a difference of 0.42%), Marshallese (7.1%, a difference of 0.47%), and Italian (7.1%, a difference of 0.58%).
| Demographics | Rating | Rank | Disability Age 18 to 34 |
| Immigrants from Yemen | 4.2 /100 | #228 | Tragic 7.0% |
| Lithuanians | 4.1 /100 | #229 | Tragic 7.0% |
| Immigrants from North America | 3.9 /100 | #230 | Tragic 7.0% |
| Ute | 3.8 /100 | #231 | Tragic 7.0% |
| Samoans | 3.2 /100 | #232 | Tragic 7.0% |
| New Zealanders | 2.7 /100 | #233 | Tragic 7.0% |
| Alsatians | 2.1 /100 | #234 | Tragic 7.0% |
| Sub-Saharan Africans | 1.7 /100 | #235 | Tragic 7.1% |
| Liberians | 1.5 /100 | #236 | Tragic 7.1% |
| Austrians | 1.3 /100 | #237 | Tragic 7.1% |
| Marshallese | 1.3 /100 | #238 | Tragic 7.1% |
| Italians | 1.2 /100 | #239 | Tragic 7.1% |
| Arapaho | 1.1 /100 | #240 | Tragic 7.1% |
| Nepalese | 1.1 /100 | #241 | Tragic 7.1% |
| Immigrants from Congo | 1.1 /100 | #242 | Tragic 7.1% |
Subsaharan African Disability Age 18 to 34 Correlation Summary
| Measurement | Subsaharan African Data | Disability Age 18 to 34 Data |
| Minimum | 0.24% | 1.2% |
| Maximum | 68.6% | 37.5% |
| Range | 68.4% | 36.3% |
| Mean | 17.5% | 7.8% |
| Median | 15.0% | 7.1% |
| Interquartile 25% (IQ1) | 7.5% | 6.6% |
| Interquartile 75% (IQ3) | 23.3% | 7.9% |
| Interquartile Range (IQR) | 15.8% | 1.4% |
| Standard Deviation (Sample) | 13.6% | 4.7% |
| Standard Deviation (Population) | 13.5% | 4.7% |
Correlation Details
| Subsaharan African Percentile | Sample Size | Disability Age 18 to 34 |
[ 0.0% - 0.5% ] 0.24% | 171,871,124 | 7.4% |
[ 0.5% - 1.0% ] 0.72% | 106,581,728 | 7.2% |
[ 1.0% - 1.5% ] 1.24% | 70,536,512 | 7.1% |
[ 1.5% - 2.0% ] 1.73% | 41,154,385 | 7.2% |
[ 2.0% - 2.5% ] 2.25% | 34,235,510 | 6.5% |
[ 2.5% - 3.0% ] 2.73% | 23,371,873 | 7.1% |
[ 3.0% - 3.5% ] 3.23% | 13,216,724 | 7.0% |
[ 3.5% - 4.0% ] 3.75% | 9,271,566 | 6.7% |
[ 4.0% - 4.5% ] 4.22% | 8,832,666 | 7.1% |
[ 4.5% - 5.0% ] 4.71% | 4,036,155 | 6.8% |
[ 5.0% - 5.5% ] 5.29% | 3,748,225 | 7.1% |
[ 5.5% - 6.0% ] 5.77% | 3,286,163 | 7.3% |
[ 6.0% - 6.5% ] 6.26% | 2,172,345 | 7.6% |
[ 6.5% - 7.0% ] 6.66% | 2,504,733 | 6.9% |
[ 7.0% - 7.5% ] 7.34% | 1,478,353 | 7.7% |
[ 7.5% - 8.0% ] 7.73% | 1,545,275 | 7.8% |
[ 8.0% - 8.5% ] 8.23% | 981,433 | 7.7% |
[ 8.5% - 9.0% ] 8.72% | 990,562 | 6.6% |
[ 9.0% - 9.5% ] 9.27% | 850,111 | 6.6% |
[ 9.5% - 10.0% ] 9.78% | 406,940 | 6.1% |
[ 10.0% - 10.5% ] 10.22% | 749,327 | 7.9% |
[ 10.5% - 11.0% ] 10.78% | 528,491 | 6.7% |
[ 11.0% - 11.5% ] 11.27% | 651,931 | 6.2% |
[ 11.5% - 12.0% ] 11.74% | 274,085 | 5.6% |
[ 12.0% - 12.5% ] 12.27% | 100,019 | 8.1% |
[ 12.5% - 13.0% ] 12.77% | 185,624 | 4.9% |
[ 13.0% - 13.5% ] 13.23% | 435,801 | 5.8% |
[ 13.5% - 14.0% ] 13.92% | 338,103 | 6.7% |
[ 14.0% - 14.5% ] 14.38% | 83,590 | 8.0% |
[ 14.5% - 15.0% ] 14.81% | 132,758 | 8.6% |
[ 15.0% - 15.5% ] 15.22% | 231,407 | 7.6% |
[ 15.5% - 16.0% ] 15.84% | 216,223 | 6.3% |
[ 16.0% - 16.5% ] 16.25% | 194,429 | 8.0% |
[ 16.5% - 17.0% ] 16.92% | 28,538 | 8.2% |
[ 17.0% - 17.5% ] 17.26% | 145,391 | 5.7% |
[ 17.5% - 18.0% ] 17.73% | 65,973 | 8.2% |
[ 18.0% - 18.5% ] 18.20% | 220,571 | 6.8% |
[ 18.5% - 19.0% ] 18.66% | 97,301 | 9.8% |
[ 19.0% - 19.5% ] 19.43% | 243,201 | 7.3% |
[ 19.5% - 20.0% ] 19.74% | 19,112 | 7.1% |
[ 20.0% - 20.5% ] 20.40% | 38,071 | 7.0% |
[ 20.5% - 21.0% ] 20.73% | 34,807 | 7.9% |
[ 21.0% - 21.5% ] 21.32% | 25,224 | 6.5% |
[ 21.5% - 22.0% ] 21.64% | 52,440 | 8.8% |
[ 22.5% - 23.0% ] 22.71% | 50,932 | 9.6% |
[ 23.5% - 24.0% ] 23.99% | 14,553 | 9.7% |
[ 24.0% - 24.5% ] 24.44% | 24,795 | 7.3% |
[ 25.5% - 26.0% ] 25.54% | 881 | 1.2% |
[ 26.0% - 26.5% ] 26.04% | 987 | 7.7% |
[ 28.0% - 28.5% ] 28.06% | 29,898 | 8.0% |
[ 30.0% - 30.5% ] 30.36% | 606 | 3.0% |
[ 30.5% - 31.0% ] 30.74% | 15,489 | 4.3% |
[ 31.0% - 31.5% ] 31.35% | 2,485 | 1.4% |
[ 34.0% - 34.5% ] 34.07% | 3,824 | 20.4% |
[ 40.0% - 40.5% ] 40.22% | 4,572 | 1.7% |
[ 40.5% - 41.0% ] 40.56% | 9,613 | 6.3% |
[ 41.5% - 42.0% ] 41.76% | 613 | 7.1% |
[ 47.0% - 47.5% ] 47.10% | 1,157 | 14.9% |
[ 49.0% - 49.5% ] 49.01% | 8,892 | 11.0% |
[ 68.5% - 69.0% ] 68.60% | 86 | 37.5% |