Subsaharan African Vision Disability
COMPARE
Subsaharan African
Select to Compare
Vision Disability
Subsaharan African Vision Disability
2.3%
VISION DISABILITY
0.5/ 100
METRIC RATING
248th/ 347
METRIC RANK
Subsaharan African Vision Disability Correlation Chart
The statistical analysis conducted on geographies consisting of 507,474,731 people shows a weak positive correlation between the proportion of Sub-Saharan Africans and percentage of population with vision disability in the United States with a correlation coefficient (R) of 0.288 and weighted average of 2.3%. On average, for every 1% (one percent) increase in Sub-Saharan Africans within a typical geography, there is an increase of 0.032% in percentage of population with vision disability.
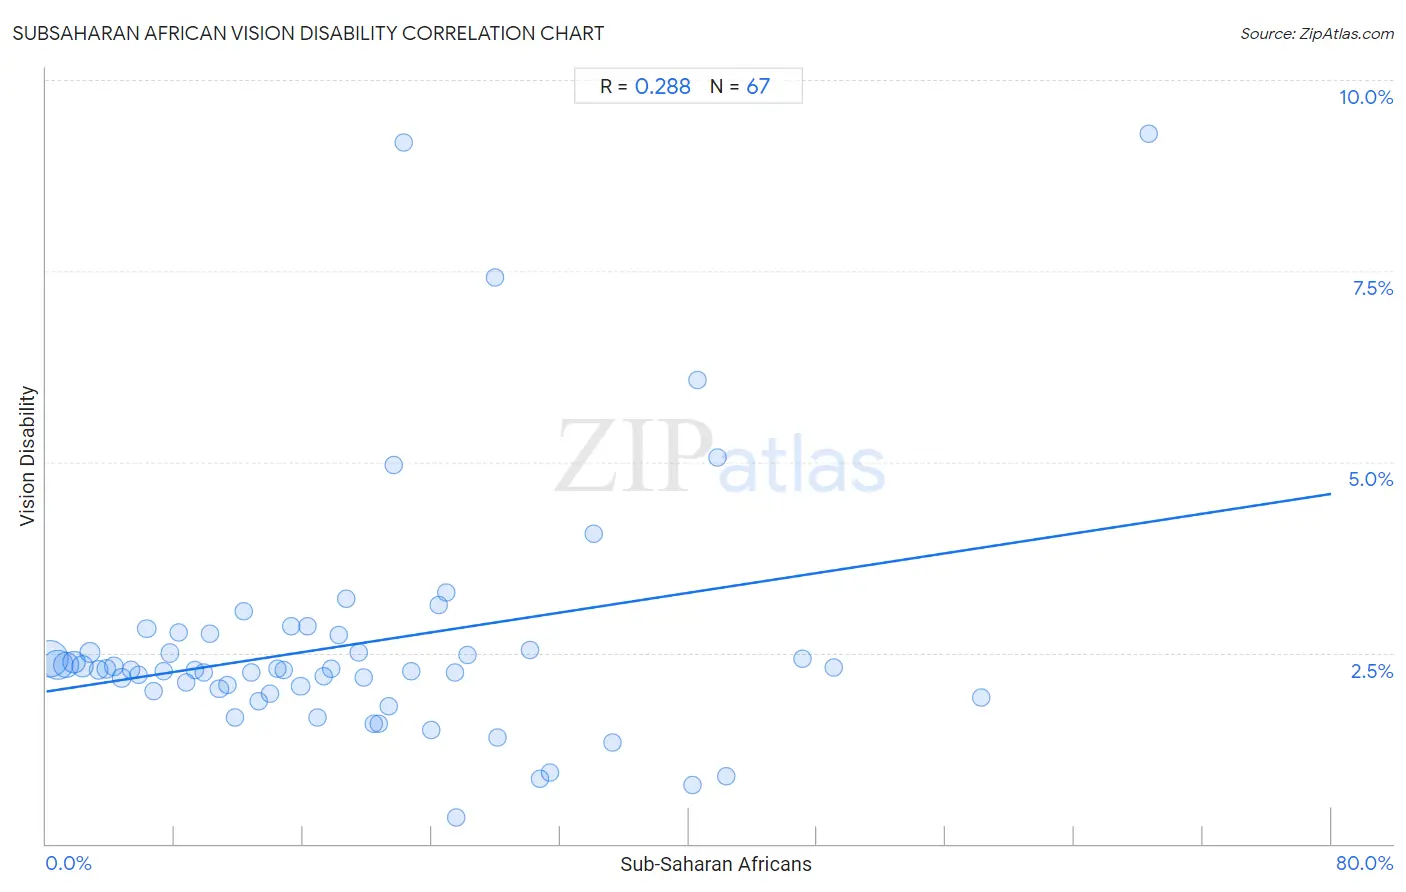
It is essential to understand that the correlation between the percentage of Sub-Saharan Africans and percentage of population with vision disability does not imply a direct cause-and-effect relationship. It remains uncertain whether the presence of Sub-Saharan Africans influences an upward or downward trend in the level of percentage of population with vision disability within an area, or if Sub-Saharan Africans simply ended up residing in those areas with higher or lower levels of percentage of population with vision disability due to other factors.
Demographics Similar to Sub-Saharan Africans by Vision Disability
In terms of vision disability, the demographic groups most similar to Sub-Saharan Africans are Liberian (2.3%, a difference of 0.010%), Guatemalan (2.3%, a difference of 0.020%), French (2.3%, a difference of 0.060%), Bangladeshi (2.3%, a difference of 0.10%), and Alsatian (2.3%, a difference of 0.21%).
| Demographics | Rating | Rank | Vision Disability |
| Malaysians | 0.9 /100 | #241 | Tragic 2.3% |
| Immigrants from Panama | 0.8 /100 | #242 | Tragic 2.3% |
| Immigrants from Nicaragua | 0.6 /100 | #243 | Tragic 2.3% |
| Immigrants from West Indies | 0.6 /100 | #244 | Tragic 2.3% |
| Alsatians | 0.6 /100 | #245 | Tragic 2.3% |
| French | 0.5 /100 | #246 | Tragic 2.3% |
| Guatemalans | 0.5 /100 | #247 | Tragic 2.3% |
| Sub-Saharan Africans | 0.5 /100 | #248 | Tragic 2.3% |
| Liberians | 0.5 /100 | #249 | Tragic 2.3% |
| Bangladeshis | 0.5 /100 | #250 | Tragic 2.3% |
| Immigrants from Laos | 0.4 /100 | #251 | Tragic 2.4% |
| Immigrants from Micronesia | 0.3 /100 | #252 | Tragic 2.4% |
| Japanese | 0.3 /100 | #253 | Tragic 2.4% |
| Haitians | 0.3 /100 | #254 | Tragic 2.4% |
| Immigrants from Guatemala | 0.3 /100 | #255 | Tragic 2.4% |
Subsaharan African Vision Disability Correlation Summary
| Measurement | Subsaharan African Data | Vision Disability Data |
| Minimum | 0.24% | 0.34% |
| Maximum | 68.6% | 9.3% |
| Range | 68.4% | 9.0% |
| Mean | 19.2% | 2.6% |
| Median | 16.9% | 2.3% |
| Interquartile 25% (IQ1) | 8.2% | 2.0% |
| Interquartile 75% (IQ3) | 25.5% | 2.7% |
| Interquartile Range (IQR) | 17.3% | 0.74% |
| Standard Deviation (Sample) | 14.3% | 1.6% |
| Standard Deviation (Population) | 14.2% | 1.6% |
Correlation Details
| Subsaharan African Percentile | Sample Size | Vision Disability |
[ 0.0% - 0.5% ] 0.24% | 172,321,778 | 2.4% |
[ 0.5% - 1.0% ] 0.72% | 106,883,306 | 2.3% |
[ 1.0% - 1.5% ] 1.24% | 70,666,699 | 2.3% |
[ 1.5% - 2.0% ] 1.73% | 41,213,552 | 2.4% |
[ 2.0% - 2.5% ] 2.25% | 34,272,497 | 2.3% |
[ 2.5% - 3.0% ] 2.73% | 23,388,811 | 2.5% |
[ 3.0% - 3.5% ] 3.23% | 13,233,551 | 2.3% |
[ 3.5% - 4.0% ] 3.75% | 9,283,797 | 2.3% |
[ 4.0% - 4.5% ] 4.22% | 8,823,584 | 2.3% |
[ 4.5% - 5.0% ] 4.71% | 4,057,121 | 2.2% |
[ 5.0% - 5.5% ] 5.29% | 3,766,036 | 2.3% |
[ 5.5% - 6.0% ] 5.77% | 3,278,592 | 2.2% |
[ 6.0% - 6.5% ] 6.26% | 2,181,772 | 2.8% |
[ 6.5% - 7.0% ] 6.66% | 2,511,951 | 2.0% |
[ 7.0% - 7.5% ] 7.34% | 1,486,307 | 2.3% |
[ 7.5% - 8.0% ] 7.73% | 1,545,486 | 2.5% |
[ 8.0% - 8.5% ] 8.23% | 984,516 | 2.8% |
[ 8.5% - 9.0% ] 8.72% | 992,909 | 2.1% |
[ 9.0% - 9.5% ] 9.27% | 870,159 | 2.3% |
[ 9.5% - 10.0% ] 9.78% | 411,142 | 2.2% |
[ 10.0% - 10.5% ] 10.22% | 752,597 | 2.7% |
[ 10.5% - 11.0% ] 10.78% | 530,320 | 2.0% |
[ 11.0% - 11.5% ] 11.27% | 652,030 | 2.1% |
[ 11.5% - 12.0% ] 11.75% | 279,205 | 1.6% |
[ 12.0% - 12.5% ] 12.27% | 100,580 | 3.0% |
[ 12.5% - 13.0% ] 12.77% | 184,651 | 2.2% |
[ 13.0% - 13.5% ] 13.23% | 438,825 | 1.9% |
[ 13.5% - 14.0% ] 13.91% | 341,661 | 2.0% |
[ 14.0% - 14.5% ] 14.38% | 83,868 | 2.3% |
[ 14.5% - 15.0% ] 14.81% | 134,427 | 2.3% |
[ 15.0% - 15.5% ] 15.22% | 236,255 | 2.9% |
[ 15.5% - 16.0% ] 15.84% | 217,851 | 2.1% |
[ 16.0% - 16.5% ] 16.25% | 194,429 | 2.9% |
[ 16.5% - 17.0% ] 16.91% | 29,350 | 1.7% |
[ 17.0% - 17.5% ] 17.26% | 145,391 | 2.2% |
[ 17.5% - 18.0% ] 17.73% | 65,973 | 2.3% |
[ 18.0% - 18.5% ] 18.20% | 220,571 | 2.7% |
[ 18.5% - 19.0% ] 18.66% | 97,301 | 3.2% |
[ 19.0% - 19.5% ] 19.43% | 243,304 | 2.5% |
[ 19.5% - 20.0% ] 19.75% | 19,057 | 2.2% |
[ 20.0% - 20.5% ] 20.40% | 38,685 | 1.6% |
[ 20.5% - 21.0% ] 20.73% | 34,710 | 1.6% |
[ 21.0% - 21.5% ] 21.30% | 28,219 | 1.8% |
[ 21.5% - 22.0% ] 21.65% | 54,524 | 5.0% |
[ 22.0% - 22.5% ] 22.26% | 283 | 9.2% |
[ 22.5% - 23.0% ] 22.71% | 52,239 | 2.3% |
[ 23.5% - 24.0% ] 23.99% | 14,696 | 1.5% |
[ 24.0% - 24.5% ] 24.43% | 25,333 | 3.1% |
[ 24.5% - 25.0% ] 24.91% | 273 | 3.3% |
[ 25.0% - 25.5% ] 25.47% | 267 | 2.2% |
[ 25.5% - 26.0% ] 25.54% | 881 | 0.34% |
[ 26.0% - 26.5% ] 26.24% | 2,138 | 2.5% |
[ 27.5% - 28.0% ] 27.93% | 512 | 7.4% |
[ 28.0% - 28.5% ] 28.06% | 29,898 | 1.4% |
[ 30.0% - 30.5% ] 30.12% | 1,932 | 2.5% |
[ 30.5% - 31.0% ] 30.74% | 15,489 | 0.85% |
[ 31.0% - 31.5% ] 31.35% | 2,485 | 0.93% |
[ 34.0% - 34.5% ] 34.07% | 3,824 | 4.1% |
[ 35.0% - 35.5% ] 35.23% | 1,286 | 1.3% |
[ 40.0% - 40.5% ] 40.22% | 4,572 | 0.77% |
[ 40.5% - 41.0% ] 40.56% | 9,613 | 6.1% |
[ 41.5% - 42.0% ] 41.76% | 613 | 5.1% |
[ 42.0% - 42.5% ] 42.31% | 338 | 0.89% |
[ 47.0% - 47.5% ] 47.10% | 1,157 | 2.4% |
[ 49.0% - 49.5% ] 49.01% | 8,892 | 2.3% |
[ 58.0% - 58.5% ] 58.19% | 574 | 1.9% |
[ 68.5% - 69.0% ] 68.60% | 86 | 9.3% |