Subsaharan African Median Family Income
COMPARE
Subsaharan African
Select to Compare
Median Family Income
Subsaharan African Median Family Income
$93,748
FAMILY INCOME
1.0/ 100
METRIC RATING
244th/ 347
METRIC RANK
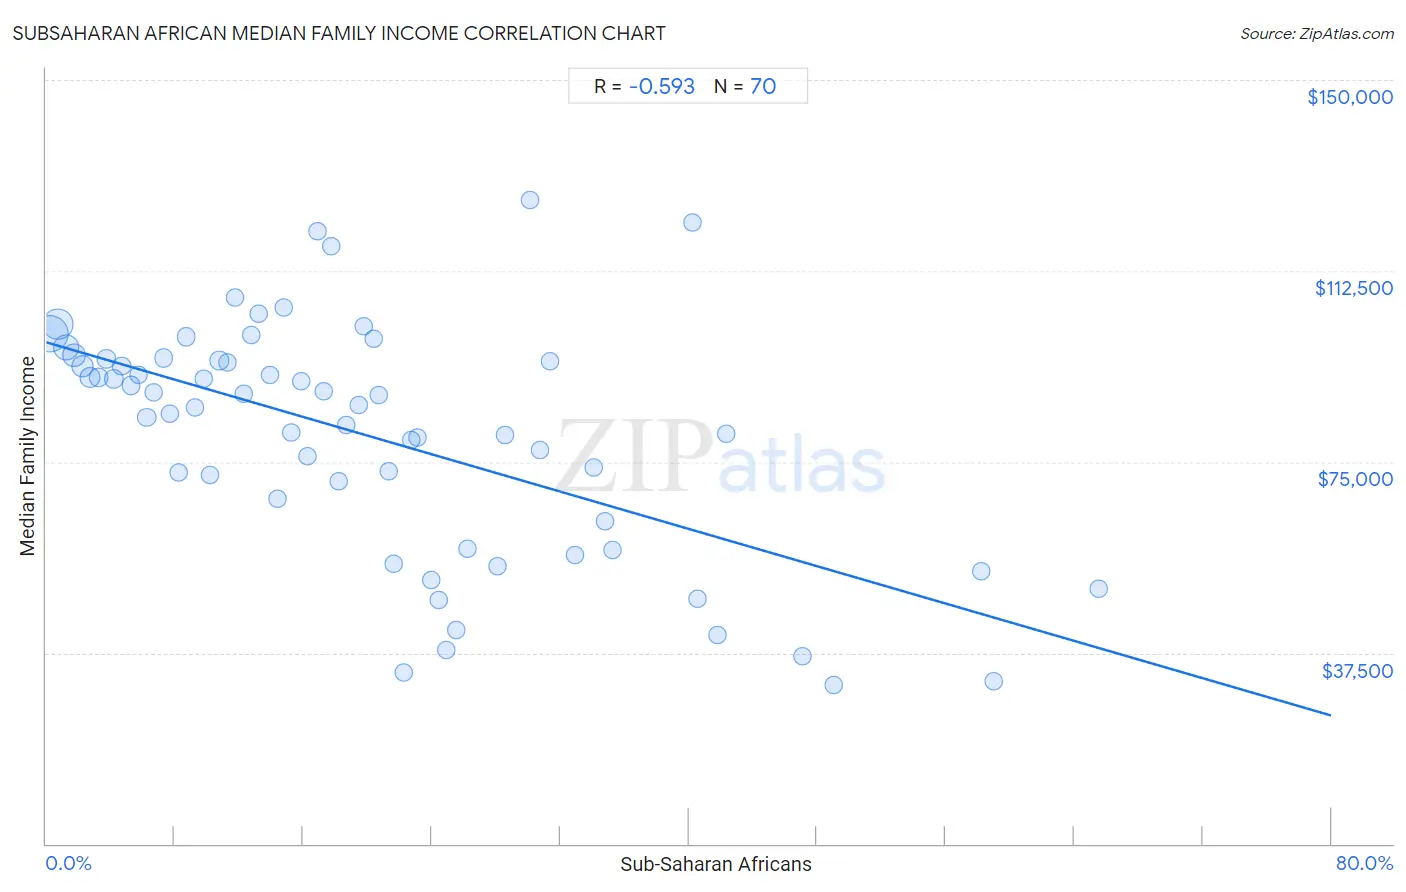
Subsaharan African Median Family Income Correlation Chart
The statistical analysis conducted on geographies consisting of 507,233,451 people shows a substantial negative correlation between the proportion of Sub-Saharan Africans and median family income in the United States with a correlation coefficient (R) of -0.593 and weighted average of $93,748. On average, for every 1% (one percent) increase in Sub-Saharan Africans within a typical geography, there is a decrease of $916 in median family income.
It is essential to understand that the correlation between the percentage of Sub-Saharan Africans and median family income does not imply a direct cause-and-effect relationship. It remains uncertain whether the presence of Sub-Saharan Africans influences an upward or downward trend in the level of median family income within an area, or if Sub-Saharan Africans simply ended up residing in those areas with higher or lower levels of median family income due to other factors.
Demographics Similar to Sub-Saharan Africans by Median Family Income
In terms of median family income, the demographic groups most similar to Sub-Saharan Africans are German Russian ($93,858, a difference of 0.12%), Immigrants from Middle Africa ($93,593, a difference of 0.17%), Barbadian ($93,919, a difference of 0.18%), Immigrants from Trinidad and Tobago ($93,988, a difference of 0.26%), and Somali ($94,085, a difference of 0.36%).
| Demographics | Rating | Rank | Median Family Income |
| Alaskan Athabascans | 1.5 /100 | #237 | Tragic $94,429 |
| Nepalese | 1.3 /100 | #238 | Tragic $94,153 |
| Salvadorans | 1.2 /100 | #239 | Tragic $94,109 |
| Somalis | 1.2 /100 | #240 | Tragic $94,085 |
| Immigrants from Trinidad and Tobago | 1.2 /100 | #241 | Tragic $93,988 |
| Barbadians | 1.1 /100 | #242 | Tragic $93,919 |
| German Russians | 1.1 /100 | #243 | Tragic $93,858 |
| Sub-Saharan Africans | 1.0 /100 | #244 | Tragic $93,748 |
| Immigrants from Middle Africa | 1.0 /100 | #245 | Tragic $93,593 |
| Guyanese | 0.9 /100 | #246 | Tragic $93,373 |
| Immigrants from Senegal | 0.7 /100 | #247 | Tragic $92,912 |
| French American Indians | 0.7 /100 | #248 | Tragic $92,872 |
| Immigrants from Ecuador | 0.7 /100 | #249 | Tragic $92,837 |
| West Indians | 0.6 /100 | #250 | Tragic $92,765 |
| Immigrants from Somalia | 0.6 /100 | #251 | Tragic $92,609 |
Subsaharan African Median Family Income Correlation Summary
| Measurement | Subsaharan African Data | Median Family Income Data |
| Minimum | 0.24% | $31,084 |
| Maximum | 65.6% | $126,507 |
| Range | 65.3% | $95,423 |
| Mean | 20.1% | $80,060 |
| Median | 17.5% | $85,890 |
| Interquartile 25% (IQ1) | 8.7% | $63,281 |
| Interquartile 75% (IQ3) | 28.1% | $94,886 |
| Interquartile Range (IQR) | 19.3% | $31,605 |
| Standard Deviation (Sample) | 14.9% | $22,942 |
| Standard Deviation (Population) | 14.7% | $22,778 |
Correlation Details
| Subsaharan African Percentile | Sample Size | Median Family Income |
[ 0.0% - 0.5% ] 0.24% | 172,227,300 | $100,135 |
[ 0.5% - 1.0% ] 0.72% | 106,870,711 | $102,012 |
[ 1.0% - 1.5% ] 1.24% | 70,572,868 | $97,437 |
[ 1.5% - 2.0% ] 1.73% | 41,199,144 | $95,955 |
[ 2.0% - 2.5% ] 2.25% | 34,254,006 | $93,707 |
[ 2.5% - 3.0% ] 2.73% | 23,377,900 | $91,648 |
[ 3.0% - 3.5% ] 3.23% | 13,210,913 | $91,588 |
[ 3.5% - 4.0% ] 3.75% | 9,283,561 | $95,179 |
[ 4.0% - 4.5% ] 4.22% | 8,849,773 | $91,340 |
[ 4.5% - 5.0% ] 4.71% | 4,054,559 | $93,894 |
[ 5.0% - 5.5% ] 5.29% | 3,759,086 | $90,037 |
[ 5.5% - 6.0% ] 5.77% | 3,286,465 | $92,029 |
[ 6.0% - 6.5% ] 6.26% | 2,199,633 | $83,723 |
[ 6.5% - 7.0% ] 6.66% | 2,514,642 | $88,639 |
[ 7.0% - 7.5% ] 7.34% | 1,474,722 | $95,396 |
[ 7.5% - 8.0% ] 7.73% | 1,547,338 | $84,544 |
[ 8.0% - 8.5% ] 8.23% | 986,299 | $72,819 |
[ 8.5% - 9.0% ] 8.72% | 990,623 | $99,567 |
[ 9.0% - 9.5% ] 9.27% | 864,876 | $85,606 |
[ 9.5% - 10.0% ] 9.78% | 411,893 | $91,439 |
[ 10.0% - 10.5% ] 10.22% | 753,710 | $72,324 |
[ 10.5% - 11.0% ] 10.78% | 525,768 | $94,886 |
[ 11.0% - 11.5% ] 11.27% | 652,907 | $94,611 |
[ 11.5% - 12.0% ] 11.75% | 279,205 | $107,340 |
[ 12.0% - 12.5% ] 12.27% | 101,045 | $88,437 |
[ 12.5% - 13.0% ] 12.77% | 184,064 | $100,025 |
[ 13.0% - 13.5% ] 13.23% | 438,997 | $104,031 |
[ 13.5% - 14.0% ] 13.92% | 341,437 | $91,954 |
[ 14.0% - 14.5% ] 14.38% | 83,148 | $67,712 |
[ 14.5% - 15.0% ] 14.81% | 134,736 | $105,216 |
[ 15.0% - 15.5% ] 15.22% | 236,677 | $80,667 |
[ 15.5% - 16.0% ] 15.84% | 216,668 | $90,728 |
[ 16.0% - 16.5% ] 16.25% | 194,429 | $75,997 |
[ 16.5% - 17.0% ] 16.91% | 30,595 | $120,281 |
[ 17.0% - 17.5% ] 17.26% | 143,733 | $88,903 |
[ 17.5% - 18.0% ] 17.73% | 65,899 | $117,260 |
[ 18.0% - 18.5% ] 18.20% | 220,571 | $71,080 |
[ 18.5% - 19.0% ] 18.66% | 97,301 | $82,189 |
[ 19.0% - 19.5% ] 19.43% | 243,201 | $86,175 |
[ 19.5% - 20.0% ] 19.74% | 19,922 | $101,691 |
[ 20.0% - 20.5% ] 20.40% | 38,685 | $99,267 |
[ 20.5% - 21.0% ] 20.73% | 34,807 | $88,077 |
[ 21.0% - 21.5% ] 21.30% | 28,219 | $73,258 |
[ 21.5% - 22.0% ] 21.65% | 54,260 | $54,902 |
[ 22.0% - 22.5% ] 22.26% | 283 | $33,516 |
[ 22.5% - 23.0% ] 22.71% | 51,237 | $79,264 |
[ 23.0% - 23.5% ] 23.08% | 208 | $79,803 |
[ 23.5% - 24.0% ] 23.99% | 14,553 | $51,730 |
[ 24.0% - 24.5% ] 24.44% | 25,234 | $47,805 |
[ 24.5% - 25.0% ] 24.91% | 273 | $38,125 |
[ 25.5% - 26.0% ] 25.54% | 881 | $42,083 |
[ 26.0% - 26.5% ] 26.24% | 2,069 | $57,912 |
[ 28.0% - 28.5% ] 28.06% | 29,898 | $54,544 |
[ 28.5% - 29.0% ] 28.57% | 154 | $80,240 |
[ 30.0% - 30.5% ] 30.12% | 1,932 | $126,507 |
[ 30.5% - 31.0% ] 30.74% | 15,489 | $77,435 |
[ 31.0% - 31.5% ] 31.35% | 2,485 | $94,659 |
[ 32.5% - 33.0% ] 32.93% | 334 | $56,660 |
[ 34.0% - 34.5% ] 34.07% | 3,824 | $73,785 |
[ 34.5% - 35.0% ] 34.78% | 46 | $63,281 |
[ 35.0% - 35.5% ] 35.23% | 1,286 | $57,670 |
[ 40.0% - 40.5% ] 40.22% | 4,572 | $122,080 |
[ 40.5% - 41.0% ] 40.56% | 9,613 | $48,149 |
[ 41.5% - 42.0% ] 41.76% | 613 | $40,938 |
[ 42.0% - 42.5% ] 42.31% | 338 | $80,588 |
[ 47.0% - 47.5% ] 47.10% | 1,157 | $36,905 |
[ 49.0% - 49.5% ] 49.02% | 9,074 | $31,084 |
[ 58.0% - 58.5% ] 58.19% | 574 | $53,613 |
[ 59.0% - 59.5% ] 59.02% | 549 | $32,021 |
[ 65.5% - 66.0% ] 65.55% | 479 | $50,102 |