Subsaharan African Receiving Food Stamps
COMPARE
Subsaharan African
Select to Compare
Receiving Food Stamps
Subsaharan African Receiving Food Stamps
14.1%
PUBLIC INCOME | FOOD STAMPS
0.3/ 100
METRIC RATING
255th/ 347
METRIC RANK
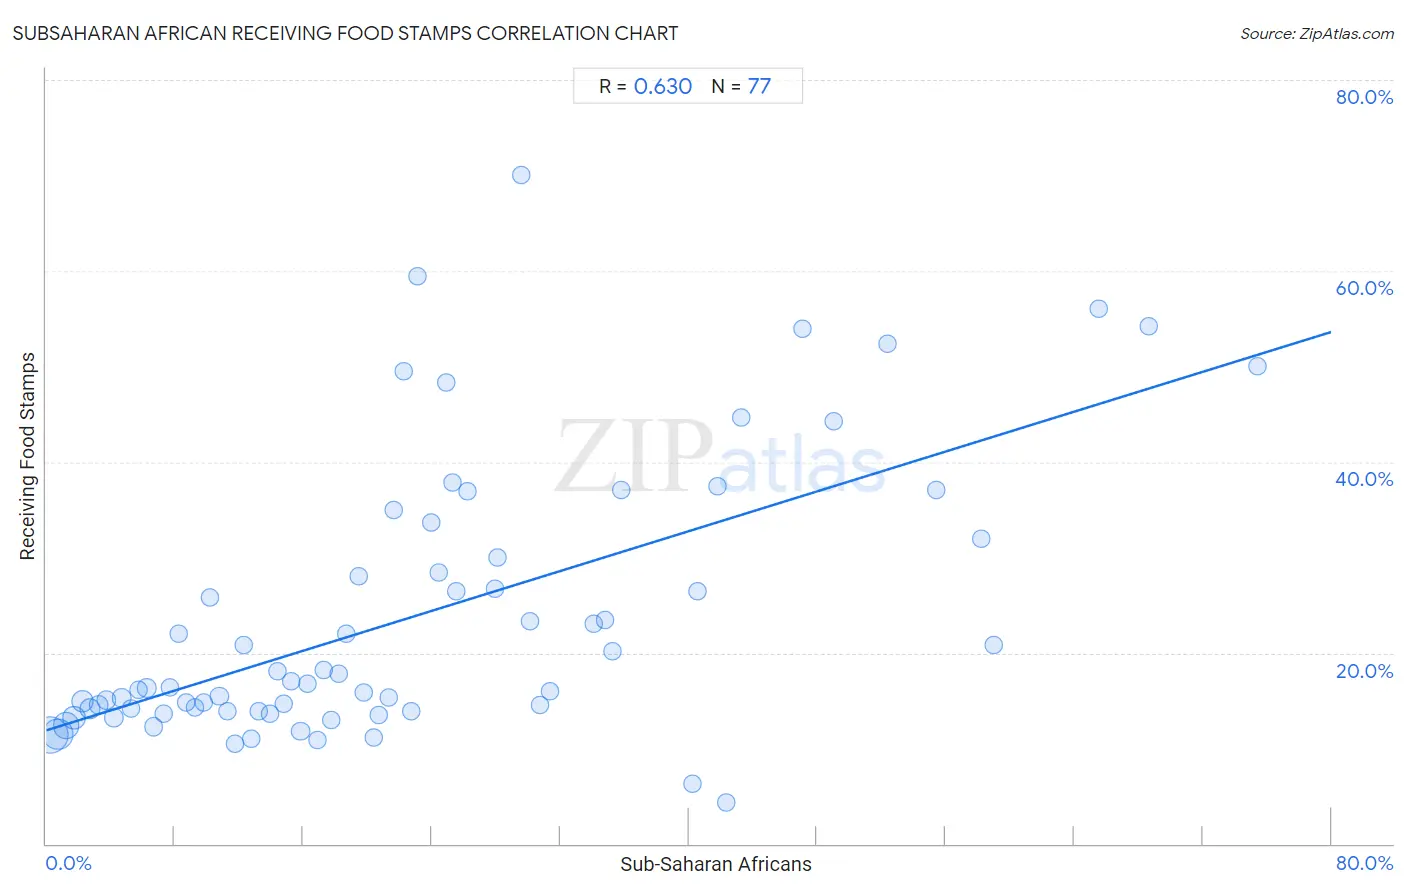
Subsaharan African Receiving Food Stamps Correlation Chart
The statistical analysis conducted on geographies consisting of 506,389,803 people shows a significant positive correlation between the proportion of Sub-Saharan Africans and percentage of population receiving government assistance and/or food stamps in the United States with a correlation coefficient (R) of 0.630 and weighted average of 14.1%. On average, for every 1% (one percent) increase in Sub-Saharan Africans within a typical geography, there is an increase of 0.52% in percentage of population receiving government assistance and/or food stamps.
It is essential to understand that the correlation between the percentage of Sub-Saharan Africans and percentage of population receiving government assistance and/or food stamps does not imply a direct cause-and-effect relationship. It remains uncertain whether the presence of Sub-Saharan Africans influences an upward or downward trend in the level of percentage of population receiving government assistance and/or food stamps within an area, or if Sub-Saharan Africans simply ended up residing in those areas with higher or lower levels of percentage of population receiving government assistance and/or food stamps due to other factors.
Demographics Similar to Sub-Saharan Africans by Receiving Food Stamps
In terms of receiving food stamps, the demographic groups most similar to Sub-Saharan Africans are Marshallese (14.1%, a difference of 0.010%), Japanese (14.1%, a difference of 0.020%), Arapaho (14.1%, a difference of 0.12%), Immigrants from Ghana (14.1%, a difference of 0.20%), and Creek (14.1%, a difference of 0.33%).
| Demographics | Rating | Rank | Receiving Food Stamps |
| Immigrants from Laos | 0.7 /100 | #248 | Tragic 13.8% |
| Indonesians | 0.6 /100 | #249 | Tragic 13.9% |
| Immigrants from Cambodia | 0.5 /100 | #250 | Tragic 13.9% |
| Yaqui | 0.5 /100 | #251 | Tragic 13.9% |
| Ghanaians | 0.5 /100 | #252 | Tragic 14.0% |
| Spanish Americans | 0.4 /100 | #253 | Tragic 14.0% |
| Marshallese | 0.3 /100 | #254 | Tragic 14.1% |
| Sub-Saharan Africans | 0.3 /100 | #255 | Tragic 14.1% |
| Japanese | 0.3 /100 | #256 | Tragic 14.1% |
| Arapaho | 0.3 /100 | #257 | Tragic 14.1% |
| Immigrants from Ghana | 0.3 /100 | #258 | Tragic 14.1% |
| Creek | 0.3 /100 | #259 | Tragic 14.1% |
| Central Americans | 0.3 /100 | #260 | Tragic 14.1% |
| Immigrants from Congo | 0.3 /100 | #261 | Tragic 14.1% |
| Paiute | 0.2 /100 | #262 | Tragic 14.3% |
Subsaharan African Receiving Food Stamps Correlation Summary
| Measurement | Subsaharan African Data | Receiving Food Stamps Data |
| Minimum | 0.24% | 4.3% |
| Maximum | 75.4% | 70.0% |
| Range | 75.2% | 65.7% |
| Mean | 22.9% | 23.8% |
| Median | 19.4% | 16.8% |
| Interquartile 25% (IQ1) | 9.5% | 13.9% |
| Interquartile 75% (IQ3) | 31.0% | 31.0% |
| Interquartile Range (IQR) | 21.5% | 17.1% |
| Standard Deviation (Sample) | 17.4% | 14.4% |
| Standard Deviation (Population) | 17.3% | 14.3% |
Correlation Details
| Subsaharan African Percentile | Sample Size | Receiving Food Stamps |
[ 0.0% - 0.5% ] 0.24% | 171,852,051 | 11.4% |
[ 0.5% - 1.0% ] 0.72% | 106,610,913 | 11.5% |
[ 1.0% - 1.5% ] 1.24% | 70,479,366 | 12.4% |
[ 1.5% - 2.0% ] 1.73% | 41,111,806 | 13.2% |
[ 2.0% - 2.5% ] 2.25% | 34,238,176 | 14.9% |
[ 2.5% - 3.0% ] 2.73% | 23,380,709 | 14.2% |
[ 3.0% - 3.5% ] 3.23% | 13,200,428 | 14.6% |
[ 3.5% - 4.0% ] 3.75% | 9,270,075 | 15.1% |
[ 4.0% - 4.5% ] 4.22% | 8,841,711 | 13.2% |
[ 4.5% - 5.0% ] 4.71% | 4,060,564 | 15.3% |
[ 5.0% - 5.5% ] 5.29% | 3,766,621 | 14.2% |
[ 5.5% - 6.0% ] 5.77% | 3,281,425 | 16.2% |
[ 6.0% - 6.5% ] 6.26% | 2,194,555 | 16.3% |
[ 6.5% - 7.0% ] 6.66% | 2,514,314 | 12.2% |
[ 7.0% - 7.5% ] 7.34% | 1,480,655 | 13.7% |
[ 7.5% - 8.0% ] 7.73% | 1,547,136 | 16.3% |
[ 8.0% - 8.5% ] 8.23% | 989,424 | 22.0% |
[ 8.5% - 9.0% ] 8.72% | 992,684 | 14.8% |
[ 9.0% - 9.5% ] 9.27% | 864,888 | 14.3% |
[ 9.5% - 10.0% ] 9.78% | 412,462 | 14.8% |
[ 10.0% - 10.5% ] 10.22% | 753,829 | 25.7% |
[ 10.5% - 11.0% ] 10.78% | 529,116 | 15.4% |
[ 11.0% - 11.5% ] 11.27% | 652,754 | 13.9% |
[ 11.5% - 12.0% ] 11.75% | 278,706 | 10.4% |
[ 12.0% - 12.5% ] 12.27% | 99,719 | 20.8% |
[ 12.5% - 13.0% ] 12.77% | 183,359 | 10.9% |
[ 13.0% - 13.5% ] 13.23% | 438,825 | 13.8% |
[ 13.5% - 14.0% ] 13.92% | 341,437 | 13.6% |
[ 14.0% - 14.5% ] 14.38% | 83,868 | 18.0% |
[ 14.5% - 15.0% ] 14.81% | 133,397 | 14.7% |
[ 15.0% - 15.5% ] 15.22% | 236,255 | 17.0% |
[ 15.5% - 16.0% ] 15.84% | 215,817 | 11.8% |
[ 16.0% - 16.5% ] 16.25% | 194,091 | 16.8% |
[ 16.5% - 17.0% ] 16.91% | 30,450 | 10.9% |
[ 17.0% - 17.5% ] 17.26% | 145,391 | 18.1% |
[ 17.5% - 18.0% ] 17.73% | 65,973 | 12.9% |
[ 18.0% - 18.5% ] 18.20% | 220,571 | 17.8% |
[ 18.5% - 19.0% ] 18.66% | 97,301 | 22.0% |
[ 19.0% - 19.5% ] 19.43% | 243,201 | 28.1% |
[ 19.5% - 20.0% ] 19.74% | 20,175 | 15.9% |
[ 20.0% - 20.5% ] 20.40% | 38,685 | 11.1% |
[ 20.5% - 21.0% ] 20.73% | 34,686 | 13.5% |
[ 21.0% - 21.5% ] 21.30% | 28,219 | 15.3% |
[ 21.5% - 22.0% ] 21.65% | 54,524 | 34.9% |
[ 22.0% - 22.5% ] 22.26% | 283 | 49.5% |
[ 22.5% - 23.0% ] 22.71% | 51,871 | 13.8% |
[ 23.0% - 23.5% ] 23.08% | 208 | 59.5% |
[ 23.5% - 24.0% ] 23.99% | 14,696 | 33.6% |
[ 24.0% - 24.5% ] 24.44% | 25,234 | 28.4% |
[ 24.5% - 25.0% ] 24.86% | 370 | 48.3% |
[ 25.0% - 25.5% ] 25.32% | 391 | 37.9% |
[ 25.5% - 26.0% ] 25.54% | 881 | 26.4% |
[ 26.0% - 26.5% ] 26.24% | 2,138 | 36.9% |
[ 27.5% - 28.0% ] 27.93% | 512 | 26.7% |
[ 28.0% - 28.5% ] 28.06% | 29,898 | 30.0% |
[ 29.5% - 30.0% ] 29.55% | 44 | 70.0% |
[ 30.0% - 30.5% ] 30.12% | 1,932 | 23.3% |
[ 30.5% - 31.0% ] 30.74% | 15,489 | 14.5% |
[ 31.0% - 31.5% ] 31.35% | 2,485 | 16.0% |
[ 34.0% - 34.5% ] 34.07% | 3,824 | 23.1% |
[ 34.5% - 35.0% ] 34.78% | 46 | 23.5% |
[ 35.0% - 35.5% ] 35.23% | 1,286 | 20.1% |
[ 35.5% - 36.0% ] 35.82% | 67 | 37.1% |
[ 40.0% - 40.5% ] 40.22% | 4,572 | 6.3% |
[ 40.5% - 41.0% ] 40.56% | 9,613 | 26.5% |
[ 41.5% - 42.0% ] 41.76% | 613 | 37.4% |
[ 42.0% - 42.5% ] 42.31% | 338 | 4.3% |
[ 43.0% - 43.5% ] 43.29% | 633 | 44.7% |
[ 47.0% - 47.5% ] 47.10% | 1,157 | 54.0% |
[ 49.0% - 49.5% ] 49.01% | 8,892 | 44.2% |
[ 52.0% - 52.5% ] 52.38% | 42 | 52.4% |
[ 55.0% - 55.5% ] 55.41% | 231 | 37.1% |
[ 58.0% - 58.5% ] 58.19% | 574 | 31.9% |
[ 59.0% - 59.5% ] 59.02% | 549 | 20.8% |
[ 65.5% - 66.0% ] 65.55% | 479 | 56.1% |
[ 68.5% - 69.0% ] 68.60% | 86 | 54.2% |
[ 75.0% - 75.5% ] 75.44% | 57 | 50.0% |