Subsaharan African Single Mother Poverty
COMPARE
Subsaharan African
Select to Compare
Single Mother Poverty
Subsaharan African Single Mother Poverty
31.4%
POVERTY | SINGLE MOTHERS
0.2/ 100
METRIC RATING
266th/ 347
METRIC RANK
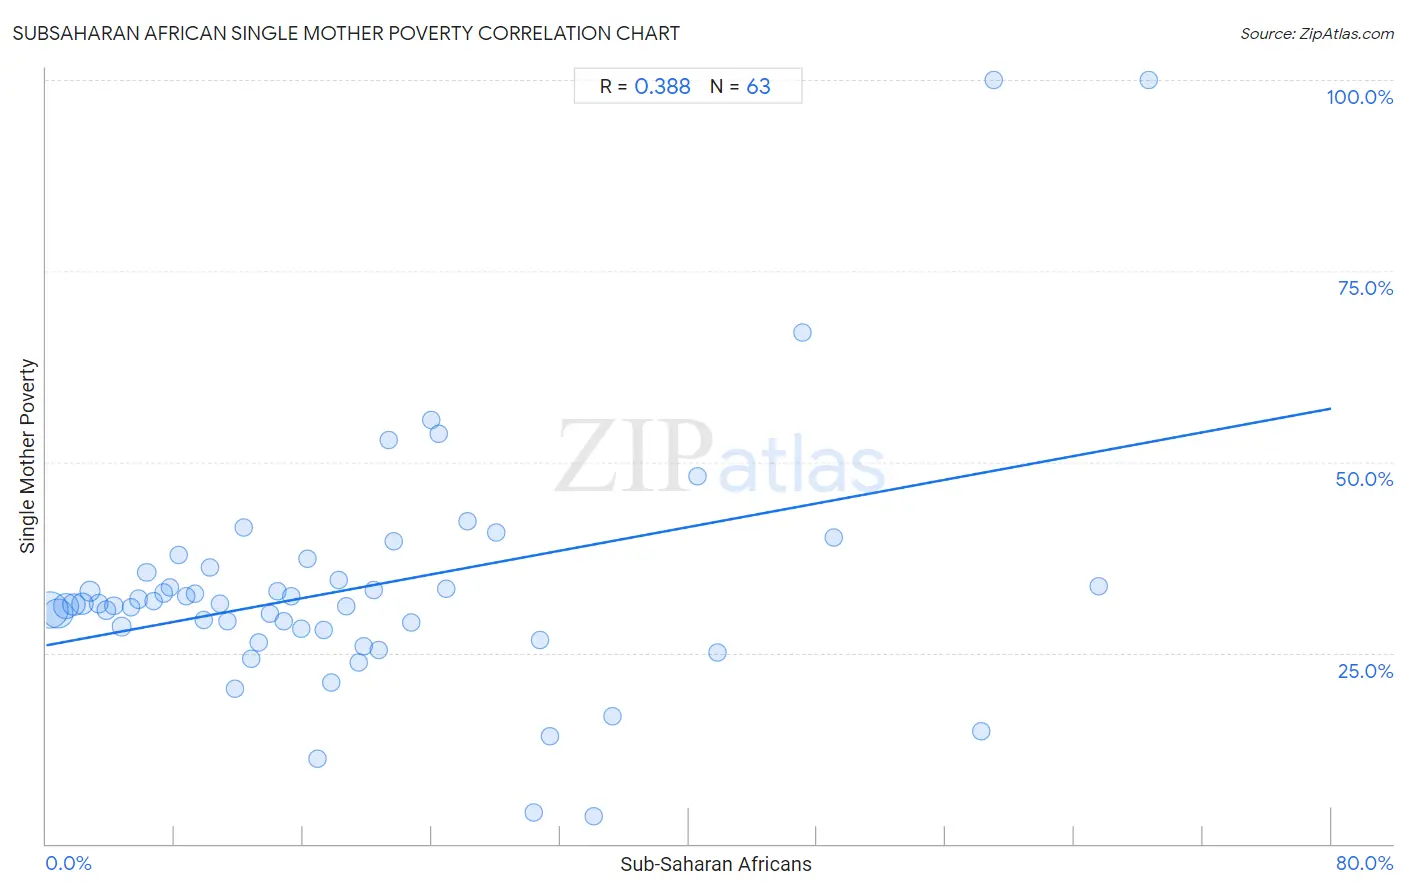
Subsaharan African Single Mother Poverty Correlation Chart
The statistical analysis conducted on geographies consisting of 493,508,844 people shows a mild positive correlation between the proportion of Sub-Saharan Africans and poverty level among single mothers in the United States with a correlation coefficient (R) of 0.388 and weighted average of 31.4%. On average, for every 1% (one percent) increase in Sub-Saharan Africans within a typical geography, there is an increase of 0.39% in poverty level among single mothers.
It is essential to understand that the correlation between the percentage of Sub-Saharan Africans and poverty level among single mothers does not imply a direct cause-and-effect relationship. It remains uncertain whether the presence of Sub-Saharan Africans influences an upward or downward trend in the level of poverty level among single mothers within an area, or if Sub-Saharan Africans simply ended up residing in those areas with higher or lower levels of poverty level among single mothers due to other factors.
Demographics Similar to Sub-Saharan Africans by Single Mother Poverty
In terms of single mother poverty, the demographic groups most similar to Sub-Saharan Africans are German Russian (31.3%, a difference of 0.070%), Immigrants from Ecuador (31.3%, a difference of 0.090%), Bahamian (31.3%, a difference of 0.11%), Immigrants from Belize (31.4%, a difference of 0.15%), and Immigrants from Senegal (31.5%, a difference of 0.33%).
| Demographics | Rating | Rank | Single Mother Poverty |
| Immigrants from Bangladesh | 0.4 /100 | #259 | Tragic 31.1% |
| Whites/Caucasians | 0.3 /100 | #260 | Tragic 31.2% |
| Immigrants from El Salvador | 0.3 /100 | #261 | Tragic 31.2% |
| Hmong | 0.3 /100 | #262 | Tragic 31.2% |
| Bahamians | 0.2 /100 | #263 | Tragic 31.3% |
| Immigrants from Ecuador | 0.2 /100 | #264 | Tragic 31.3% |
| German Russians | 0.2 /100 | #265 | Tragic 31.3% |
| Sub-Saharan Africans | 0.2 /100 | #266 | Tragic 31.4% |
| Immigrants from Belize | 0.2 /100 | #267 | Tragic 31.4% |
| Immigrants from Senegal | 0.1 /100 | #268 | Tragic 31.5% |
| Scotch-Irish | 0.1 /100 | #269 | Tragic 31.5% |
| British West Indians | 0.1 /100 | #270 | Tragic 31.5% |
| Immigrants from Cabo Verde | 0.1 /100 | #271 | Tragic 31.6% |
| Immigrants from Micronesia | 0.1 /100 | #272 | Tragic 31.6% |
| Fijians | 0.1 /100 | #273 | Tragic 31.6% |
Subsaharan African Single Mother Poverty Correlation Summary
| Measurement | Subsaharan African Data | Single Mother Poverty Data |
| Minimum | 0.24% | 3.7% |
| Maximum | 68.6% | 100.0% |
| Range | 68.4% | 96.3% |
| Mean | 19.5% | 33.5% |
| Median | 15.8% | 31.4% |
| Interquartile 25% (IQ1) | 7.7% | 28.1% |
| Interquartile 75% (IQ3) | 24.9% | 35.5% |
| Interquartile Range (IQR) | 17.2% | 7.4% |
| Standard Deviation (Sample) | 16.1% | 16.1% |
| Standard Deviation (Population) | 16.0% | 16.0% |
Correlation Details
| Subsaharan African Percentile | Sample Size | Single Mother Poverty |
[ 0.0% - 0.5% ] 0.24% | 165,558,939 | 30.5% |
[ 0.5% - 1.0% ] 0.72% | 103,833,062 | 30.2% |
[ 1.0% - 1.5% ] 1.24% | 69,088,309 | 31.1% |
[ 1.5% - 2.0% ] 1.73% | 40,460,119 | 31.3% |
[ 2.0% - 2.5% ] 2.25% | 33,850,981 | 31.5% |
[ 2.5% - 3.0% ] 2.72% | 23,085,851 | 33.0% |
[ 3.0% - 3.5% ] 3.23% | 12,991,353 | 31.5% |
[ 3.5% - 4.0% ] 3.75% | 9,182,579 | 30.6% |
[ 4.0% - 4.5% ] 4.22% | 8,735,814 | 31.2% |
[ 4.5% - 5.0% ] 4.70% | 3,898,493 | 28.4% |
[ 5.0% - 5.5% ] 5.29% | 3,674,032 | 30.9% |
[ 5.5% - 6.0% ] 5.77% | 3,229,624 | 32.0% |
[ 6.0% - 6.5% ] 6.26% | 2,179,880 | 35.5% |
[ 6.5% - 7.0% ] 6.66% | 2,475,389 | 31.7% |
[ 7.0% - 7.5% ] 7.34% | 1,461,586 | 32.8% |
[ 7.5% - 8.0% ] 7.73% | 1,503,919 | 33.6% |
[ 8.0% - 8.5% ] 8.23% | 963,898 | 37.8% |
[ 8.5% - 9.0% ] 8.72% | 985,239 | 32.4% |
[ 9.0% - 9.5% ] 9.27% | 836,929 | 32.7% |
[ 9.5% - 10.0% ] 9.78% | 398,095 | 29.3% |
[ 10.0% - 10.5% ] 10.22% | 736,483 | 36.2% |
[ 10.5% - 11.0% ] 10.78% | 519,770 | 31.4% |
[ 11.0% - 11.5% ] 11.27% | 647,185 | 29.1% |
[ 11.5% - 12.0% ] 11.74% | 272,985 | 20.4% |
[ 12.0% - 12.5% ] 12.26% | 94,029 | 41.5% |
[ 12.5% - 13.0% ] 12.77% | 176,240 | 24.2% |
[ 13.0% - 13.5% ] 13.23% | 438,825 | 26.4% |
[ 13.5% - 14.0% ] 13.91% | 308,453 | 30.0% |
[ 14.0% - 14.5% ] 14.38% | 83,590 | 33.0% |
[ 14.5% - 15.0% ] 14.82% | 116,931 | 29.1% |
[ 15.0% - 15.5% ] 15.22% | 230,725 | 32.3% |
[ 15.5% - 16.0% ] 15.84% | 206,544 | 28.1% |
[ 16.0% - 16.5% ] 16.25% | 178,847 | 37.3% |
[ 16.5% - 17.0% ] 16.92% | 25,406 | 11.2% |
[ 17.0% - 17.5% ] 17.26% | 134,580 | 28.1% |
[ 17.5% - 18.0% ] 17.73% | 65,899 | 21.2% |
[ 18.0% - 18.5% ] 18.20% | 220,571 | 34.5% |
[ 18.5% - 19.0% ] 18.66% | 97,301 | 31.1% |
[ 19.0% - 19.5% ] 19.43% | 243,201 | 23.7% |
[ 19.5% - 20.0% ] 19.74% | 19,112 | 25.8% |
[ 20.0% - 20.5% ] 20.40% | 38,309 | 33.2% |
[ 20.5% - 21.0% ] 20.72% | 30,297 | 25.3% |
[ 21.0% - 21.5% ] 21.36% | 18,438 | 52.9% |
[ 21.5% - 22.0% ] 21.64% | 43,130 | 39.5% |
[ 22.5% - 23.0% ] 22.71% | 51,026 | 29.0% |
[ 23.5% - 24.0% ] 23.99% | 14,553 | 55.4% |
[ 24.0% - 24.5% ] 24.44% | 24,795 | 53.7% |
[ 24.5% - 25.0% ] 24.91% | 273 | 33.3% |
[ 26.0% - 26.5% ] 26.24% | 2,069 | 42.2% |
[ 28.0% - 28.5% ] 28.05% | 29,533 | 40.8% |
[ 30.0% - 30.5% ] 30.36% | 606 | 4.1% |
[ 30.5% - 31.0% ] 30.74% | 15,489 | 26.6% |
[ 31.0% - 31.5% ] 31.35% | 2,485 | 14.0% |
[ 34.0% - 34.5% ] 34.07% | 3,824 | 3.7% |
[ 35.0% - 35.5% ] 35.23% | 1,286 | 16.7% |
[ 40.5% - 41.0% ] 40.56% | 9,613 | 48.1% |
[ 41.5% - 42.0% ] 41.76% | 613 | 25.0% |
[ 47.0% - 47.5% ] 47.10% | 1,157 | 66.9% |
[ 49.0% - 49.5% ] 49.01% | 8,892 | 40.1% |
[ 58.0% - 58.5% ] 58.19% | 574 | 14.7% |
[ 59.0% - 59.5% ] 59.02% | 549 | 100.0% |
[ 65.5% - 66.0% ] 65.55% | 479 | 33.8% |
[ 68.5% - 69.0% ] 68.60% | 86 | 100.0% |