Subsaharan African Disability Age 65 to 74
COMPARE
Subsaharan African
Select to Compare
Disability Age 65 to 74
Subsaharan African Disability Age 65 to 74
25.1%
DISABILITY | AGE 65 TO 74
0.6/ 100
METRIC RATING
253rd/ 347
METRIC RANK
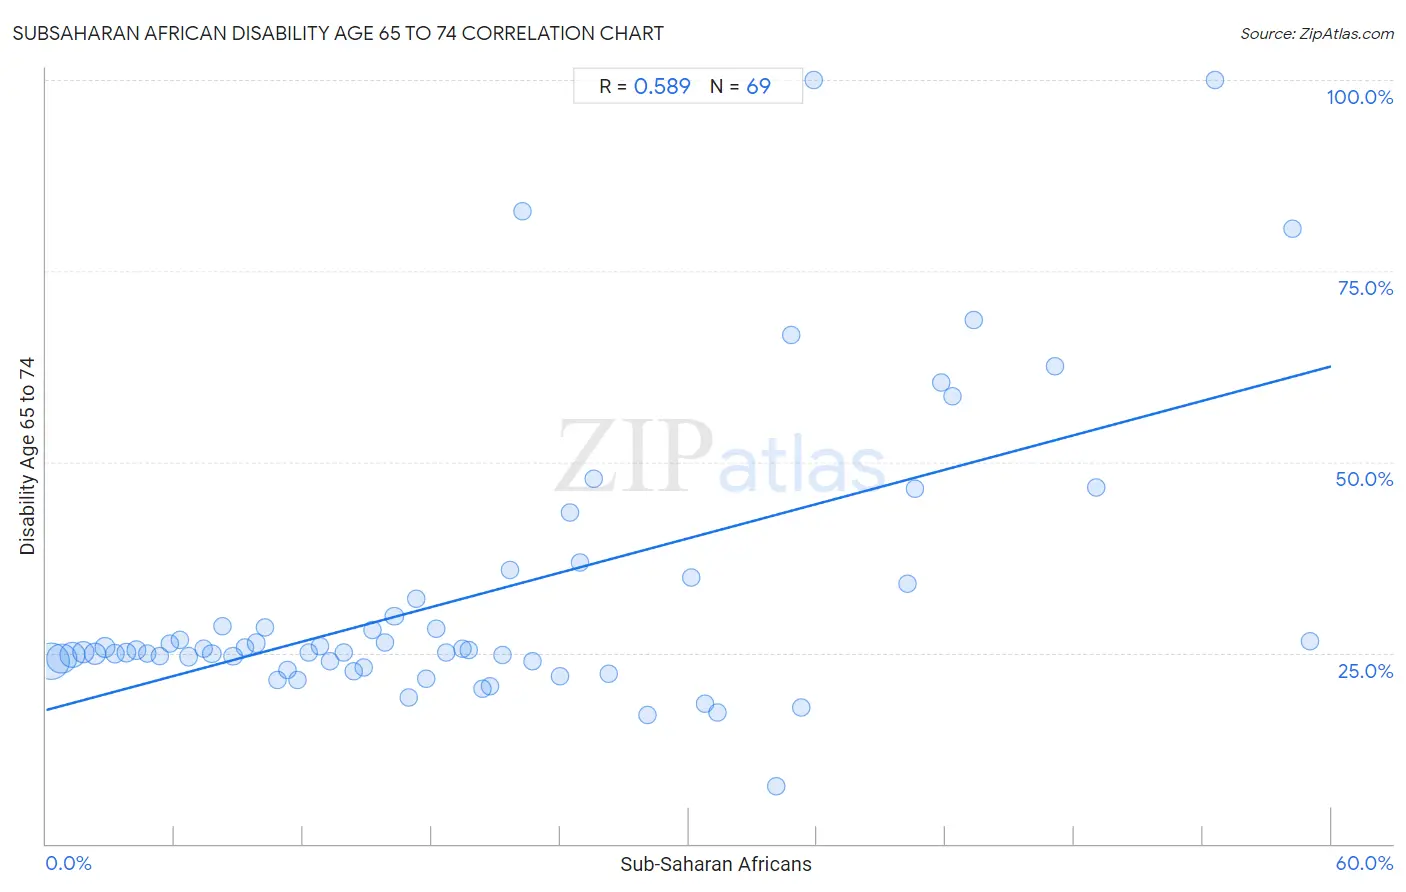
Subsaharan African Disability Age 65 to 74 Correlation Chart
The statistical analysis conducted on geographies consisting of 506,486,159 people shows a substantial positive correlation between the proportion of Sub-Saharan Africans and percentage of population with a disability between the ages 65 and 75 in the United States with a correlation coefficient (R) of 0.589 and weighted average of 25.1%. On average, for every 1% (one percent) increase in Sub-Saharan Africans within a typical geography, there is an increase of 0.75% in percentage of population with a disability between the ages 65 and 75.
It is essential to understand that the correlation between the percentage of Sub-Saharan Africans and percentage of population with a disability between the ages 65 and 75 does not imply a direct cause-and-effect relationship. It remains uncertain whether the presence of Sub-Saharan Africans influences an upward or downward trend in the level of percentage of population with a disability between the ages 65 and 75 within an area, or if Sub-Saharan Africans simply ended up residing in those areas with higher or lower levels of percentage of population with a disability between the ages 65 and 75 due to other factors.
Demographics Similar to Sub-Saharan Africans by Disability Age 65 to 74
In terms of disability age 65 to 74, the demographic groups most similar to Sub-Saharan Africans are Immigrants from El Salvador (25.1%, a difference of 0.030%), Somali (25.1%, a difference of 0.080%), Nonimmigrants (25.0%, a difference of 0.23%), Central American (25.1%, a difference of 0.23%), and Salvadoran (25.0%, a difference of 0.43%).
| Demographics | Rating | Rank | Disability Age 65 to 74 |
| Immigrants from Iraq | 1.9 /100 | #246 | Tragic 24.7% |
| Indonesians | 1.1 /100 | #247 | Tragic 24.9% |
| Senegalese | 0.9 /100 | #248 | Tragic 24.9% |
| Immigrants from Fiji | 0.8 /100 | #249 | Tragic 25.0% |
| Salvadorans | 0.8 /100 | #250 | Tragic 25.0% |
| Nonimmigrants | 0.7 /100 | #251 | Tragic 25.0% |
| Immigrants from El Salvador | 0.6 /100 | #252 | Tragic 25.1% |
| Sub-Saharan Africans | 0.6 /100 | #253 | Tragic 25.1% |
| Somalis | 0.6 /100 | #254 | Tragic 25.1% |
| Central Americans | 0.5 /100 | #255 | Tragic 25.1% |
| Immigrants from Somalia | 0.4 /100 | #256 | Tragic 25.2% |
| Guamanians/Chamorros | 0.3 /100 | #257 | Tragic 25.3% |
| Marshallese | 0.3 /100 | #258 | Tragic 25.3% |
| Immigrants from Cambodia | 0.3 /100 | #259 | Tragic 25.3% |
| Malaysians | 0.2 /100 | #260 | Tragic 25.4% |
Subsaharan African Disability Age 65 to 74 Correlation Summary
| Measurement | Subsaharan African Data | Disability Age 65 to 74 Data |
| Minimum | 0.24% | 7.5% |
| Maximum | 59.0% | 100.0% |
| Range | 58.8% | 92.5% |
| Mean | 20.2% | 32.6% |
| Median | 17.3% | 25.4% |
| Interquartile 25% (IQ1) | 8.5% | 23.9% |
| Interquartile 75% (IQ3) | 29.1% | 33.0% |
| Interquartile Range (IQR) | 20.6% | 9.1% |
| Standard Deviation (Sample) | 14.8% | 18.8% |
| Standard Deviation (Population) | 14.7% | 18.7% |
Correlation Details
| Subsaharan African Percentile | Sample Size | Disability Age 65 to 74 |
[ 0.0% - 0.5% ] 0.24% | 172,073,781 | 23.9% |
[ 0.5% - 1.0% ] 0.72% | 106,721,746 | 24.3% |
[ 1.0% - 1.5% ] 1.24% | 70,473,414 | 24.8% |
[ 1.5% - 2.0% ] 1.73% | 41,103,756 | 25.1% |
[ 2.0% - 2.5% ] 2.25% | 34,190,819 | 24.9% |
[ 2.5% - 3.0% ] 2.73% | 23,320,715 | 25.8% |
[ 3.0% - 3.5% ] 3.23% | 13,187,798 | 24.9% |
[ 3.5% - 4.0% ] 3.75% | 9,262,145 | 25.0% |
[ 4.0% - 4.5% ] 4.22% | 8,824,232 | 25.4% |
[ 4.5% - 5.0% ] 4.71% | 4,047,736 | 24.9% |
[ 5.0% - 5.5% ] 5.29% | 3,754,132 | 24.6% |
[ 5.5% - 6.0% ] 5.77% | 3,265,553 | 26.2% |
[ 6.0% - 6.5% ] 6.26% | 2,189,390 | 26.7% |
[ 6.5% - 7.0% ] 6.66% | 2,513,442 | 24.5% |
[ 7.0% - 7.5% ] 7.34% | 1,476,321 | 25.5% |
[ 7.5% - 8.0% ] 7.73% | 1,541,634 | 24.9% |
[ 8.0% - 8.5% ] 8.23% | 987,101 | 28.4% |
[ 8.5% - 9.0% ] 8.72% | 990,941 | 24.5% |
[ 9.0% - 9.5% ] 9.27% | 864,641 | 25.7% |
[ 9.5% - 10.0% ] 9.78% | 410,815 | 26.3% |
[ 10.0% - 10.5% ] 10.22% | 752,928 | 28.3% |
[ 10.5% - 11.0% ] 10.78% | 527,199 | 21.4% |
[ 11.0% - 11.5% ] 11.27% | 652,400 | 22.8% |
[ 11.5% - 12.0% ] 11.75% | 279,205 | 21.4% |
[ 12.0% - 12.5% ] 12.27% | 99,794 | 25.0% |
[ 12.5% - 13.0% ] 12.77% | 184,064 | 25.9% |
[ 13.0% - 13.5% ] 13.23% | 438,997 | 24.0% |
[ 13.5% - 14.0% ] 13.92% | 339,263 | 25.0% |
[ 14.0% - 14.5% ] 14.38% | 83,868 | 22.6% |
[ 14.5% - 15.0% ] 14.81% | 134,284 | 23.2% |
[ 15.0% - 15.5% ] 15.22% | 236,255 | 27.9% |
[ 15.5% - 16.0% ] 15.84% | 212,492 | 26.4% |
[ 16.0% - 16.5% ] 16.25% | 194,091 | 29.8% |
[ 16.5% - 17.0% ] 16.91% | 29,350 | 19.1% |
[ 17.0% - 17.5% ] 17.26% | 145,501 | 32.0% |
[ 17.5% - 18.0% ] 17.73% | 65,899 | 21.6% |
[ 18.0% - 18.5% ] 18.20% | 220,571 | 28.1% |
[ 18.5% - 19.0% ] 18.66% | 97,301 | 25.1% |
[ 19.0% - 19.5% ] 19.43% | 243,304 | 25.5% |
[ 19.5% - 20.0% ] 19.74% | 19,992 | 25.4% |
[ 20.0% - 20.5% ] 20.40% | 38,685 | 20.2% |
[ 20.5% - 21.0% ] 20.73% | 30,687 | 20.6% |
[ 21.0% - 21.5% ] 21.30% | 28,219 | 24.6% |
[ 21.5% - 22.0% ] 21.65% | 54,524 | 35.9% |
[ 22.0% - 22.5% ] 22.26% | 283 | 82.9% |
[ 22.5% - 23.0% ] 22.71% | 51,660 | 23.9% |
[ 23.5% - 24.0% ] 23.99% | 14,696 | 22.0% |
[ 24.0% - 24.5% ] 24.43% | 25,333 | 43.4% |
[ 24.5% - 25.0% ] 24.91% | 273 | 36.8% |
[ 25.5% - 26.0% ] 25.54% | 881 | 47.8% |
[ 26.0% - 26.5% ] 26.24% | 2,069 | 22.3% |
[ 28.0% - 28.5% ] 28.06% | 29,898 | 16.9% |
[ 30.0% - 30.5% ] 30.12% | 1,932 | 34.8% |
[ 30.5% - 31.0% ] 30.74% | 15,489 | 18.3% |
[ 31.0% - 31.5% ] 31.35% | 2,485 | 17.1% |
[ 34.0% - 34.5% ] 34.07% | 3,824 | 7.5% |
[ 34.5% - 35.0% ] 34.78% | 46 | 66.7% |
[ 35.0% - 35.5% ] 35.23% | 1,286 | 17.9% |
[ 35.5% - 36.0% ] 35.82% | 67 | 100.0% |
[ 40.0% - 40.5% ] 40.22% | 4,572 | 34.0% |
[ 40.5% - 41.0% ] 40.56% | 9,613 | 46.5% |
[ 41.5% - 42.0% ] 41.76% | 613 | 60.4% |
[ 42.0% - 42.5% ] 42.31% | 338 | 58.6% |
[ 43.0% - 43.5% ] 43.29% | 633 | 68.7% |
[ 47.0% - 47.5% ] 47.10% | 1,157 | 62.5% |
[ 49.0% - 49.5% ] 49.01% | 8,892 | 46.6% |
[ 54.5% - 55.0% ] 54.55% | 11 | 100.0% |
[ 58.0% - 58.5% ] 58.19% | 574 | 80.6% |
[ 59.0% - 59.5% ] 59.02% | 549 | 26.5% |