Subsaharan African Female Disability
COMPARE
Subsaharan African
Select to Compare
Female Disability
Subsaharan African Female Disability
12.7%
DISABILITY | FEMALES
1.0/ 100
METRIC RATING
260th/ 347
METRIC RANK
Subsaharan African Female Disability Correlation Chart
The statistical analysis conducted on geographies consisting of 508,044,435 people shows a mild positive correlation between the proportion of Sub-Saharan Africans and percentage of females with a disability in the United States with a correlation coefficient (R) of 0.375 and weighted average of 12.7%. On average, for every 1% (one percent) increase in Sub-Saharan Africans within a typical geography, there is an increase of 0.17% in percentage of females with a disability.
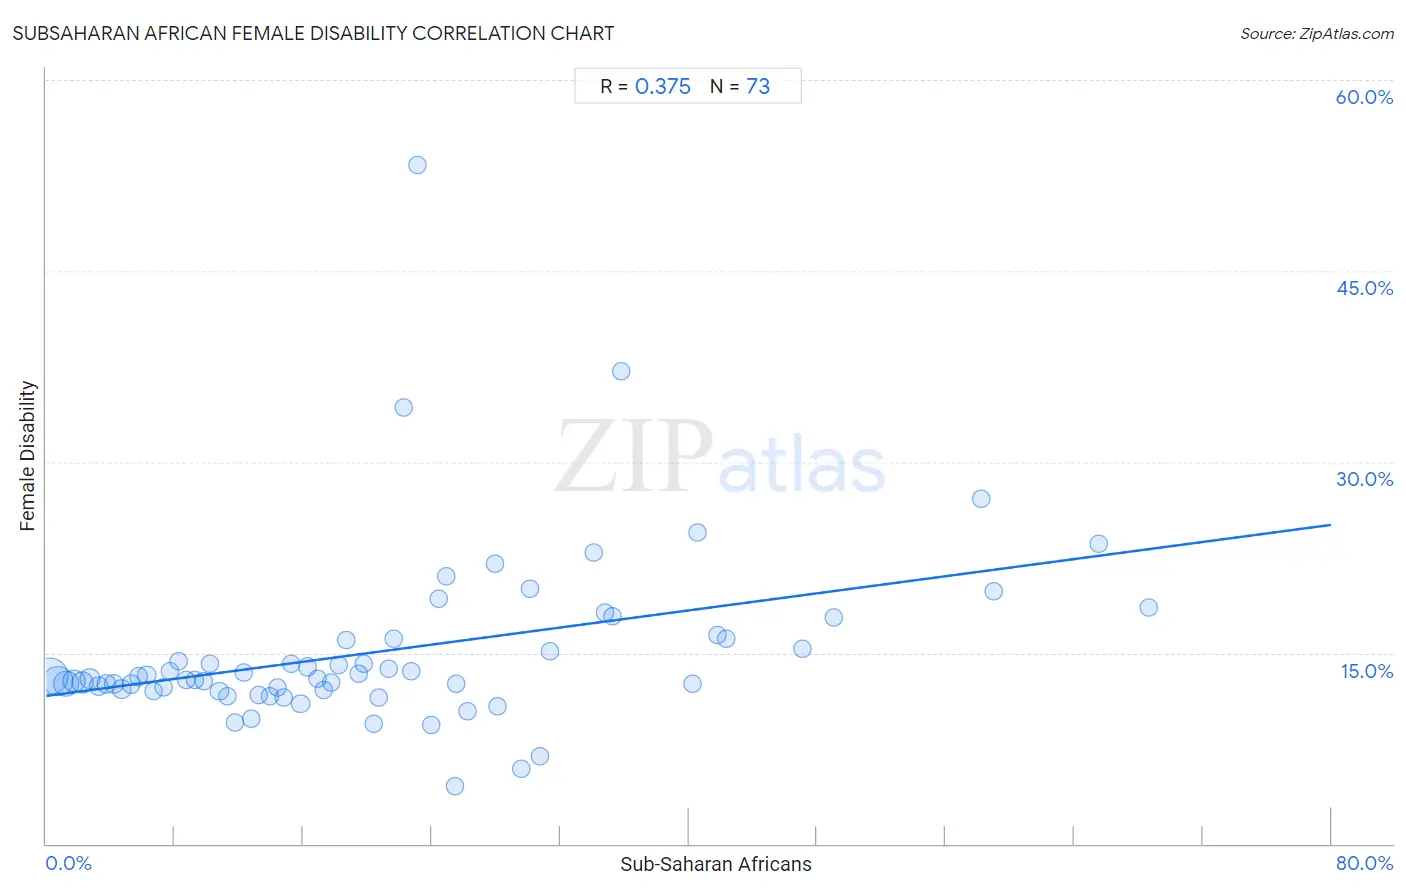
It is essential to understand that the correlation between the percentage of Sub-Saharan Africans and percentage of females with a disability does not imply a direct cause-and-effect relationship. It remains uncertain whether the presence of Sub-Saharan Africans influences an upward or downward trend in the level of percentage of females with a disability within an area, or if Sub-Saharan Africans simply ended up residing in those areas with higher or lower levels of percentage of females with a disability due to other factors.
Demographics Similar to Sub-Saharan Africans by Female Disability
In terms of female disability, the demographic groups most similar to Sub-Saharan Africans are Immigrants from Armenia (12.7%, a difference of 0.010%), Bermudan (12.7%, a difference of 0.040%), Aleut (12.7%, a difference of 0.090%), Liberian (12.7%, a difference of 0.10%), and Czechoslovakian (12.7%, a difference of 0.11%).
| Demographics | Rating | Rank | Female Disability |
| Jamaicans | 1.4 /100 | #253 | Tragic 12.7% |
| Hawaiians | 1.4 /100 | #254 | Tragic 12.7% |
| Immigrants from Germany | 1.3 /100 | #255 | Tragic 12.7% |
| British West Indians | 1.2 /100 | #256 | Tragic 12.7% |
| Liberians | 1.1 /100 | #257 | Tragic 12.7% |
| Aleuts | 1.1 /100 | #258 | Tragic 12.7% |
| Immigrants from Armenia | 1.0 /100 | #259 | Tragic 12.7% |
| Sub-Saharan Africans | 1.0 /100 | #260 | Tragic 12.7% |
| Bermudans | 1.0 /100 | #261 | Tragic 12.7% |
| Czechoslovakians | 0.9 /100 | #262 | Tragic 12.7% |
| Spaniards | 0.7 /100 | #263 | Tragic 12.8% |
| Alaska Natives | 0.6 /100 | #264 | Tragic 12.8% |
| West Indians | 0.5 /100 | #265 | Tragic 12.8% |
| Finns | 0.4 /100 | #266 | Tragic 12.8% |
| Senegalese | 0.4 /100 | #267 | Tragic 12.8% |
Subsaharan African Female Disability Correlation Summary
| Measurement | Subsaharan African Data | Female Disability Data |
| Minimum | 0.24% | 4.5% |
| Maximum | 68.6% | 53.3% |
| Range | 68.4% | 48.8% |
| Mean | 21.0% | 15.1% |
| Median | 18.2% | 12.9% |
| Interquartile 25% (IQ1) | 9.0% | 12.1% |
| Interquartile 75% (IQ3) | 28.8% | 16.1% |
| Interquartile Range (IQR) | 19.8% | 4.0% |
| Standard Deviation (Sample) | 15.7% | 7.0% |
| Standard Deviation (Population) | 15.6% | 7.0% |
Correlation Details
| Subsaharan African Percentile | Sample Size | Female Disability |
[ 0.0% - 0.5% ] 0.24% | 172,467,040 | 13.1% |
[ 0.5% - 1.0% ] 0.72% | 106,969,867 | 12.8% |
[ 1.0% - 1.5% ] 1.24% | 70,720,097 | 12.6% |
[ 1.5% - 2.0% ] 1.73% | 41,276,245 | 12.8% |
[ 2.0% - 2.5% ] 2.25% | 34,307,671 | 12.7% |
[ 2.5% - 3.0% ] 2.73% | 23,421,870 | 12.9% |
[ 3.0% - 3.5% ] 3.23% | 13,254,057 | 12.4% |
[ 3.5% - 4.0% ] 3.75% | 9,294,366 | 12.5% |
[ 4.0% - 4.5% ] 4.22% | 8,858,470 | 12.6% |
[ 4.5% - 5.0% ] 4.71% | 4,062,245 | 12.1% |
[ 5.0% - 5.5% ] 5.29% | 3,777,359 | 12.5% |
[ 5.5% - 6.0% ] 5.77% | 3,295,466 | 13.1% |
[ 6.0% - 6.5% ] 6.26% | 2,200,755 | 13.3% |
[ 6.5% - 7.0% ] 6.66% | 2,516,369 | 12.0% |
[ 7.0% - 7.5% ] 7.34% | 1,489,685 | 12.3% |
[ 7.5% - 8.0% ] 7.73% | 1,551,571 | 13.6% |
[ 8.0% - 8.5% ] 8.23% | 992,748 | 14.3% |
[ 8.5% - 9.0% ] 8.72% | 993,111 | 12.9% |
[ 9.0% - 9.5% ] 9.27% | 872,916 | 12.9% |
[ 9.5% - 10.0% ] 9.78% | 412,535 | 12.7% |
[ 10.0% - 10.5% ] 10.22% | 754,219 | 14.2% |
[ 10.5% - 11.0% ] 10.78% | 531,625 | 12.0% |
[ 11.0% - 11.5% ] 11.27% | 652,907 | 11.6% |
[ 11.5% - 12.0% ] 11.75% | 279,205 | 9.5% |
[ 12.0% - 12.5% ] 12.27% | 100,826 | 13.5% |
[ 12.5% - 13.0% ] 12.77% | 185,624 | 9.8% |
[ 13.0% - 13.5% ] 13.23% | 438,997 | 11.7% |
[ 13.5% - 14.0% ] 13.91% | 341,756 | 11.6% |
[ 14.0% - 14.5% ] 14.38% | 83,868 | 12.3% |
[ 14.5% - 15.0% ] 14.81% | 134,284 | 11.5% |
[ 15.0% - 15.5% ] 15.22% | 236,255 | 14.2% |
[ 15.5% - 16.0% ] 15.84% | 217,851 | 11.0% |
[ 16.0% - 16.5% ] 16.25% | 194,429 | 13.9% |
[ 16.5% - 17.0% ] 16.91% | 29,495 | 12.9% |
[ 17.0% - 17.5% ] 17.26% | 145,391 | 12.1% |
[ 17.5% - 18.0% ] 17.73% | 65,973 | 12.6% |
[ 18.0% - 18.5% ] 18.20% | 221,308 | 14.0% |
[ 18.5% - 19.0% ] 18.66% | 97,301 | 16.0% |
[ 19.0% - 19.5% ] 19.43% | 243,304 | 13.4% |
[ 19.5% - 20.0% ] 19.74% | 20,175 | 14.2% |
[ 20.0% - 20.5% ] 20.40% | 38,685 | 9.4% |
[ 20.5% - 21.0% ] 20.73% | 34,710 | 11.5% |
[ 21.0% - 21.5% ] 21.30% | 28,219 | 13.7% |
[ 21.5% - 22.0% ] 21.65% | 54,524 | 16.1% |
[ 22.0% - 22.5% ] 22.26% | 283 | 34.2% |
[ 22.5% - 23.0% ] 22.71% | 52,239 | 13.6% |
[ 23.0% - 23.5% ] 23.08% | 208 | 53.3% |
[ 23.5% - 24.0% ] 23.99% | 14,696 | 9.3% |
[ 24.0% - 24.5% ] 24.43% | 25,333 | 19.3% |
[ 24.5% - 25.0% ] 24.91% | 273 | 21.1% |
[ 25.0% - 25.5% ] 25.47% | 267 | 4.5% |
[ 25.5% - 26.0% ] 25.54% | 881 | 12.5% |
[ 26.0% - 26.5% ] 26.24% | 2,138 | 10.4% |
[ 27.5% - 28.0% ] 27.93% | 512 | 22.0% |
[ 28.0% - 28.5% ] 28.06% | 29,898 | 10.8% |
[ 29.5% - 30.0% ] 29.55% | 44 | 5.9% |
[ 30.0% - 30.5% ] 30.14% | 2,037 | 20.0% |
[ 30.5% - 31.0% ] 30.74% | 15,489 | 6.8% |
[ 31.0% - 31.5% ] 31.35% | 2,485 | 15.1% |
[ 34.0% - 34.5% ] 34.07% | 3,824 | 22.8% |
[ 34.5% - 35.0% ] 34.78% | 46 | 18.2% |
[ 35.0% - 35.5% ] 35.23% | 1,286 | 17.9% |
[ 35.5% - 36.0% ] 35.82% | 67 | 37.1% |
[ 40.0% - 40.5% ] 40.22% | 4,572 | 12.5% |
[ 40.5% - 41.0% ] 40.56% | 9,613 | 24.4% |
[ 41.5% - 42.0% ] 41.76% | 613 | 16.4% |
[ 42.0% - 42.5% ] 42.31% | 338 | 16.1% |
[ 47.0% - 47.5% ] 47.10% | 1,157 | 15.4% |
[ 49.0% - 49.5% ] 49.02% | 9,074 | 17.8% |
[ 58.0% - 58.5% ] 58.19% | 574 | 27.1% |
[ 59.0% - 59.5% ] 59.02% | 549 | 19.9% |
[ 65.5% - 66.0% ] 65.55% | 479 | 23.6% |
[ 68.5% - 69.0% ] 68.60% | 86 | 18.6% |