Subsaharan African Disability Age Under 5
COMPARE
Subsaharan African
Select to Compare
Disability Age Under 5
Subsaharan African Disability Age Under 5
1.3%
DISABILITY | AGE UNDER 5
8.3/ 100
METRIC RATING
221st/ 347
METRIC RANK
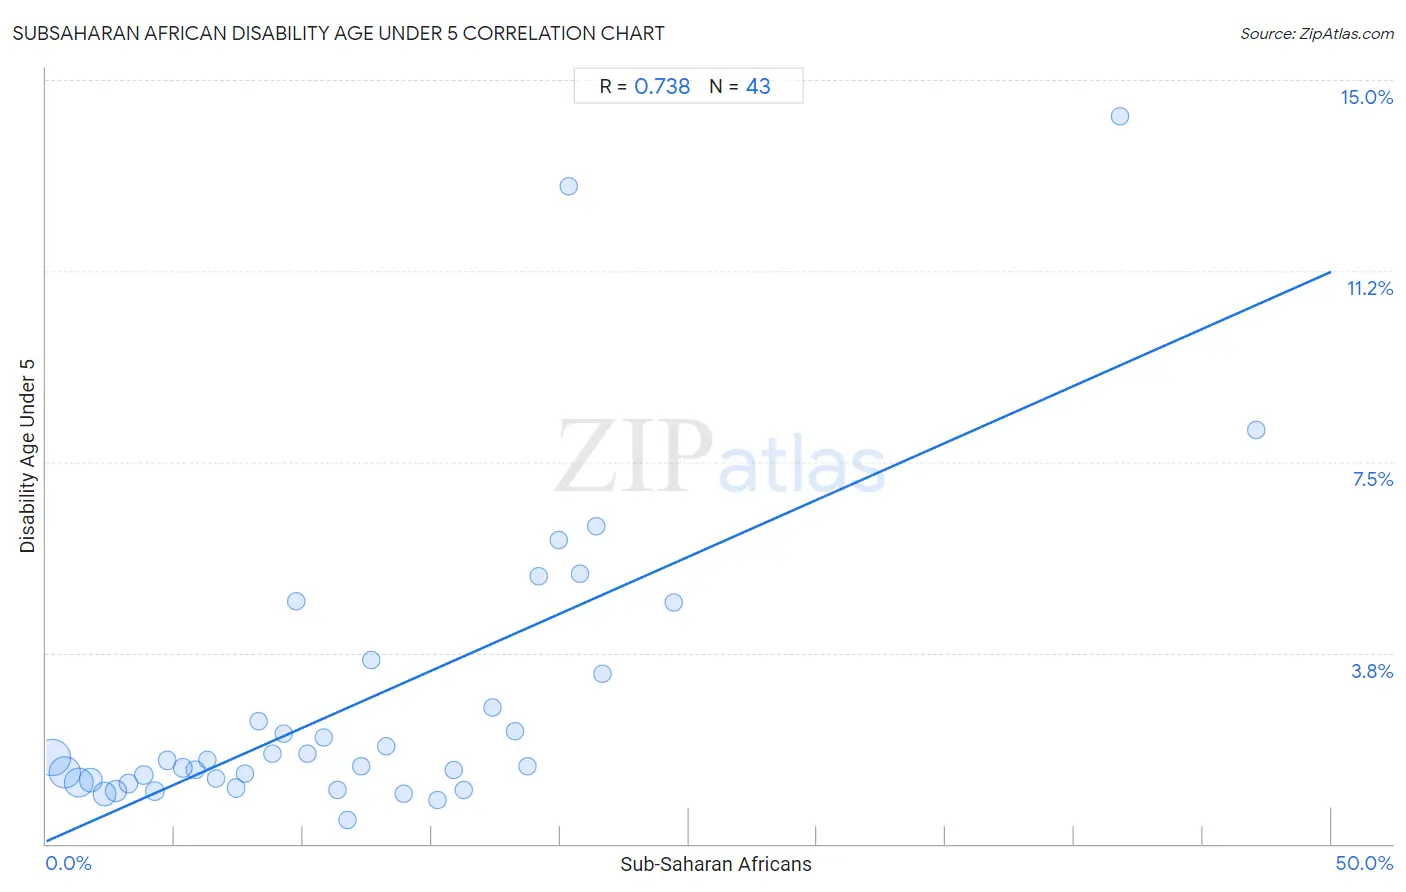
Subsaharan African Disability Age Under 5 Correlation Chart
The statistical analysis conducted on geographies consisting of 252,320,472 people shows a strong positive correlation between the proportion of Sub-Saharan Africans and percentage of population with a disability under the age of 5 in the United States with a correlation coefficient (R) of 0.738 and weighted average of 1.3%. On average, for every 1% (one percent) increase in Sub-Saharan Africans within a typical geography, there is an increase of 0.22% in percentage of population with a disability under the age of 5.
It is essential to understand that the correlation between the percentage of Sub-Saharan Africans and percentage of population with a disability under the age of 5 does not imply a direct cause-and-effect relationship. It remains uncertain whether the presence of Sub-Saharan Africans influences an upward or downward trend in the level of percentage of population with a disability under the age of 5 within an area, or if Sub-Saharan Africans simply ended up residing in those areas with higher or lower levels of percentage of population with a disability under the age of 5 due to other factors.
Demographics Similar to Sub-Saharan Africans by Disability Age Under 5
In terms of disability age under 5, the demographic groups most similar to Sub-Saharan Africans are Ukrainian (1.3%, a difference of 0.0%), Hispanic or Latino (1.3%, a difference of 0.19%), Serbian (1.3%, a difference of 0.34%), Latvian (1.3%, a difference of 0.35%), and Panamanian (1.3%, a difference of 0.38%).
| Demographics | Rating | Rank | Disability Age Under 5 |
| Immigrants from Chile | 17.2 /100 | #214 | Poor 1.3% |
| Syrians | 16.1 /100 | #215 | Poor 1.3% |
| Bangladeshis | 15.5 /100 | #216 | Poor 1.3% |
| Cypriots | 14.9 /100 | #217 | Poor 1.3% |
| Malaysians | 13.2 /100 | #218 | Poor 1.3% |
| Immigrants from Croatia | 11.2 /100 | #219 | Poor 1.3% |
| Serbians | 9.6 /100 | #220 | Tragic 1.3% |
| Sub-Saharan Africans | 8.3 /100 | #221 | Tragic 1.3% |
| Ukrainians | 8.3 /100 | #222 | Tragic 1.3% |
| Hispanics or Latinos | 7.7 /100 | #223 | Tragic 1.3% |
| Latvians | 7.1 /100 | #224 | Tragic 1.3% |
| Panamanians | 7.1 /100 | #225 | Tragic 1.3% |
| Bahamians | 7.1 /100 | #226 | Tragic 1.3% |
| Taiwanese | 6.1 /100 | #227 | Tragic 1.3% |
| Luxembourgers | 6.1 /100 | #228 | Tragic 1.3% |
Subsaharan African Disability Age Under 5 Correlation Summary
| Measurement | Subsaharan African Data | Disability Age Under 5 Data |
| Minimum | 0.24% | 0.47% |
| Maximum | 47.1% | 14.3% |
| Range | 46.9% | 13.8% |
| Mean | 12.4% | 2.8% |
| Median | 10.8% | 1.6% |
| Interquartile 25% (IQ1) | 5.3% | 1.2% |
| Interquartile 75% (IQ3) | 18.2% | 3.4% |
| Interquartile Range (IQR) | 12.9% | 2.1% |
| Standard Deviation (Sample) | 9.8% | 3.0% |
| Standard Deviation (Population) | 9.7% | 2.9% |
Correlation Details
| Subsaharan African Percentile | Sample Size | Disability Age Under 5 |
[ 0.0% - 0.5% ] 0.24% | 69,356,342 | 1.7% |
[ 0.5% - 1.0% ] 0.72% | 52,319,323 | 1.4% |
[ 1.0% - 1.5% ] 1.25% | 41,436,120 | 1.2% |
[ 1.5% - 2.0% ] 1.74% | 22,049,191 | 1.2% |
[ 2.0% - 2.5% ] 2.27% | 21,291,120 | 0.98% |
[ 2.5% - 3.0% ] 2.72% | 15,896,840 | 1.0% |
[ 3.0% - 3.5% ] 3.21% | 6,513,273 | 1.2% |
[ 3.5% - 4.0% ] 3.79% | 4,270,266 | 1.3% |
[ 4.0% - 4.5% ] 4.22% | 5,597,183 | 1.0% |
[ 4.5% - 5.0% ] 4.70% | 1,895,655 | 1.6% |
[ 5.0% - 5.5% ] 5.31% | 2,296,033 | 1.5% |
[ 5.5% - 6.0% ] 5.79% | 2,016,599 | 1.5% |
[ 6.0% - 6.5% ] 6.27% | 1,123,763 | 1.6% |
[ 6.5% - 7.0% ] 6.60% | 1,517,284 | 1.3% |
[ 7.0% - 7.5% ] 7.38% | 969,891 | 1.1% |
[ 7.5% - 8.0% ] 7.74% | 713,468 | 1.4% |
[ 8.0% - 8.5% ] 8.25% | 365,745 | 2.4% |
[ 8.5% - 9.0% ] 8.81% | 438,280 | 1.8% |
[ 9.0% - 9.5% ] 9.24% | 318,807 | 2.2% |
[ 9.5% - 10.0% ] 9.71% | 85,276 | 4.8% |
[ 10.0% - 10.5% ] 10.18% | 381,810 | 1.8% |
[ 10.5% - 11.0% ] 10.78% | 161,382 | 2.1% |
[ 11.0% - 11.5% ] 11.35% | 201,512 | 1.0% |
[ 11.5% - 12.0% ] 11.71% | 117,994 | 0.47% |
[ 12.0% - 12.5% ] 12.26% | 60,103 | 1.5% |
[ 12.5% - 13.0% ] 12.66% | 42,107 | 3.6% |
[ 13.0% - 13.5% ] 13.21% | 187,516 | 1.9% |
[ 13.5% - 14.0% ] 13.92% | 174,442 | 0.98% |
[ 15.0% - 15.5% ] 15.23% | 71,840 | 0.87% |
[ 15.5% - 16.0% ] 15.87% | 109,956 | 1.4% |
[ 16.0% - 16.5% ] 16.26% | 65,884 | 1.1% |
[ 17.0% - 17.5% ] 17.35% | 30,625 | 2.7% |
[ 18.0% - 18.5% ] 18.23% | 155,483 | 2.2% |
[ 18.5% - 19.0% ] 18.72% | 2,693 | 1.5% |
[ 19.0% - 19.5% ] 19.18% | 1,199 | 5.3% |
[ 19.5% - 20.0% ] 19.95% | 6,420 | 6.0% |
[ 20.0% - 20.5% ] 20.33% | 5,331 | 12.9% |
[ 20.5% - 21.0% ] 20.76% | 25,987 | 5.3% |
[ 21.0% - 21.5% ] 21.42% | 10,482 | 6.2% |
[ 21.5% - 22.0% ] 21.65% | 10,682 | 3.4% |
[ 24.0% - 24.5% ] 24.44% | 24,795 | 4.7% |
[ 41.5% - 42.0% ] 41.76% | 613 | 14.3% |
[ 47.0% - 47.5% ] 47.10% | 1,157 | 8.1% |