Subsaharan African Unemployment Among Women with Children Under 6 years

COMPARE

Subsaharan African
Race
Ancestry
AfghanAfricanAlaska NativeAlaskan AthabascanAlbanianAleutAlsatianAmericanApacheArabArapahoArgentineanArmenianAssyrian/Chaldean/SyriacAustralianAustrianBahamianBangladeshiBarbadianBasqueBelgianBelizeanBermudanBhutaneseBlackfeetBolivianBrazilianBritishBritish West IndianBulgarianBurmeseCajunCambodianCanadianCape VerdeanCarpatho RusynCelticCentral AmericanCentral American IndianCherokeeCheyenneChickasawChileanChineseChippewaChoctawColombianColvilleComancheCosta RicanCreeCreekCroatianCrowCubanCypriotCzechCzechoslovakianDanishDelawareDominicanDutchDutch West IndianEastern EuropeanEcuadorianEgyptianEnglishEstonianEthiopianEuropeanFijianFilipinoFinnishFrenchFrench American IndianFrench CanadianGermanGerman RussianGhanaianGreekGuamanian/ChamorroGuatemalanGuyaneseHaitianHmongHonduranHopiHoumaHungarianIcelanderIndian (Asian)IndonesianInupiatIranianIraqiIrishIroquoisIsraeliItalianJamaicanJapaneseJordanianKenyanKiowaKoreanLaotianLatvianLebaneseLiberianLithuanianLumbeeLuxembourgerMacedonianMalaysianMalteseMarshalleseMenomineeMexicanMexican American IndianMongolianMoroccanNative HawaiianNavajoNepaleseNew ZealanderNicaraguanNigerianNorthern EuropeanNorwegianOkinawanOsageOttawaPaiutePakistaniPalestinianPanamanianParaguayanPennsylvania GermanPeruvianPimaPolishPortuguesePotawatomiPuebloPuerto RicanPuget Sound SalishRomanianRussianSalvadoranSamoanScandinavianScotch-IrishScottishSeminoleSenegaleseSerbianShoshoneSierra LeoneanSiouxSlavicSlovakSloveneSomaliSouth AfricanSouth AmericanSouth American IndianSoviet UnionSpaniardSpanishSpanish AmericanSpanish American IndianSri LankanSubsaharan AfricanSudaneseSwedishSwissSyrianTaiwaneseThaiTlingit-HaidaTohono O'OdhamTonganTrinidadian and TobagonianTsimshianTurkishU.S. Virgin IslanderUgandanUkrainianUruguayanUteVenezuelanVietnameseWelshWest IndianYakamaYaquiYugoslavianYumanYup'ikZimbabwean
Immigration
NonimmigrantsImmigrantsAfghanistanAfricaAlbaniaArgentinaArmeniaAsiaAustraliaAustriaBahamasBangladeshBarbadosBelarusBelgiumBelizeBoliviaBosnia and HerzegovinaBrazilBulgariaBurma/MyanmarCabo VerdeCambodiaCameroonCanadaCaribbeanCentral AmericaChileChinaColombiaCongoCosta RicaCroatiaCubaCzechoslovakiaDenmarkDominicaDominican RepublicEastern AfricaEastern AsiaEastern EuropeEcuadorEgyptEl SalvadorEnglandEritreaEthiopiaEuropeFijiFranceGermanyGhanaGreeceGrenadaGuatemalaGuyanaHaitiHondurasHong KongHungaryIndiaIndonesiaIranIraqIrelandIsraelItalyJamaicaJapanJordanKazakhstanKenyaKoreaKuwaitLaosLatin AmericaLatviaLebanonLiberiaLithuaniaMalaysiaMexicoMicronesiaMiddle AfricaMoldovaMoroccoNepalNetherlandsNicaraguaNigeriaNorth AmericaNorth MacedoniaNorthern AfricaNorthern EuropeNorwayOceaniaPakistanPanamaPeruPhilippinesPolandPortugalRomaniaRussiaSaudi ArabiaScotlandSenegalSerbiaSierra LeoneSingaporeSomaliaSouth AfricaSouth AmericaSouth Central AsiaSouth Eastern AsiaSouthern EuropeSpainSri LankaSt. Vincent and the GrenadinesSudanSwedenSwitzerlandSyriaTaiwanThailandTrinidad and TobagoTurkeyUgandaUkraineUruguayUzbekistanVenezuelaVietnamWest IndiesWestern AfricaWestern AsiaWestern EuropeYemenZaireZimbabweAzores
Select to Compare
Race
Ancestry
AfghanAfricanAlaska NativeAlaskan AthabascanAlbanianAleutAlsatianAmericanApacheArabArapahoArgentineanArmenianAssyrian/Chaldean/SyriacAustralianAustrianBahamianBangladeshiBarbadianBasqueBelgianBelizeanBermudanBhutaneseBlackfeetBolivianBrazilianBritishBritish West IndianBulgarianBurmeseCajunCambodianCanadianCape VerdeanCarpatho RusynCelticCentral AmericanCentral American IndianCherokeeCheyenneChickasawChileanChineseChippewaChoctawColombianColvilleComancheCosta RicanCreeCreekCroatianCrowCubanCypriotCzechCzechoslovakianDanishDelawareDominicanDutchDutch West IndianEastern EuropeanEcuadorianEgyptianEnglishEstonianEthiopianEuropeanFijianFilipinoFinnishFrenchFrench American IndianFrench CanadianGermanGerman RussianGhanaianGreekGuamanian/ChamorroGuatemalanGuyaneseHaitianHmongHonduranHopiHoumaHungarianIcelanderIndian (Asian)IndonesianInupiatIranianIraqiIrishIroquoisIsraeliItalianJamaicanJapaneseJordanianKenyanKiowaKoreanLaotianLatvianLebaneseLiberianLithuanianLumbeeLuxembourgerMacedonianMalaysianMalteseMarshalleseMenomineeMexicanMexican American IndianMongolianMoroccanNative HawaiianNavajoNepaleseNew ZealanderNicaraguanNigerianNorthern EuropeanNorwegianOkinawanOsageOttawaPaiutePakistaniPalestinianPanamanianParaguayanPennsylvania GermanPeruvianPimaPolishPortuguesePotawatomiPuebloPuerto RicanPuget Sound SalishRomanianRussianSalvadoranSamoanScandinavianScotch-IrishScottishSeminoleSenegaleseSerbianShoshoneSierra LeoneanSiouxSlavicSlovakSloveneSomaliSouth AfricanSouth AmericanSouth American IndianSoviet UnionSpaniardSpanishSpanish AmericanSpanish American IndianSri LankanSudaneseSwedishSwissSyrianTaiwaneseThaiTlingit-HaidaTohono O'OdhamTonganTrinidadian and TobagonianTsimshianTurkishU.S. Virgin IslanderUgandanUkrainianUruguayanUteVenezuelanVietnameseWelshWest IndianYakamaYaquiYugoslavianYumanYup'ikZimbabwean
Immigration
NonimmigrantsImmigrantsAfghanistanAfricaAlbaniaArgentinaArmeniaAsiaAustraliaAustriaBahamasBangladeshBarbadosBelarusBelgiumBelizeBoliviaBosnia and HerzegovinaBrazilBulgariaBurma/MyanmarCabo VerdeCambodiaCameroonCanadaCaribbeanCentral AmericaChileChinaColombiaCongoCosta RicaCroatiaCubaCzechoslovakiaDenmarkDominicaDominican RepublicEastern AfricaEastern AsiaEastern EuropeEcuadorEgyptEl SalvadorEnglandEritreaEthiopiaEuropeFijiFranceGermanyGhanaGreeceGrenadaGuatemalaGuyanaHaitiHondurasHong KongHungaryIndiaIndonesiaIranIraqIrelandIsraelItalyJamaicaJapanJordanKazakhstanKenyaKoreaKuwaitLaosLatin AmericaLatviaLebanonLiberiaLithuaniaMalaysiaMexicoMicronesiaMiddle AfricaMoldovaMoroccoNepalNetherlandsNicaraguaNigeriaNorth AmericaNorth MacedoniaNorthern AfricaNorthern EuropeNorwayOceaniaPakistanPanamaPeruPhilippinesPolandPortugalRomaniaRussiaSaudi ArabiaScotlandSenegalSerbiaSierra LeoneSingaporeSomaliaSouth AfricaSouth AmericaSouth Central AsiaSouth Eastern AsiaSouthern EuropeSpainSri LankaSt. Vincent and the GrenadinesSudanSwedenSwitzerlandSyriaTaiwanThailandTrinidad and TobagoTurkeyUgandaUkraineUruguayUzbekistanVenezuelaVietnamWest IndiesWestern AfricaWestern AsiaWestern EuropeYemenZaireZimbabweAzores
Unemployment Among Women with Children Under 6 years
Income
Poverty
Unemployment
Labor Participation
Family Structure
Vehicle Availability
Education Level
Disability

Subsaharan African Unemployment Among Women with Children Under 6 years
Tragic

8.4%
UNEMPLOYMENT | WOMEN W/ CHILDREN < 6
0.2/ 100
METRIC RATING
268th/ 347
METRIC RANK

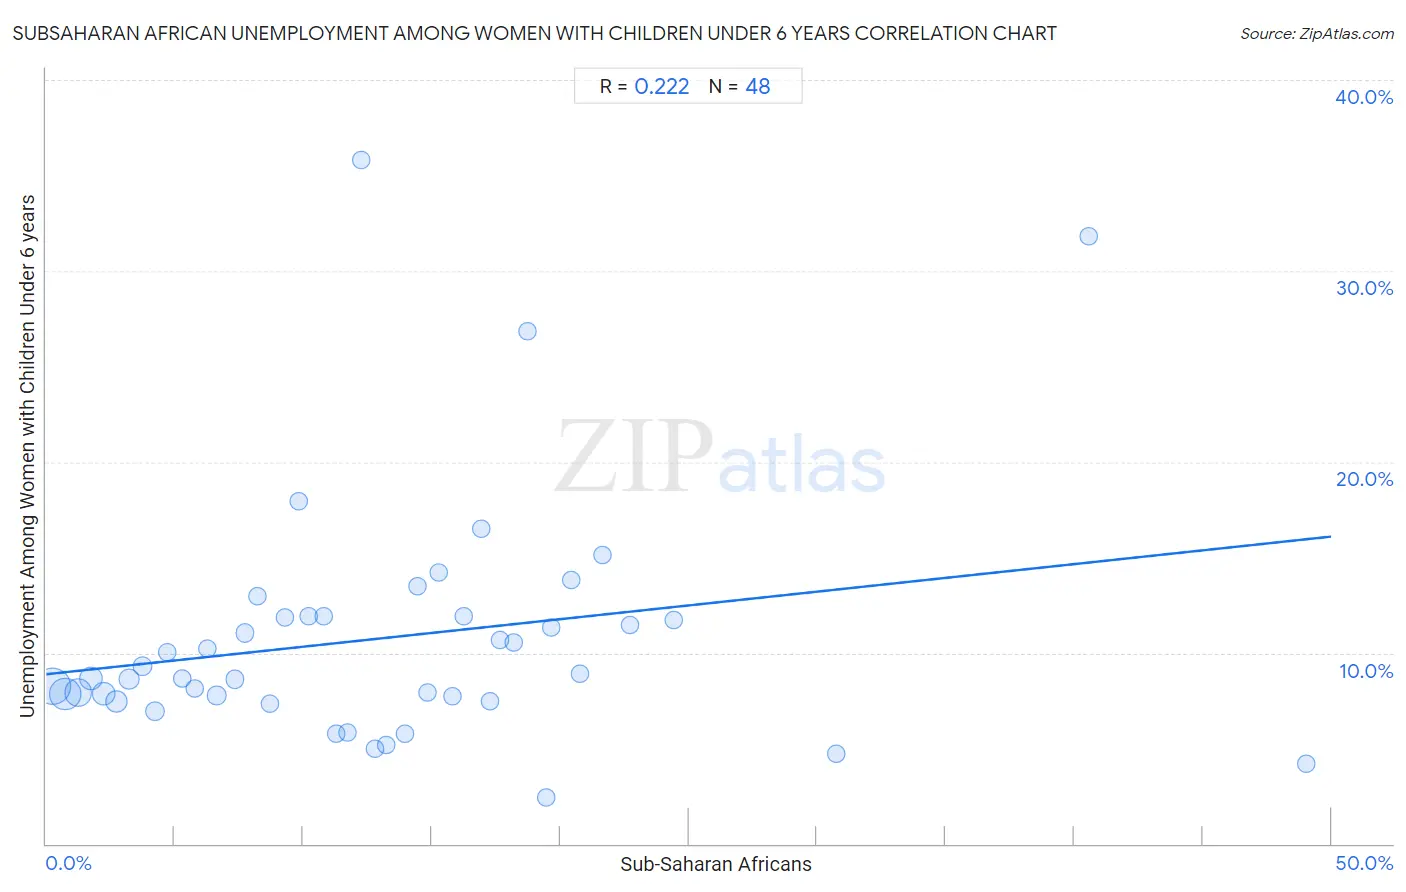
Subsaharan African Unemployment Among Women with Children Under 6 years Correlation Chart

The statistical analysis conducted on geographies consisting of 364,369,549 people shows a weak positive correlation between the proportion of Sub-Saharan Africans and unemployment rate among women with children under the age of 6 in the United States with a correlation coefficient (R) of 0.222 and weighted average of 8.4%. On average, for every 1% (one percent) increase in Sub-Saharan Africans within a typical geography, there is an increase of 0.14% in unemployment rate among women with children under the age of 6.
Subsaharan African Unemployment Among Women with Children Under 6 years
It is essential to understand that the correlation between the percentage of Sub-Saharan Africans and unemployment rate among women with children under the age of 6 does not imply a direct cause-and-effect relationship. It remains uncertain whether the presence of Sub-Saharan Africans influences an upward or downward trend in the level of unemployment rate among women with children under the age of 6 within an area, or if Sub-Saharan Africans simply ended up residing in those areas with higher or lower levels of unemployment rate among women with children under the age of 6 due to other factors.

Demographics Similar to Sub-Saharan Africans by Unemployment Among Women with Children Under 6 years

In terms of unemployment among women with children under 6 years, the demographic groups most similar to Sub-Saharan Africans are Immigrants from Haiti (8.4%, a difference of 0.090%), Belizean (8.4%, a difference of 0.10%), French Canadian (8.4%, a difference of 0.37%), Immigrants from Honduras (8.4%, a difference of 0.37%), and Honduran (8.4%, a difference of 0.42%).
DemographicsRating | RankUnemployment Among Women with Children Under 6 years
Immigrants from Liberia
0.3
/100
|
#261
Tragic
8.4%
West Indians
0.3
/100
|
#262
Tragic
8.4%
Scotch-Irish
0.3
/100
|
#263
Tragic
8.4%
Hondurans
0.3
/100
|
#264
Tragic
8.4%
French Canadians
0.3
/100
|
#265
Tragic
8.4%
Immigrants from Honduras
0.3
/100
|
#266
Tragic
8.4%
Belizeans
0.2
/100
|
#267
Tragic
8.4%
Sub-Saharan Africans
0.2
/100
|
#268
Tragic
8.4%
Immigrants from Haiti
0.2
/100
|
#269
Tragic
8.4%
Immigrants from Senegal
0.2
/100
|
#270
Tragic
8.5%
Immigrants from Congo
0.2
/100
|
#271
Tragic
8.5%
Mexican American Indians
0.1
/100
|
#272
Tragic
8.5%
Slovaks
0.1
/100
|
#273
Tragic
8.5%
Immigrants from Cameroon
0.1
/100
|
#274
Tragic
8.6%
Immigrants from Latin America
0.1
/100
|
#275
Tragic
8.6%

Subsaharan African Unemployment Among Women with Children Under 6 years Correlation Summary

MeasurementSubsaharan African DataUnemployment Among Women with Children Under 6 years Data
Minimum0.24%2.4%
Maximum49.0%35.8%
Range48.8%33.4%
Mean13.1%10.8%
Median12.0%8.8%
Interquartile 25% (IQ1)6.0%7.6%
Interquartile 75% (IQ3)17.9%11.9%
Interquartile Range (IQR)11.9%4.3%
Standard Deviation (Sample)9.8%6.4%
Standard Deviation (Population)9.7%6.3%

Correlation Details

Subsaharan African PercentileSample SizeUnemployment Among Women with Children Under 6 years
[
0.0%
-
0.5%
]
0.24%
106,578,8208.2%
[
0.5%
-
1.0%
]
0.73%
75,624,9787.8%
[
1.0%
-
1.5%
]
1.24%
55,961,8817.9%
[
1.5%
-
2.0%
]
1.73%
31,670,4708.6%
[
2.0%
-
2.5%
]
2.25%
29,159,4407.9%
[
2.5%
-
3.0%
]
2.72%
19,127,1677.5%
[
3.0%
-
3.5%
]
3.23%
10,136,9538.6%
[
3.5%
-
4.0%
]
3.76%
7,137,4749.3%
[
4.0%
-
4.5%
]
4.23%
7,355,0166.9%
[
4.5%
-
5.0%
]
4.71%
3,217,88510.0%
[
5.0%
-
5.5%
]
5.29%
3,065,0968.7%
[
5.5%
-
6.0%
]
5.77%
2,860,9278.1%
[
6.0%
-
6.5%
]
6.26%
1,712,37710.2%
[
6.5%
-
7.0%
]
6.64%
2,089,0447.8%
[
7.0%
-
7.5%
]
7.36%
1,100,3988.6%
[
7.5%
-
8.0%
]
7.74%
1,194,84811.0%
[
8.0%
-
8.5%
]
8.23%
688,70413.0%
[
8.5%
-
9.0%
]
8.72%
852,8677.3%
[
9.0%
-
9.5%
]
9.27%
788,99511.9%
[
9.5%
-
10.0%
]
9.84%
257,04118.0%
[
10.0%
-
10.5%
]
10.20%
605,49611.9%
[
10.5%
-
11.0%
]
10.78%
331,59111.9%
[
11.0%
-
11.5%
]
11.29%
470,8045.8%
[
11.5%
-
12.0%
]
11.73%
190,5925.8%
[
12.0%
-
12.5%
]
12.27%
71,55535.8%
[
12.5%
-
13.0%
]
12.77%
128,0105.0%
[
13.0%
-
13.5%
]
13.22%
374,7995.2%
[
13.5%
-
14.0%
]
13.94%
268,8295.8%
[
14.0%
-
14.5%
]
14.43%
58,67313.5%
[
14.5%
-
15.0%
]
14.82%
113,4627.9%
[
15.0%
-
15.5%
]
15.26%
130,71014.2%
[
15.5%
-
16.0%
]
15.82%
133,9307.7%
[
16.0%
-
16.5%
]
16.26%
98,96511.9%
[
16.5%
-
17.0%
]
16.92%
24,55916.5%
[
17.0%
-
17.5%
]
17.27%
68,4647.5%
[
17.5%
-
18.0%
]
17.65%
26,25310.7%
[
18.0%
-
18.5%
]
18.20%
213,85510.5%
[
18.5%
-
19.0%
]
18.74%
33,41526.9%
[
19.0%
-
19.5%
]
19.43%
241,6172.4%
[
19.5%
-
20.0%
]
19.63%
11,75711.3%
[
20.0%
-
20.5%
]
20.45%
31,15413.8%
[
20.5%
-
21.0%
]
20.76%
25,9878.9%
[
21.5%
-
22.0%
]
21.63%
31,01815.1%
[
22.5%
-
23.0%
]
22.70%
44,88411.4%
[
24.0%
-
24.5%
]
24.44%
24,79511.7%
[
30.5%
-
31.0%
]
30.74%
15,4894.7%
[
40.5%
-
41.0%
]
40.56%
9,61331.8%
[
49.0%
-
49.5%
]
49.01%
8,8924.2%