Subsaharan African Married-Couple Family Poverty
COMPARE
Subsaharan African
Select to Compare
Married-Couple Family Poverty
Subsaharan African Married-Couple Family Poverty
5.7%
POVERTY | MARRIED-COUPLE FAMILIES
4.9/ 100
METRIC RATING
229th/ 347
METRIC RANK
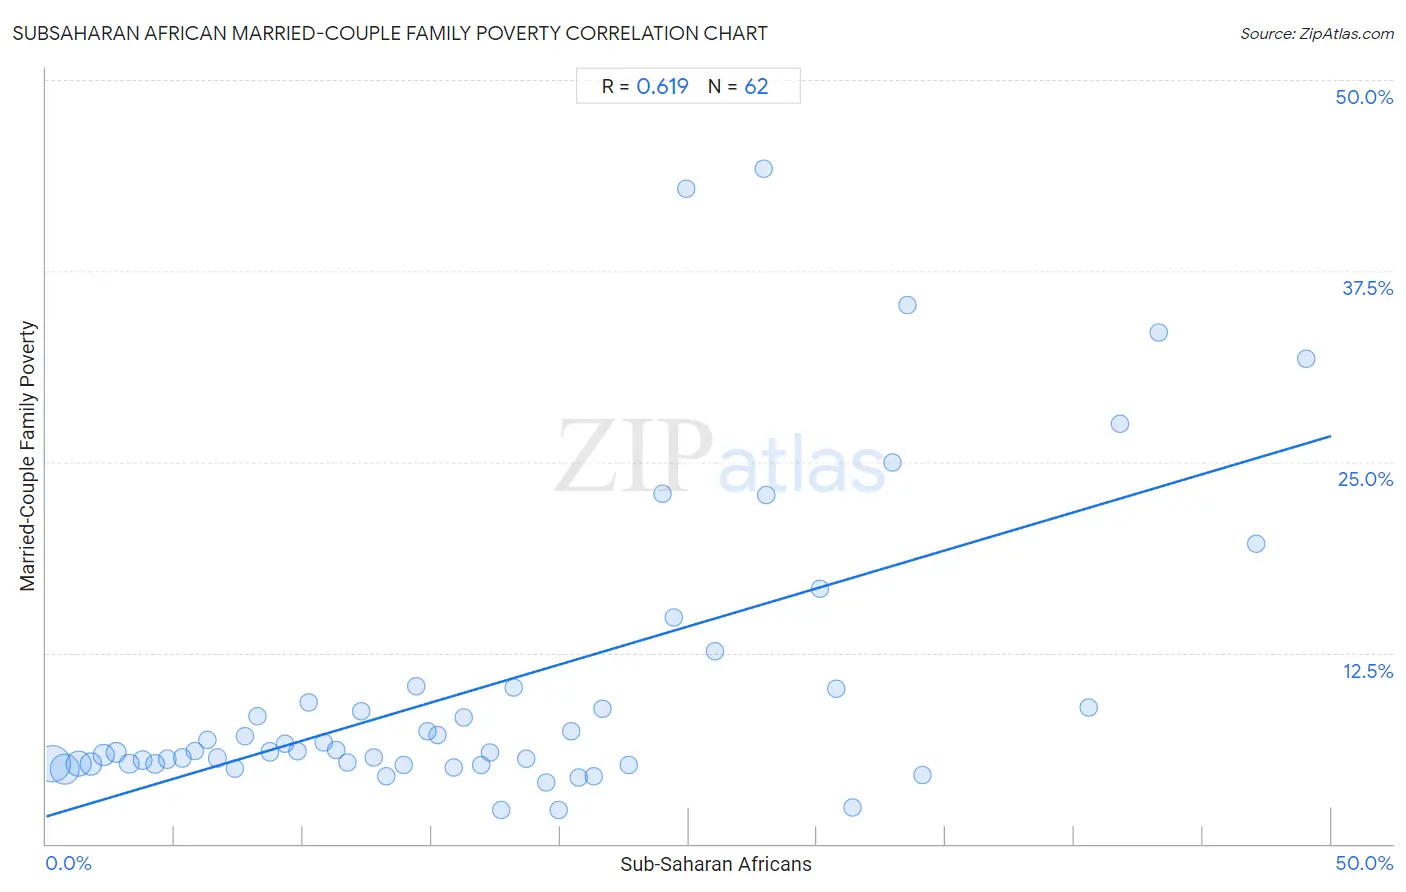
Subsaharan African Married-Couple Family Poverty Correlation Chart
The statistical analysis conducted on geographies consisting of 501,239,511 people shows a significant positive correlation between the proportion of Sub-Saharan Africans and poverty level among married-couple families in the United States with a correlation coefficient (R) of 0.619 and weighted average of 5.7%. On average, for every 1% (one percent) increase in Sub-Saharan Africans within a typical geography, there is an increase of 0.50% in poverty level among married-couple families.
It is essential to understand that the correlation between the percentage of Sub-Saharan Africans and poverty level among married-couple families does not imply a direct cause-and-effect relationship. It remains uncertain whether the presence of Sub-Saharan Africans influences an upward or downward trend in the level of poverty level among married-couple families within an area, or if Sub-Saharan Africans simply ended up residing in those areas with higher or lower levels of poverty level among married-couple families due to other factors.
Demographics Similar to Sub-Saharan Africans by Married-Couple Family Poverty
In terms of married-couple family poverty, the demographic groups most similar to Sub-Saharan Africans are Moroccan (5.7%, a difference of 0.030%), Arab (5.7%, a difference of 0.25%), Immigrants from Iraq (5.7%, a difference of 0.29%), Immigrants from Laos (5.7%, a difference of 0.35%), and Immigrants from Zaire (5.6%, a difference of 0.38%).
| Demographics | Rating | Rank | Married-Couple Family Poverty |
| Cajuns | 6.9 /100 | #222 | Tragic 5.6% |
| Immigrants from Fiji | 6.7 /100 | #223 | Tragic 5.6% |
| Sudanese | 6.4 /100 | #224 | Tragic 5.6% |
| Immigrants from Cambodia | 6.1 /100 | #225 | Tragic 5.6% |
| South Americans | 5.7 /100 | #226 | Tragic 5.6% |
| Immigrants from Zaire | 5.6 /100 | #227 | Tragic 5.6% |
| Arabs | 5.4 /100 | #228 | Tragic 5.7% |
| Sub-Saharan Africans | 4.9 /100 | #229 | Tragic 5.7% |
| Moroccans | 4.9 /100 | #230 | Tragic 5.7% |
| Immigrants from Iraq | 4.4 /100 | #231 | Tragic 5.7% |
| Immigrants from Laos | 4.4 /100 | #232 | Tragic 5.7% |
| Immigrants from Colombia | 3.7 /100 | #233 | Tragic 5.7% |
| Immigrants from Uruguay | 3.7 /100 | #234 | Tragic 5.7% |
| Immigrants from Sudan | 3.5 /100 | #235 | Tragic 5.7% |
| Ghanaians | 3.3 /100 | #236 | Tragic 5.7% |
Subsaharan African Married-Couple Family Poverty Correlation Summary
| Measurement | Subsaharan African Data | Married-Couple Family Poverty Data |
| Minimum | 0.24% | 2.2% |
| Maximum | 49.0% | 44.2% |
| Range | 48.8% | 42.0% |
| Mean | 17.4% | 10.4% |
| Median | 15.5% | 6.1% |
| Interquartile 25% (IQ1) | 7.7% | 5.2% |
| Interquartile 75% (IQ3) | 24.4% | 10.1% |
| Interquartile Range (IQR) | 16.7% | 4.9% |
| Standard Deviation (Sample) | 12.2% | 9.8% |
| Standard Deviation (Population) | 12.1% | 9.7% |
Correlation Details
| Subsaharan African Percentile | Sample Size | Married-Couple Family Poverty |
[ 0.0% - 0.5% ] 0.24% | 169,874,381 | 5.2% |
[ 0.5% - 1.0% ] 0.72% | 105,726,449 | 4.9% |
[ 1.0% - 1.5% ] 1.24% | 69,890,570 | 5.2% |
[ 1.5% - 2.0% ] 1.73% | 40,659,177 | 5.2% |
[ 2.0% - 2.5% ] 2.25% | 33,969,184 | 5.8% |
[ 2.5% - 3.0% ] 2.73% | 23,179,710 | 5.9% |
[ 3.0% - 3.5% ] 3.23% | 13,047,230 | 5.2% |
[ 3.5% - 4.0% ] 3.75% | 9,214,346 | 5.5% |
[ 4.0% - 4.5% ] 4.22% | 8,780,515 | 5.2% |
[ 4.5% - 5.0% ] 4.71% | 3,954,607 | 5.5% |
[ 5.0% - 5.5% ] 5.29% | 3,718,143 | 5.6% |
[ 5.5% - 6.0% ] 5.77% | 3,223,304 | 6.1% |
[ 6.0% - 6.5% ] 6.26% | 2,155,935 | 6.8% |
[ 6.5% - 7.0% ] 6.66% | 2,498,004 | 5.6% |
[ 7.0% - 7.5% ] 7.34% | 1,463,289 | 4.9% |
[ 7.5% - 8.0% ] 7.73% | 1,510,846 | 7.1% |
[ 8.0% - 8.5% ] 8.23% | 971,959 | 8.4% |
[ 8.5% - 9.0% ] 8.72% | 986,269 | 6.0% |
[ 9.0% - 9.5% ] 9.27% | 847,252 | 6.6% |
[ 9.5% - 10.0% ] 9.78% | 403,314 | 6.1% |
[ 10.0% - 10.5% ] 10.22% | 740,876 | 9.2% |
[ 10.5% - 11.0% ] 10.78% | 514,223 | 6.7% |
[ 11.0% - 11.5% ] 11.27% | 647,152 | 6.1% |
[ 11.5% - 12.0% ] 11.74% | 264,801 | 5.3% |
[ 12.0% - 12.5% ] 12.27% | 98,987 | 8.7% |
[ 12.5% - 13.0% ] 12.76% | 175,505 | 5.6% |
[ 13.0% - 13.5% ] 13.23% | 425,911 | 4.4% |
[ 13.5% - 14.0% ] 13.92% | 337,094 | 5.1% |
[ 14.0% - 14.5% ] 14.38% | 83,148 | 10.3% |
[ 14.5% - 15.0% ] 14.81% | 134,284 | 7.3% |
[ 15.0% - 15.5% ] 15.22% | 227,345 | 7.1% |
[ 15.5% - 16.0% ] 15.84% | 216,748 | 5.0% |
[ 16.0% - 16.5% ] 16.25% | 194,091 | 8.3% |
[ 16.5% - 17.0% ] 16.92% | 28,777 | 5.1% |
[ 17.0% - 17.5% ] 17.26% | 145,391 | 6.0% |
[ 17.5% - 18.0% ] 17.72% | 61,834 | 2.2% |
[ 18.0% - 18.5% ] 18.20% | 215,791 | 10.3% |
[ 18.5% - 19.0% ] 18.66% | 97,301 | 5.5% |
[ 19.0% - 19.5% ] 19.43% | 243,201 | 4.0% |
[ 19.5% - 20.0% ] 19.92% | 7,355 | 2.2% |
[ 20.0% - 20.5% ] 20.42% | 36,389 | 7.4% |
[ 20.5% - 21.0% ] 20.73% | 34,807 | 4.4% |
[ 21.0% - 21.5% ] 21.30% | 28,219 | 4.4% |
[ 21.5% - 22.0% ] 21.65% | 54,260 | 8.8% |
[ 22.5% - 23.0% ] 22.67% | 38,080 | 5.1% |
[ 23.5% - 24.0% ] 23.99% | 14,553 | 22.9% |
[ 24.0% - 24.5% ] 24.44% | 25,234 | 14.8% |
[ 24.5% - 25.0% ] 24.91% | 273 | 42.9% |
[ 26.0% - 26.5% ] 26.04% | 1,056 | 12.6% |
[ 27.5% - 28.0% ] 27.93% | 512 | 44.2% |
[ 28.0% - 28.5% ] 28.02% | 26,684 | 22.9% |
[ 30.0% - 30.5% ] 30.12% | 1,932 | 16.7% |
[ 30.5% - 31.0% ] 30.74% | 15,489 | 10.1% |
[ 31.0% - 31.5% ] 31.35% | 2,485 | 2.4% |
[ 32.5% - 33.0% ] 32.93% | 334 | 25.0% |
[ 33.5% - 34.0% ] 33.53% | 173 | 35.3% |
[ 34.0% - 34.5% ] 34.07% | 3,824 | 4.5% |
[ 40.5% - 41.0% ] 40.56% | 9,613 | 8.9% |
[ 41.5% - 42.0% ] 41.76% | 613 | 27.5% |
[ 43.0% - 43.5% ] 43.29% | 633 | 33.5% |
[ 47.0% - 47.5% ] 47.10% | 1,157 | 19.6% |
[ 49.0% - 49.5% ] 49.01% | 8,892 | 31.7% |