Subsaharan African Disability
COMPARE
Subsaharan African
Select to Compare
Disability
Subsaharan African Disability
12.3%
DISABILITY
1.4/ 100
METRIC RATING
250th/ 347
METRIC RANK
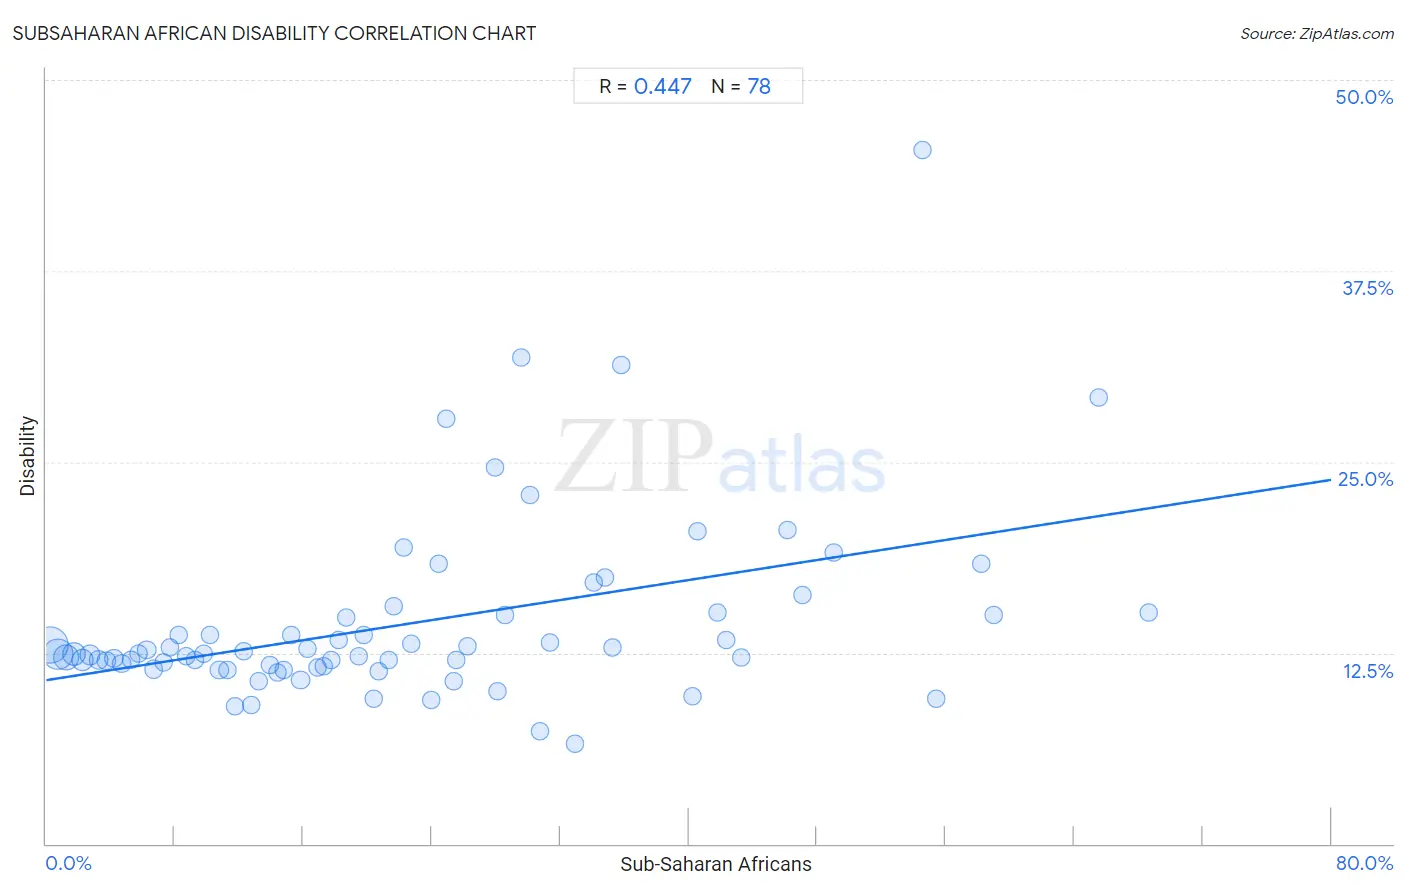
Subsaharan African Disability Correlation Chart
The statistical analysis conducted on geographies consisting of 508,103,774 people shows a moderate positive correlation between the proportion of Sub-Saharan Africans and percentage of population with a disability in the United States with a correlation coefficient (R) of 0.447 and weighted average of 12.3%. On average, for every 1% (one percent) increase in Sub-Saharan Africans within a typical geography, there is an increase of 0.16% in percentage of population with a disability.
It is essential to understand that the correlation between the percentage of Sub-Saharan Africans and percentage of population with a disability does not imply a direct cause-and-effect relationship. It remains uncertain whether the presence of Sub-Saharan Africans influences an upward or downward trend in the level of percentage of population with a disability within an area, or if Sub-Saharan Africans simply ended up residing in those areas with higher or lower levels of percentage of population with a disability due to other factors.
Demographics Similar to Sub-Saharan Africans by Disability
In terms of disability, the demographic groups most similar to Sub-Saharan Africans are European (12.3%, a difference of 0.0%), Carpatho Rusyn (12.3%, a difference of 0.010%), Guamanian/Chamorro (12.3%, a difference of 0.020%), Indonesian (12.2%, a difference of 0.060%), and Swiss (12.2%, a difference of 0.090%).
| Demographics | Rating | Rank | Disability |
| British | 1.5 /100 | #243 | Tragic 12.2% |
| Basques | 1.5 /100 | #244 | Tragic 12.2% |
| Liberians | 1.5 /100 | #245 | Tragic 12.2% |
| Swiss | 1.5 /100 | #246 | Tragic 12.2% |
| Indonesians | 1.4 /100 | #247 | Tragic 12.2% |
| Guamanians/Chamorros | 1.4 /100 | #248 | Tragic 12.3% |
| Carpatho Rusyns | 1.4 /100 | #249 | Tragic 12.3% |
| Sub-Saharan Africans | 1.4 /100 | #250 | Tragic 12.3% |
| Europeans | 1.4 /100 | #251 | Tragic 12.3% |
| Bermudans | 1.1 /100 | #252 | Tragic 12.3% |
| Belgians | 0.8 /100 | #253 | Tragic 12.3% |
| German Russians | 0.8 /100 | #254 | Tragic 12.3% |
| Slovenes | 0.6 /100 | #255 | Tragic 12.4% |
| Immigrants from Dominica | 0.6 /100 | #256 | Tragic 12.4% |
| Immigrants from Laos | 0.5 /100 | #257 | Tragic 12.4% |
Subsaharan African Disability Correlation Summary
| Measurement | Subsaharan African Data | Disability Data |
| Minimum | 0.24% | 6.6% |
| Maximum | 68.6% | 45.5% |
| Range | 68.4% | 38.9% |
| Mean | 22.7% | 14.4% |
| Median | 19.6% | 12.4% |
| Interquartile 25% (IQ1) | 9.8% | 11.6% |
| Interquartile 75% (IQ3) | 31.3% | 14.9% |
| Interquartile Range (IQR) | 21.6% | 3.3% |
| Standard Deviation (Sample) | 16.6% | 6.1% |
| Standard Deviation (Population) | 16.5% | 6.0% |
Correlation Details
| Subsaharan African Percentile | Sample Size | Disability |
[ 0.0% - 0.5% ] 0.24% | 172,475,769 | 13.0% |
[ 0.5% - 1.0% ] 0.72% | 106,976,675 | 12.4% |
[ 1.0% - 1.5% ] 1.24% | 70,722,436 | 12.2% |
[ 1.5% - 2.0% ] 1.73% | 41,281,047 | 12.4% |
[ 2.0% - 2.5% ] 2.25% | 34,311,289 | 12.1% |
[ 2.5% - 3.0% ] 2.73% | 23,422,826 | 12.4% |
[ 3.0% - 3.5% ] 3.23% | 13,254,736 | 12.0% |
[ 3.5% - 4.0% ] 3.75% | 9,300,763 | 12.0% |
[ 4.0% - 4.5% ] 4.22% | 8,860,813 | 12.1% |
[ 4.5% - 5.0% ] 4.71% | 4,064,586 | 11.8% |
[ 5.0% - 5.5% ] 5.29% | 3,777,433 | 12.0% |
[ 5.5% - 6.0% ] 5.77% | 3,296,686 | 12.4% |
[ 6.0% - 6.5% ] 6.26% | 2,200,863 | 12.7% |
[ 6.5% - 7.0% ] 6.66% | 2,517,898 | 11.4% |
[ 7.0% - 7.5% ] 7.34% | 1,490,449 | 11.9% |
[ 7.5% - 8.0% ] 7.73% | 1,551,571 | 12.9% |
[ 8.0% - 8.5% ] 8.23% | 994,060 | 13.7% |
[ 8.5% - 9.0% ] 8.72% | 993,111 | 12.3% |
[ 9.0% - 9.5% ] 9.27% | 872,916 | 12.1% |
[ 9.5% - 10.0% ] 9.78% | 413,661 | 12.5% |
[ 10.0% - 10.5% ] 10.22% | 754,219 | 13.7% |
[ 10.5% - 11.0% ] 10.78% | 532,160 | 11.4% |
[ 11.0% - 11.5% ] 11.27% | 653,092 | 11.4% |
[ 11.5% - 12.0% ] 11.75% | 279,205 | 9.0% |
[ 12.0% - 12.5% ] 12.27% | 101,158 | 12.6% |
[ 12.5% - 13.0% ] 12.77% | 185,624 | 9.1% |
[ 13.0% - 13.5% ] 13.23% | 438,997 | 10.6% |
[ 13.5% - 14.0% ] 13.91% | 351,800 | 11.7% |
[ 14.0% - 14.5% ] 14.38% | 83,868 | 11.2% |
[ 14.5% - 15.0% ] 14.81% | 134,427 | 11.4% |
[ 15.0% - 15.5% ] 15.22% | 236,255 | 13.7% |
[ 15.5% - 16.0% ] 15.84% | 217,851 | 10.7% |
[ 16.0% - 16.5% ] 16.25% | 194,429 | 12.7% |
[ 16.5% - 17.0% ] 16.91% | 30,595 | 11.5% |
[ 17.0% - 17.5% ] 17.26% | 145,501 | 11.6% |
[ 17.5% - 18.0% ] 17.73% | 65,973 | 12.0% |
[ 18.0% - 18.5% ] 18.20% | 221,308 | 13.3% |
[ 18.5% - 19.0% ] 18.66% | 97,301 | 14.8% |
[ 19.0% - 19.5% ] 19.43% | 243,304 | 12.3% |
[ 19.5% - 20.0% ] 19.74% | 20,175 | 13.7% |
[ 20.0% - 20.5% ] 20.40% | 38,685 | 9.5% |
[ 20.5% - 21.0% ] 20.73% | 34,831 | 11.3% |
[ 21.0% - 21.5% ] 21.30% | 28,219 | 12.0% |
[ 21.5% - 22.0% ] 21.65% | 54,524 | 15.5% |
[ 22.0% - 22.5% ] 22.26% | 283 | 19.4% |
[ 22.5% - 23.0% ] 22.71% | 52,239 | 13.1% |
[ 23.5% - 24.0% ] 23.99% | 14,696 | 9.5% |
[ 24.0% - 24.5% ] 24.43% | 25,333 | 18.3% |
[ 24.5% - 25.0% ] 24.91% | 273 | 27.8% |
[ 25.0% - 25.5% ] 25.38% | 658 | 10.6% |
[ 25.5% - 26.0% ] 25.54% | 881 | 12.0% |
[ 26.0% - 26.5% ] 26.24% | 2,138 | 13.0% |
[ 27.5% - 28.0% ] 27.93% | 512 | 24.6% |
[ 28.0% - 28.5% ] 28.06% | 29,898 | 10.0% |
[ 28.5% - 29.0% ] 28.57% | 154 | 14.9% |
[ 29.5% - 30.0% ] 29.55% | 44 | 31.8% |
[ 30.0% - 30.5% ] 30.14% | 2,037 | 22.8% |
[ 30.5% - 31.0% ] 30.74% | 15,489 | 7.4% |
[ 31.0% - 31.5% ] 31.35% | 2,485 | 13.2% |
[ 32.5% - 33.0% ] 32.93% | 334 | 6.6% |
[ 34.0% - 34.5% ] 34.07% | 3,824 | 17.1% |
[ 34.5% - 35.0% ] 34.78% | 46 | 17.4% |
[ 35.0% - 35.5% ] 35.23% | 1,286 | 12.8% |
[ 35.5% - 36.0% ] 35.82% | 67 | 31.3% |
[ 40.0% - 40.5% ] 40.22% | 4,572 | 9.7% |
[ 40.5% - 41.0% ] 40.56% | 9,613 | 20.4% |
[ 41.5% - 42.0% ] 41.76% | 613 | 15.2% |
[ 42.0% - 42.5% ] 42.31% | 338 | 13.3% |
[ 43.0% - 43.5% ] 43.29% | 633 | 12.2% |
[ 46.0% - 46.5% ] 46.15% | 78 | 20.5% |
[ 47.0% - 47.5% ] 47.10% | 1,157 | 16.2% |
[ 49.0% - 49.5% ] 49.02% | 9,074 | 19.1% |
[ 54.5% - 55.0% ] 54.55% | 11 | 45.5% |
[ 55.0% - 55.5% ] 55.41% | 231 | 9.5% |
[ 58.0% - 58.5% ] 58.19% | 574 | 18.3% |
[ 59.0% - 59.5% ] 59.02% | 549 | 14.9% |
[ 65.5% - 66.0% ] 65.55% | 479 | 29.2% |
[ 68.5% - 69.0% ] 68.60% | 86 | 15.1% |