Subsaharan African Ambulatory Disability
COMPARE
Subsaharan African
Select to Compare
Ambulatory Disability
Subsaharan African Ambulatory Disability
6.4%
AMBULATORY DISABILITY
2.3/ 100
METRIC RATING
233rd/ 347
METRIC RANK
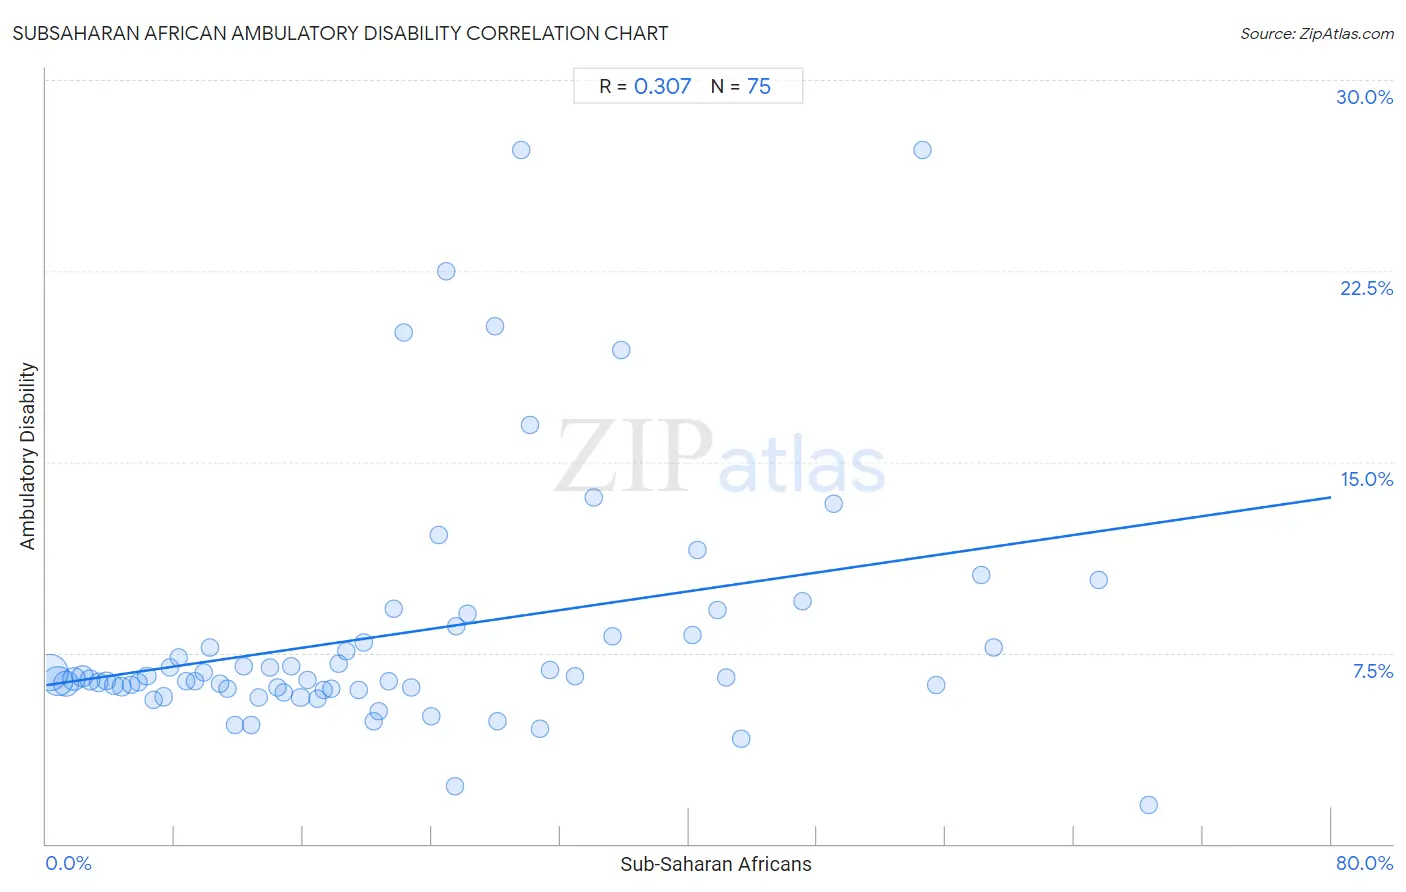
Subsaharan African Ambulatory Disability Correlation Chart
The statistical analysis conducted on geographies consisting of 507,846,771 people shows a mild positive correlation between the proportion of Sub-Saharan Africans and percentage of population with ambulatory disability in the United States with a correlation coefficient (R) of 0.307 and weighted average of 6.4%. On average, for every 1% (one percent) increase in Sub-Saharan Africans within a typical geography, there is an increase of 0.092% in percentage of population with ambulatory disability.
It is essential to understand that the correlation between the percentage of Sub-Saharan Africans and percentage of population with ambulatory disability does not imply a direct cause-and-effect relationship. It remains uncertain whether the presence of Sub-Saharan Africans influences an upward or downward trend in the level of percentage of population with ambulatory disability within an area, or if Sub-Saharan Africans simply ended up residing in those areas with higher or lower levels of percentage of population with ambulatory disability due to other factors.
Demographics Similar to Sub-Saharan Africans by Ambulatory Disability
In terms of ambulatory disability, the demographic groups most similar to Sub-Saharan Africans are Immigrants from Liberia (6.4%, a difference of 0.030%), Assyrian/Chaldean/Syriac (6.4%, a difference of 0.060%), Hispanic or Latino (6.4%, a difference of 0.060%), Dutch (6.4%, a difference of 0.21%), and Immigrants from Germany (6.4%, a difference of 0.30%).
| Demographics | Rating | Rank | Ambulatory Disability |
| Slavs | 5.1 /100 | #226 | Tragic 6.4% |
| Cubans | 4.0 /100 | #227 | Tragic 6.4% |
| Portuguese | 4.0 /100 | #228 | Tragic 6.4% |
| Czechoslovakians | 3.8 /100 | #229 | Tragic 6.4% |
| Mexicans | 3.5 /100 | #230 | Tragic 6.4% |
| Panamanians | 3.1 /100 | #231 | Tragic 6.4% |
| Assyrians/Chaldeans/Syriacs | 2.4 /100 | #232 | Tragic 6.4% |
| Sub-Saharan Africans | 2.3 /100 | #233 | Tragic 6.4% |
| Immigrants from Liberia | 2.3 /100 | #234 | Tragic 6.4% |
| Hispanics or Latinos | 2.2 /100 | #235 | Tragic 6.4% |
| Dutch | 2.0 /100 | #236 | Tragic 6.4% |
| Immigrants from Germany | 1.8 /100 | #237 | Tragic 6.4% |
| Haitians | 1.8 /100 | #238 | Tragic 6.4% |
| Senegalese | 1.7 /100 | #239 | Tragic 6.4% |
| Immigrants from Senegal | 1.7 /100 | #240 | Tragic 6.4% |
Subsaharan African Ambulatory Disability Correlation Summary
| Measurement | Subsaharan African Data | Ambulatory Disability Data |
| Minimum | 0.24% | 1.5% |
| Maximum | 68.6% | 27.3% |
| Range | 68.4% | 25.7% |
| Mean | 22.2% | 8.3% |
| Median | 18.7% | 6.5% |
| Interquartile 25% (IQ1) | 9.3% | 6.1% |
| Interquartile 75% (IQ3) | 30.7% | 8.2% |
| Interquartile Range (IQR) | 21.5% | 2.1% |
| Standard Deviation (Sample) | 16.6% | 5.0% |
| Standard Deviation (Population) | 16.5% | 4.9% |
Correlation Details
| Subsaharan African Percentile | Sample Size | Ambulatory Disability |
[ 0.0% - 0.5% ] 0.24% | 172,423,513 | 6.7% |
[ 0.5% - 1.0% ] 0.72% | 106,936,665 | 6.4% |
[ 1.0% - 1.5% ] 1.24% | 70,684,750 | 6.3% |
[ 1.5% - 2.0% ] 1.73% | 41,245,780 | 6.5% |
[ 2.0% - 2.5% ] 2.25% | 34,294,322 | 6.6% |
[ 2.5% - 3.0% ] 2.73% | 23,399,405 | 6.4% |
[ 3.0% - 3.5% ] 3.23% | 13,234,614 | 6.3% |
[ 3.5% - 4.0% ] 3.75% | 9,300,602 | 6.4% |
[ 4.0% - 4.5% ] 4.22% | 8,854,201 | 6.2% |
[ 4.5% - 5.0% ] 4.71% | 4,060,915 | 6.2% |
[ 5.0% - 5.5% ] 5.29% | 3,774,574 | 6.2% |
[ 5.5% - 6.0% ] 5.77% | 3,293,800 | 6.4% |
[ 6.0% - 6.5% ] 6.26% | 2,200,755 | 6.6% |
[ 6.5% - 7.0% ] 6.66% | 2,516,133 | 5.7% |
[ 7.0% - 7.5% ] 7.34% | 1,489,467 | 5.8% |
[ 7.5% - 8.0% ] 7.73% | 1,551,432 | 6.9% |
[ 8.0% - 8.5% ] 8.23% | 992,504 | 7.3% |
[ 8.5% - 9.0% ] 8.72% | 992,684 | 6.4% |
[ 9.0% - 9.5% ] 9.27% | 871,128 | 6.4% |
[ 9.5% - 10.0% ] 9.78% | 413,452 | 6.7% |
[ 10.0% - 10.5% ] 10.22% | 753,267 | 7.7% |
[ 10.5% - 11.0% ] 10.78% | 527,950 | 6.3% |
[ 11.0% - 11.5% ] 11.27% | 653,092 | 6.1% |
[ 11.5% - 12.0% ] 11.75% | 279,205 | 4.7% |
[ 12.0% - 12.5% ] 12.27% | 100,105 | 7.0% |
[ 12.5% - 13.0% ] 12.77% | 185,624 | 4.7% |
[ 13.0% - 13.5% ] 13.23% | 438,997 | 5.7% |
[ 13.5% - 14.0% ] 13.91% | 351,400 | 6.9% |
[ 14.0% - 14.5% ] 14.38% | 83,868 | 6.1% |
[ 14.5% - 15.0% ] 14.81% | 134,284 | 6.0% |
[ 15.0% - 15.5% ] 15.22% | 236,255 | 7.0% |
[ 15.5% - 16.0% ] 15.84% | 217,851 | 5.7% |
[ 16.0% - 16.5% ] 16.25% | 194,429 | 6.4% |
[ 16.5% - 17.0% ] 16.91% | 30,595 | 5.7% |
[ 17.0% - 17.5% ] 17.26% | 145,391 | 6.1% |
[ 17.5% - 18.0% ] 17.73% | 65,973 | 6.1% |
[ 18.0% - 18.5% ] 18.20% | 221,308 | 7.1% |
[ 18.5% - 19.0% ] 18.66% | 97,301 | 7.5% |
[ 19.0% - 19.5% ] 19.43% | 243,304 | 6.1% |
[ 19.5% - 20.0% ] 19.74% | 20,074 | 7.9% |
[ 20.0% - 20.5% ] 20.40% | 38,685 | 4.8% |
[ 20.5% - 21.0% ] 20.73% | 34,831 | 5.2% |
[ 21.0% - 21.5% ] 21.30% | 28,219 | 6.4% |
[ 21.5% - 22.0% ] 21.65% | 54,524 | 9.2% |
[ 22.0% - 22.5% ] 22.26% | 283 | 20.1% |
[ 22.5% - 23.0% ] 22.71% | 51,871 | 6.1% |
[ 23.5% - 24.0% ] 23.99% | 14,696 | 5.0% |
[ 24.0% - 24.5% ] 24.43% | 25,333 | 12.1% |
[ 24.5% - 25.0% ] 24.91% | 273 | 22.5% |
[ 25.0% - 25.5% ] 25.47% | 267 | 2.2% |
[ 25.5% - 26.0% ] 25.54% | 881 | 8.6% |
[ 26.0% - 26.5% ] 26.24% | 2,138 | 9.1% |
[ 27.5% - 28.0% ] 27.93% | 512 | 20.3% |
[ 28.0% - 28.5% ] 28.06% | 29,898 | 4.8% |
[ 29.5% - 30.0% ] 29.55% | 44 | 27.3% |
[ 30.0% - 30.5% ] 30.12% | 1,932 | 16.4% |
[ 30.5% - 31.0% ] 30.74% | 15,489 | 4.5% |
[ 31.0% - 31.5% ] 31.35% | 2,485 | 6.8% |
[ 32.5% - 33.0% ] 32.93% | 334 | 6.6% |
[ 34.0% - 34.5% ] 34.07% | 3,824 | 13.6% |
[ 35.0% - 35.5% ] 35.23% | 1,286 | 8.1% |
[ 35.5% - 36.0% ] 35.82% | 67 | 19.4% |
[ 40.0% - 40.5% ] 40.22% | 4,572 | 8.2% |
[ 40.5% - 41.0% ] 40.56% | 9,613 | 11.5% |
[ 41.5% - 42.0% ] 41.76% | 613 | 9.2% |
[ 42.0% - 42.5% ] 42.31% | 338 | 6.5% |
[ 43.0% - 43.5% ] 43.29% | 633 | 4.1% |
[ 47.0% - 47.5% ] 47.10% | 1,157 | 9.5% |
[ 49.0% - 49.5% ] 49.02% | 9,074 | 13.4% |
[ 54.5% - 55.0% ] 54.55% | 11 | 27.3% |
[ 55.0% - 55.5% ] 55.41% | 231 | 6.2% |
[ 58.0% - 58.5% ] 58.19% | 574 | 10.6% |
[ 59.0% - 59.5% ] 59.02% | 549 | 7.7% |
[ 65.5% - 66.0% ] 65.55% | 479 | 10.4% |
[ 68.5% - 69.0% ] 68.60% | 86 | 1.5% |