Subsaharan African Single Mother Households
COMPARE
Subsaharan African
Select to Compare
Single Mother Households
Subsaharan African Single Mother Households
7.8%
SINGLE MOTHER HOUSEHOLDS
0.0/ 100
METRIC RATING
289th/ 347
METRIC RANK
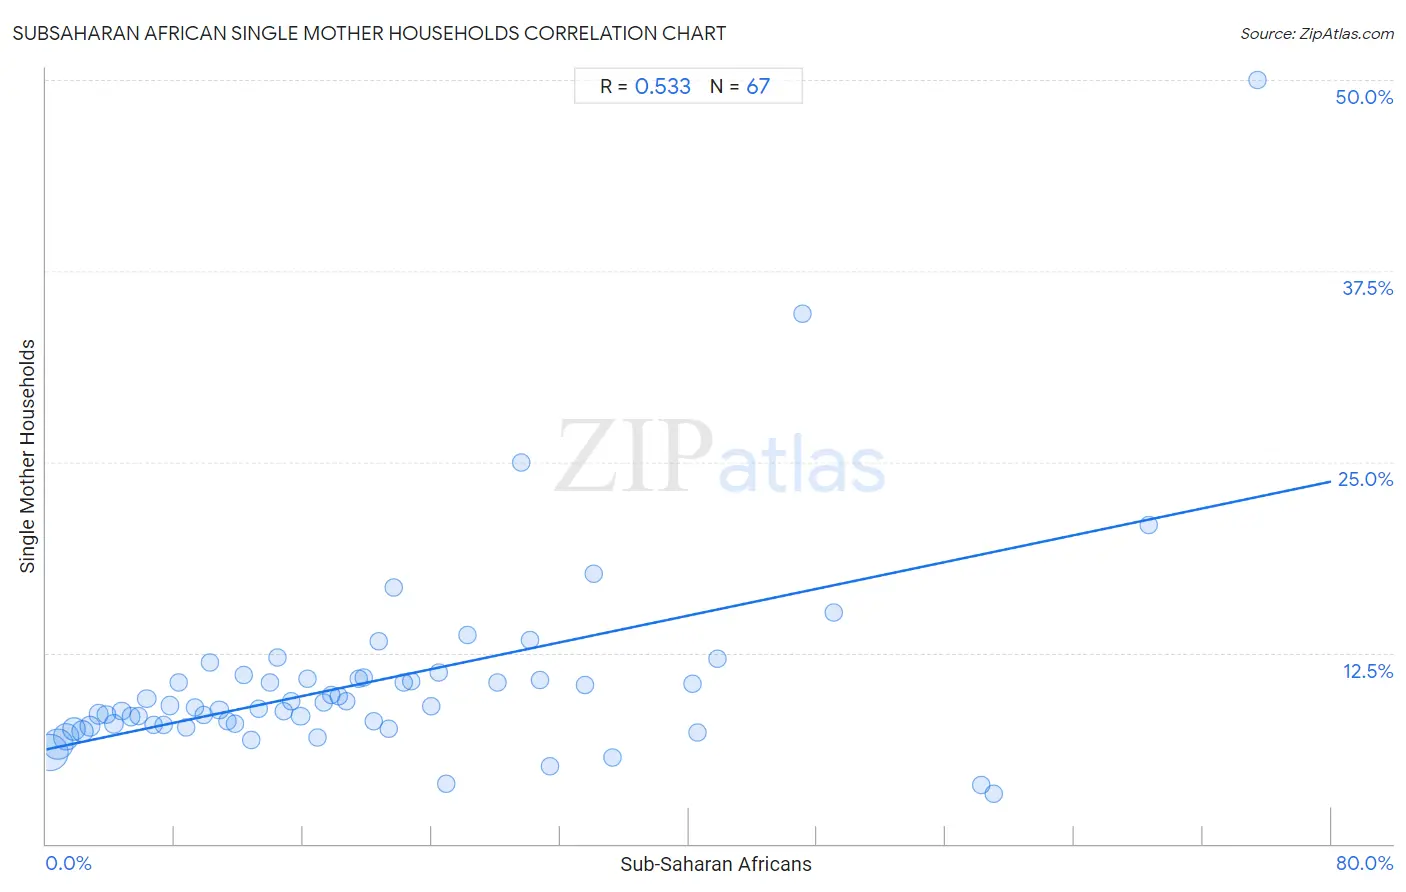
Subsaharan African Single Mother Households Correlation Chart
The statistical analysis conducted on geographies consisting of 505,994,563 people shows a substantial positive correlation between the proportion of Sub-Saharan Africans and percentage of single mother households in the United States with a correlation coefficient (R) of 0.533 and weighted average of 7.8%. On average, for every 1% (one percent) increase in Sub-Saharan Africans within a typical geography, there is an increase of 0.22% in percentage of single mother households.
It is essential to understand that the correlation between the percentage of Sub-Saharan Africans and percentage of single mother households does not imply a direct cause-and-effect relationship. It remains uncertain whether the presence of Sub-Saharan Africans influences an upward or downward trend in the level of percentage of single mother households within an area, or if Sub-Saharan Africans simply ended up residing in those areas with higher or lower levels of percentage of single mother households due to other factors.
Demographics Similar to Sub-Saharan Africans by Single Mother Households
In terms of single mother households, the demographic groups most similar to Sub-Saharan Africans are Immigrants from Nigeria (7.8%, a difference of 0.42%), West Indian (7.8%, a difference of 0.50%), Ghanaian (7.8%, a difference of 0.51%), Immigrants from Cameroon (7.9%, a difference of 0.87%), and Sierra Leonean (7.7%, a difference of 0.92%).
| Demographics | Rating | Rank | Single Mother Households |
| Guatemalans | 0.0 /100 | #282 | Tragic 7.7% |
| Nigerians | 0.0 /100 | #283 | Tragic 7.7% |
| Immigrants from Belize | 0.0 /100 | #284 | Tragic 7.7% |
| Trinidadians and Tobagonians | 0.0 /100 | #285 | Tragic 7.7% |
| Immigrants from Middle Africa | 0.0 /100 | #286 | Tragic 7.7% |
| Immigrants from Guatemala | 0.0 /100 | #287 | Tragic 7.7% |
| Sierra Leoneans | 0.0 /100 | #288 | Tragic 7.7% |
| Sub-Saharan Africans | 0.0 /100 | #289 | Tragic 7.8% |
| Immigrants from Nigeria | 0.0 /100 | #290 | Tragic 7.8% |
| West Indians | 0.0 /100 | #291 | Tragic 7.8% |
| Ghanaians | 0.0 /100 | #292 | Tragic 7.8% |
| Immigrants from Cameroon | 0.0 /100 | #293 | Tragic 7.9% |
| Apache | 0.0 /100 | #294 | Tragic 7.9% |
| Barbadians | 0.0 /100 | #295 | Tragic 7.9% |
| Immigrants from Latin America | 0.0 /100 | #296 | Tragic 7.9% |
Subsaharan African Single Mother Households Correlation Summary
| Measurement | Subsaharan African Data | Single Mother Households Data |
| Minimum | 0.24% | 3.2% |
| Maximum | 75.4% | 50.0% |
| Range | 75.2% | 46.8% |
| Mean | 20.3% | 10.6% |
| Median | 16.9% | 9.0% |
| Interquartile 25% (IQ1) | 8.2% | 7.8% |
| Interquartile 75% (IQ3) | 28.1% | 10.8% |
| Interquartile Range (IQR) | 19.8% | 3.0% |
| Standard Deviation (Sample) | 16.4% | 6.8% |
| Standard Deviation (Population) | 16.3% | 6.7% |
Correlation Details
| Subsaharan African Percentile | Sample Size | Single Mother Households |
[ 0.0% - 0.5% ] 0.24% | 171,581,850 | 6.0% |
[ 0.5% - 1.0% ] 0.72% | 106,674,797 | 6.5% |
[ 1.0% - 1.5% ] 1.24% | 70,462,926 | 7.0% |
[ 1.5% - 2.0% ] 1.73% | 41,139,643 | 7.5% |
[ 2.0% - 2.5% ] 2.25% | 34,193,285 | 7.4% |
[ 2.5% - 3.0% ] 2.73% | 23,336,481 | 7.7% |
[ 3.0% - 3.5% ] 3.23% | 13,185,257 | 8.5% |
[ 3.5% - 4.0% ] 3.75% | 9,250,696 | 8.5% |
[ 4.0% - 4.5% ] 4.22% | 8,831,499 | 7.9% |
[ 4.5% - 5.0% ] 4.71% | 4,051,371 | 8.7% |
[ 5.0% - 5.5% ] 5.29% | 3,755,289 | 8.3% |
[ 5.5% - 6.0% ] 5.77% | 3,283,296 | 8.3% |
[ 6.0% - 6.5% ] 6.26% | 2,193,845 | 9.5% |
[ 6.5% - 7.0% ] 6.66% | 2,505,068 | 7.8% |
[ 7.0% - 7.5% ] 7.34% | 1,480,609 | 7.8% |
[ 7.5% - 8.0% ] 7.73% | 1,544,008 | 9.0% |
[ 8.0% - 8.5% ] 8.23% | 985,486 | 10.5% |
[ 8.5% - 9.0% ] 8.72% | 991,078 | 7.6% |
[ 9.0% - 9.5% ] 9.27% | 864,121 | 8.9% |
[ 9.5% - 10.0% ] 9.78% | 405,480 | 8.5% |
[ 10.0% - 10.5% ] 10.22% | 752,414 | 11.9% |
[ 10.5% - 11.0% ] 10.78% | 523,976 | 8.7% |
[ 11.0% - 11.5% ] 11.27% | 652,179 | 8.0% |
[ 11.5% - 12.0% ] 11.75% | 276,002 | 7.8% |
[ 12.0% - 12.5% ] 12.27% | 96,712 | 11.1% |
[ 12.5% - 13.0% ] 12.77% | 185,037 | 6.8% |
[ 13.0% - 13.5% ] 13.23% | 438,825 | 8.9% |
[ 13.5% - 14.0% ] 13.92% | 339,882 | 10.6% |
[ 14.0% - 14.5% ] 14.38% | 83,590 | 12.2% |
[ 14.5% - 15.0% ] 14.82% | 130,770 | 8.7% |
[ 15.0% - 15.5% ] 15.22% | 236,255 | 9.3% |
[ 15.5% - 16.0% ] 15.84% | 217,851 | 8.3% |
[ 16.0% - 16.5% ] 16.25% | 194,091 | 10.8% |
[ 16.5% - 17.0% ] 16.92% | 28,835 | 7.0% |
[ 17.0% - 17.5% ] 17.26% | 144,896 | 9.2% |
[ 17.5% - 18.0% ] 17.73% | 65,899 | 9.8% |
[ 18.0% - 18.5% ] 18.20% | 220,571 | 9.7% |
[ 18.5% - 19.0% ] 18.66% | 97,301 | 9.3% |
[ 19.0% - 19.5% ] 19.43% | 243,201 | 10.8% |
[ 19.5% - 20.0% ] 19.74% | 19,821 | 10.9% |
[ 20.0% - 20.5% ] 20.40% | 38,309 | 8.0% |
[ 20.5% - 21.0% ] 20.73% | 34,441 | 13.3% |
[ 21.0% - 21.5% ] 21.30% | 28,219 | 7.5% |
[ 21.5% - 22.0% ] 21.65% | 54,524 | 16.8% |
[ 22.0% - 22.5% ] 22.26% | 283 | 10.5% |
[ 22.5% - 23.0% ] 22.71% | 51,660 | 10.7% |
[ 23.5% - 24.0% ] 23.99% | 14,553 | 9.0% |
[ 24.0% - 24.5% ] 24.44% | 24,795 | 11.2% |
[ 24.5% - 25.0% ] 24.91% | 273 | 4.0% |
[ 26.0% - 26.5% ] 26.24% | 2,069 | 13.6% |
[ 28.0% - 28.5% ] 28.06% | 29,898 | 10.5% |
[ 29.5% - 30.0% ] 29.55% | 44 | 25.0% |
[ 30.0% - 30.5% ] 30.12% | 1,932 | 13.3% |
[ 30.5% - 31.0% ] 30.74% | 15,489 | 10.8% |
[ 31.0% - 31.5% ] 31.35% | 2,485 | 5.1% |
[ 33.5% - 34.0% ] 33.53% | 173 | 10.4% |
[ 34.0% - 34.5% ] 34.07% | 3,824 | 17.7% |
[ 35.0% - 35.5% ] 35.23% | 1,286 | 5.7% |
[ 40.0% - 40.5% ] 40.22% | 4,572 | 10.5% |
[ 40.5% - 41.0% ] 40.56% | 9,613 | 7.3% |
[ 41.5% - 42.0% ] 41.76% | 613 | 12.1% |
[ 47.0% - 47.5% ] 47.10% | 1,157 | 34.7% |
[ 49.0% - 49.5% ] 49.01% | 8,892 | 15.2% |
[ 58.0% - 58.5% ] 58.19% | 574 | 3.8% |
[ 59.0% - 59.5% ] 59.02% | 549 | 3.2% |
[ 68.5% - 69.0% ] 68.60% | 86 | 20.8% |
[ 75.0% - 75.5% ] 75.44% | 57 | 50.0% |