Ecuadorian Married-couple Households
COMPARE
Ecuadorian
Select to Compare
Married-couple Households
Ecuadorian Married-couple Households
43.5%
MARRIED-COUPLE HOUSEHOLDS
0.1/ 100
METRIC RATING
266th/ 347
METRIC RANK
Ecuadorian Married-couple Households Correlation Chart
The statistical analysis conducted on geographies consisting of 317,636,169 people shows a substantial positive correlation between the proportion of Ecuadorians and percentage of married-couple family households in the United States with a correlation coefficient (R) of 0.557 and weighted average of 43.5%. On average, for every 1% (one percent) increase in Ecuadorians within a typical geography, there is an increase of 0.57% in percentage of married-couple family households.
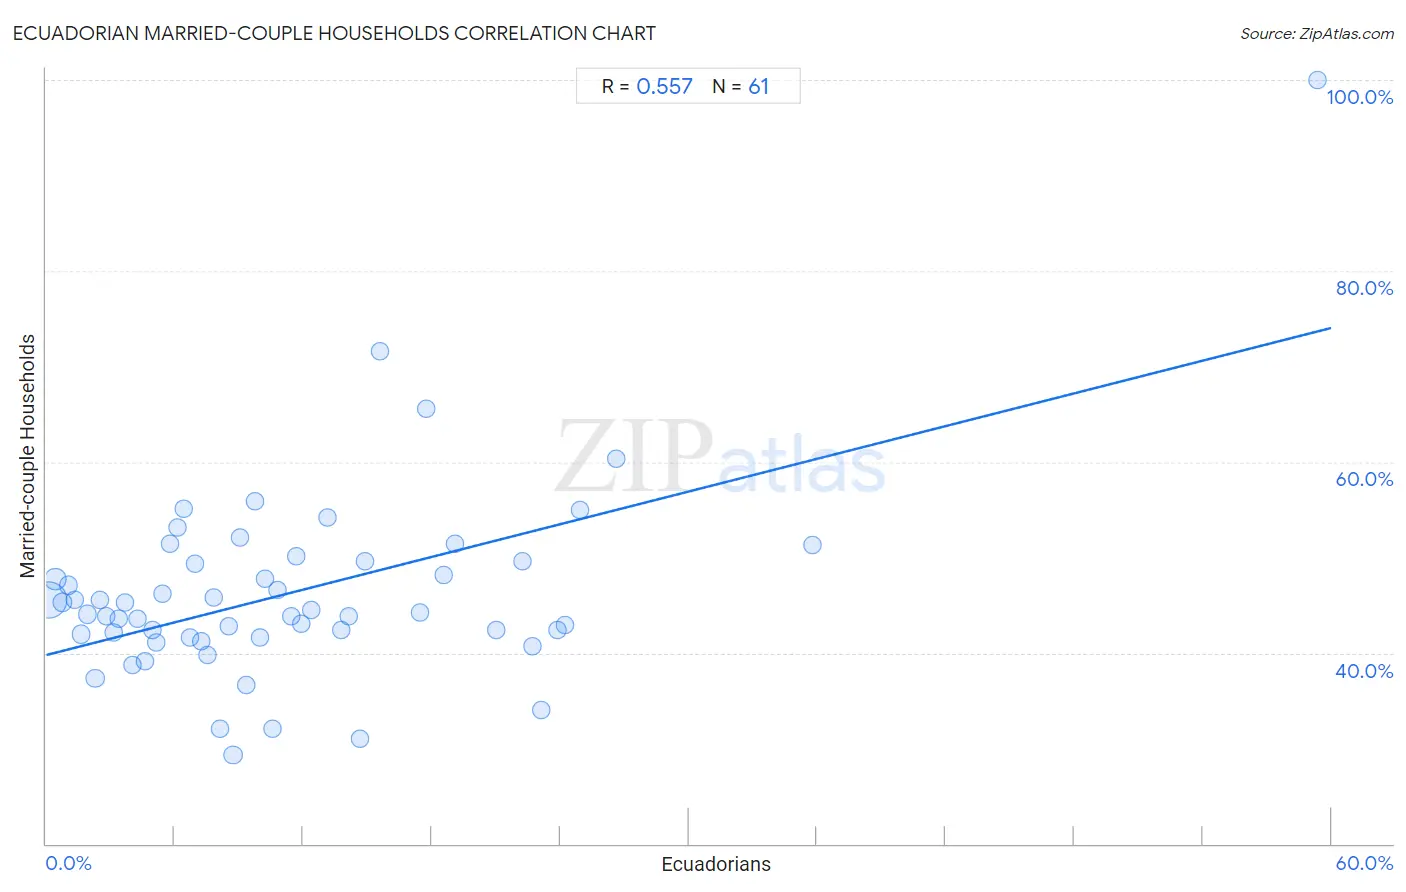
It is essential to understand that the correlation between the percentage of Ecuadorians and percentage of married-couple family households does not imply a direct cause-and-effect relationship. It remains uncertain whether the presence of Ecuadorians influences an upward or downward trend in the level of percentage of married-couple family households within an area, or if Ecuadorians simply ended up residing in those areas with higher or lower levels of percentage of married-couple family households due to other factors.
Demographics Similar to Ecuadorians by Married-couple Households
In terms of married-couple households, the demographic groups most similar to Ecuadorians are Moroccan (43.5%, a difference of 0.040%), Native/Alaskan (43.5%, a difference of 0.050%), Bangladeshi (43.5%, a difference of 0.12%), Immigrants from Burma/Myanmar (43.4%, a difference of 0.15%), and Cree (43.6%, a difference of 0.23%).
| Demographics | Rating | Rank | Married-couple Households |
| Iroquois | 0.2 /100 | #259 | Tragic 43.7% |
| Immigrants from Cameroon | 0.2 /100 | #260 | Tragic 43.7% |
| Alaskan Athabascans | 0.2 /100 | #261 | Tragic 43.6% |
| Vietnamese | 0.2 /100 | #262 | Tragic 43.6% |
| Cree | 0.1 /100 | #263 | Tragic 43.6% |
| Bangladeshis | 0.1 /100 | #264 | Tragic 43.5% |
| Moroccans | 0.1 /100 | #265 | Tragic 43.5% |
| Ecuadorians | 0.1 /100 | #266 | Tragic 43.5% |
| Natives/Alaskans | 0.1 /100 | #267 | Tragic 43.5% |
| Immigrants from Burma/Myanmar | 0.1 /100 | #268 | Tragic 43.4% |
| Immigrants from Sierra Leone | 0.1 /100 | #269 | Tragic 43.3% |
| Yuman | 0.1 /100 | #270 | Tragic 43.3% |
| Guatemalans | 0.1 /100 | #271 | Tragic 43.3% |
| Immigrants from Nigeria | 0.1 /100 | #272 | Tragic 43.2% |
| Ethiopians | 0.1 /100 | #273 | Tragic 43.2% |
Ecuadorian Married-couple Households Correlation Summary
| Measurement | Ecuadorian Data | Married-couple Households Data |
| Minimum | 0.10% | 29.3% |
| Maximum | 59.4% | 100.0% |
| Range | 59.3% | 70.7% |
| Mean | 11.4% | 46.3% |
| Median | 9.1% | 44.3% |
| Interquartile 25% (IQ1) | 4.5% | 41.8% |
| Interquartile 75% (IQ3) | 15.2% | 49.6% |
| Interquartile Range (IQR) | 10.8% | 7.8% |
| Standard Deviation (Sample) | 10.0% | 10.3% |
| Standard Deviation (Population) | 9.9% | 10.2% |
Correlation Details
| Ecuadorian Percentile | Sample Size | Married-couple Households |
[ 0.0% - 0.5% ] 0.10% | 225,866,786 | 45.6% |
[ 0.0% - 0.5% ] 0.42% | 35,405,715 | 47.7% |
[ 0.5% - 1.0% ] 0.74% | 18,221,574 | 45.3% |
[ 1.0% - 1.5% ] 1.03% | 7,912,309 | 47.1% |
[ 1.0% - 1.5% ] 1.33% | 4,837,413 | 45.6% |
[ 1.5% - 2.0% ] 1.64% | 3,845,305 | 42.0% |
[ 1.5% - 2.0% ] 1.93% | 1,918,876 | 44.0% |
[ 2.0% - 2.5% ] 2.29% | 10,138,643 | 37.3% |
[ 2.0% - 2.5% ] 2.49% | 1,884,784 | 45.6% |
[ 2.5% - 3.0% ] 2.82% | 1,070,403 | 43.9% |
[ 3.0% - 3.5% ] 3.16% | 1,010,740 | 42.2% |
[ 3.0% - 3.5% ] 3.39% | 701,516 | 43.6% |
[ 3.5% - 4.0% ] 3.68% | 275,994 | 45.3% |
[ 4.0% - 4.5% ] 4.04% | 209,404 | 38.7% |
[ 4.0% - 4.5% ] 4.28% | 370,549 | 43.5% |
[ 4.5% - 5.0% ] 4.62% | 297,502 | 39.2% |
[ 4.5% - 5.0% ] 4.94% | 76,880 | 42.3% |
[ 5.0% - 5.5% ] 5.12% | 295,399 | 41.1% |
[ 5.0% - 5.5% ] 5.45% | 98,704 | 46.2% |
[ 5.5% - 6.0% ] 5.79% | 75,504 | 51.5% |
[ 6.0% - 6.5% ] 6.10% | 159,101 | 53.1% |
[ 6.0% - 6.5% ] 6.41% | 105,683 | 55.1% |
[ 6.5% - 7.0% ] 6.71% | 199,062 | 41.5% |
[ 6.5% - 7.0% ] 6.97% | 101,959 | 49.3% |
[ 7.0% - 7.5% ] 7.25% | 222,817 | 41.2% |
[ 7.5% - 8.0% ] 7.52% | 182,213 | 39.8% |
[ 7.5% - 8.0% ] 7.83% | 150,353 | 45.8% |
[ 8.0% - 8.5% ] 8.12% | 107,043 | 32.1% |
[ 8.5% - 9.0% ] 8.53% | 156,526 | 42.7% |
[ 8.5% - 9.0% ] 8.72% | 334,815 | 29.3% |
[ 9.0% - 9.5% ] 9.07% | 31,554 | 52.0% |
[ 9.0% - 9.5% ] 9.34% | 12,343 | 36.6% |
[ 9.5% - 10.0% ] 9.74% | 51,505 | 55.8% |
[ 9.5% - 10.0% ] 9.96% | 227,148 | 41.6% |
[ 10.0% - 10.5% ] 10.20% | 32,963 | 47.7% |
[ 10.5% - 11.0% ] 10.58% | 91,516 | 32.1% |
[ 10.5% - 11.0% ] 10.78% | 86,963 | 46.6% |
[ 11.0% - 11.5% ] 11.43% | 22,800 | 43.8% |
[ 11.5% - 12.0% ] 11.65% | 127,356 | 50.1% |
[ 11.5% - 12.0% ] 11.90% | 112,396 | 43.0% |
[ 12.0% - 12.5% ] 12.37% | 100,539 | 44.5% |
[ 13.0% - 13.5% ] 13.11% | 9,606 | 54.2% |
[ 13.5% - 14.0% ] 13.78% | 112,299 | 42.4% |
[ 14.0% - 14.5% ] 14.12% | 70,524 | 43.8% |
[ 14.5% - 15.0% ] 14.65% | 42,547 | 31.0% |
[ 14.5% - 15.0% ] 14.89% | 27,708 | 49.6% |
[ 15.5% - 16.0% ] 15.59% | 9,126 | 71.6% |
[ 17.0% - 17.5% ] 17.43% | 11,777 | 44.3% |
[ 17.5% - 18.0% ] 17.72% | 1,078 | 65.6% |
[ 18.5% - 19.0% ] 18.55% | 275 | 48.1% |
[ 19.0% - 19.5% ] 19.11% | 21,040 | 51.4% |
[ 21.0% - 21.5% ] 21.04% | 1,231 | 42.4% |
[ 22.0% - 22.5% ] 22.25% | 5,946 | 49.6% |
[ 22.5% - 23.0% ] 22.68% | 5,587 | 40.7% |
[ 23.0% - 23.5% ] 23.08% | 1,005 | 34.1% |
[ 23.5% - 24.0% ] 23.90% | 112,750 | 42.4% |
[ 24.0% - 24.5% ] 24.24% | 56,696 | 42.9% |
[ 24.5% - 25.0% ] 24.90% | 9,162 | 55.0% |
[ 26.5% - 27.0% ] 26.59% | 4,407 | 60.3% |
[ 35.5% - 36.0% ] 35.76% | 2,718 | 51.3% |
[ 59.0% - 59.5% ] 59.38% | 32 | 100.0% |