Ecuadorian 3 or more Vehicles in Household
COMPARE
Ecuadorian
Select to Compare
3 or more Vehicles in Household
Ecuadorian 3 or more Vehicles in Household
14.1%
3+ VEHICLES AVAILABLE
0.0/ 100
METRIC RATING
327th/ 347
METRIC RANK
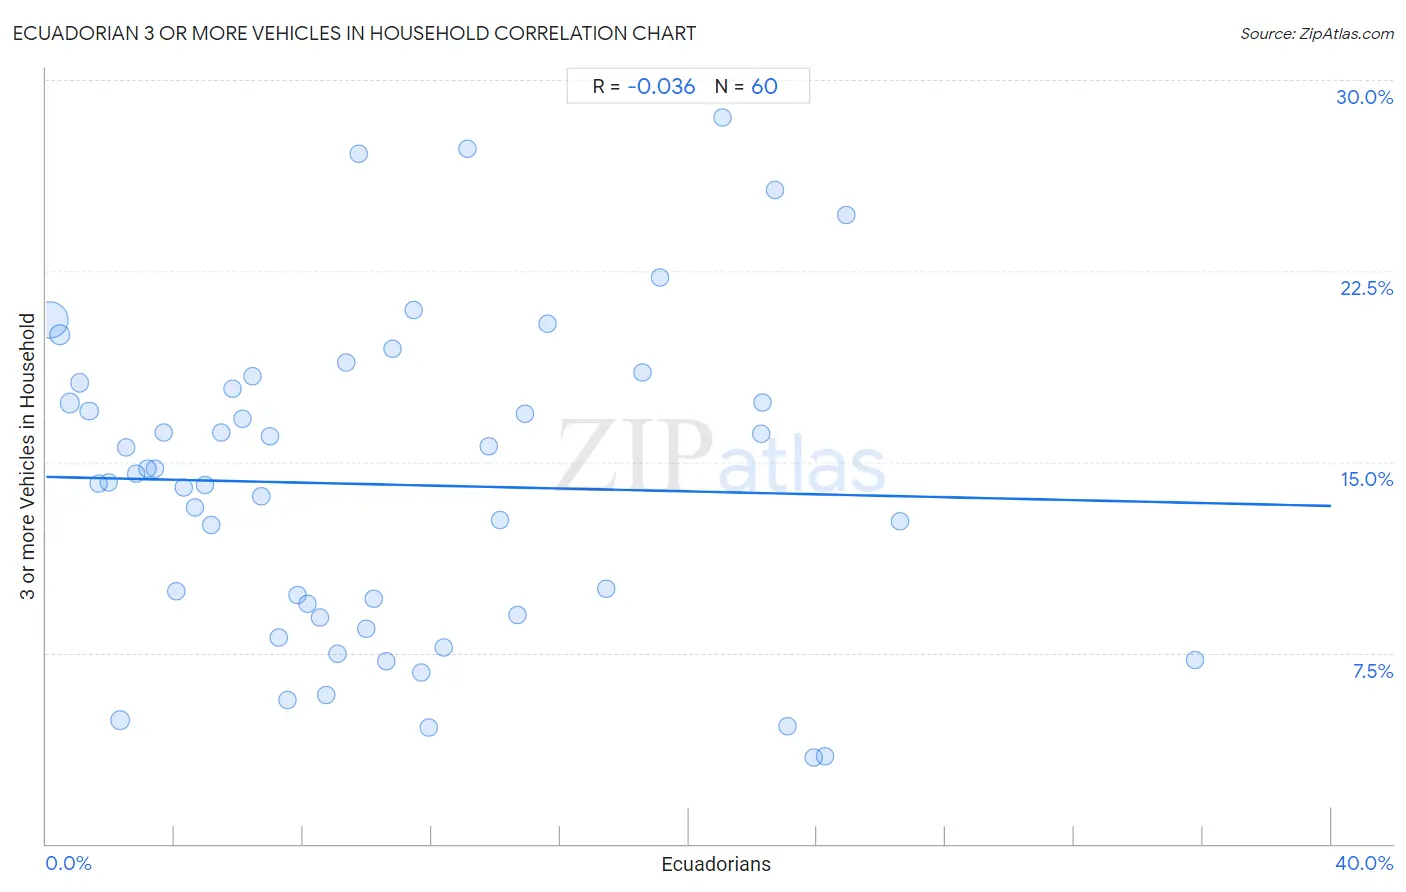
Ecuadorian 3 or more Vehicles in Household Correlation Chart
The statistical analysis conducted on geographies consisting of 317,505,117 people shows no correlation between the proportion of Ecuadorians and percentage of households with 3 or more vehicles available in the United States with a correlation coefficient (R) of -0.036 and weighted average of 14.1%. On average, for every 1% (one percent) increase in Ecuadorians within a typical geography, there is a decrease of 0.029% in percentage of households with 3 or more vehicles available.
It is essential to understand that the correlation between the percentage of Ecuadorians and percentage of households with 3 or more vehicles available does not imply a direct cause-and-effect relationship. It remains uncertain whether the presence of Ecuadorians influences an upward or downward trend in the level of percentage of households with 3 or more vehicles available within an area, or if Ecuadorians simply ended up residing in those areas with higher or lower levels of percentage of households with 3 or more vehicles available due to other factors.
Demographics Similar to Ecuadorians by 3 or more Vehicles in Household
In terms of 3 or more vehicles in household, the demographic groups most similar to Ecuadorians are Immigrants from Albania (14.0%, a difference of 0.71%), Soviet Union (14.2%, a difference of 0.89%), Senegalese (14.2%, a difference of 1.2%), Immigrants from Yemen (14.2%, a difference of 1.3%), and Immigrants from Senegal (13.8%, a difference of 1.9%).
| Demographics | Rating | Rank | 3 or more Vehicles in Household |
| Yup'ik | 0.0 /100 | #320 | Tragic 14.8% |
| Immigrants from Jamaica | 0.0 /100 | #321 | Tragic 14.7% |
| Immigrants from West Indies | 0.0 /100 | #322 | Tragic 14.6% |
| Immigrants from Caribbean | 0.0 /100 | #323 | Tragic 14.6% |
| Immigrants from Yemen | 0.0 /100 | #324 | Tragic 14.2% |
| Senegalese | 0.0 /100 | #325 | Tragic 14.2% |
| Soviet Union | 0.0 /100 | #326 | Tragic 14.2% |
| Ecuadorians | 0.0 /100 | #327 | Tragic 14.1% |
| Immigrants from Albania | 0.0 /100 | #328 | Tragic 14.0% |
| Immigrants from Senegal | 0.0 /100 | #329 | Tragic 13.8% |
| West Indians | 0.0 /100 | #330 | Tragic 13.7% |
| Immigrants from Dominica | 0.0 /100 | #331 | Tragic 13.7% |
| Trinidadians and Tobagonians | 0.0 /100 | #332 | Tragic 13.6% |
| Immigrants from Cabo Verde | 0.0 /100 | #333 | Tragic 13.6% |
| Immigrants from Ecuador | 0.0 /100 | #334 | Tragic 13.4% |
Ecuadorian 3 or more Vehicles in Household Correlation Summary
| Measurement | Ecuadorian Data | 3 or more Vehicles in Household Data |
| Minimum | 0.10% | 3.4% |
| Maximum | 35.8% | 28.5% |
| Range | 35.7% | 25.1% |
| Mean | 10.6% | 14.1% |
| Median | 8.9% | 14.4% |
| Interquartile 25% (IQ1) | 4.5% | 8.9% |
| Interquartile 75% (IQ3) | 14.8% | 18.0% |
| Interquartile Range (IQR) | 10.3% | 9.1% |
| Standard Deviation (Sample) | 8.0% | 6.3% |
| Standard Deviation (Population) | 7.9% | 6.2% |
Correlation Details
| Ecuadorian Percentile | Sample Size | 3 or more Vehicles in Household |
[ 0.0% - 0.5% ] 0.10% | 225,796,473 | 20.6% |
[ 0.0% - 0.5% ] 0.42% | 35,389,785 | 20.0% |
[ 0.5% - 1.0% ] 0.74% | 18,201,623 | 17.3% |
[ 1.0% - 1.5% ] 1.03% | 7,912,309 | 18.1% |
[ 1.0% - 1.5% ] 1.33% | 4,820,560 | 17.0% |
[ 1.5% - 2.0% ] 1.64% | 3,843,578 | 14.1% |
[ 1.5% - 2.0% ] 1.93% | 1,916,349 | 14.2% |
[ 2.0% - 2.5% ] 2.29% | 10,137,120 | 4.9% |
[ 2.0% - 2.5% ] 2.49% | 1,884,784 | 15.6% |
[ 2.5% - 3.0% ] 2.82% | 1,070,403 | 14.5% |
[ 3.0% - 3.5% ] 3.16% | 1,010,391 | 14.7% |
[ 3.0% - 3.5% ] 3.39% | 701,516 | 14.8% |
[ 3.5% - 4.0% ] 3.68% | 275,994 | 16.2% |
[ 4.0% - 4.5% ] 4.04% | 209,404 | 9.9% |
[ 4.0% - 4.5% ] 4.28% | 370,549 | 14.0% |
[ 4.5% - 5.0% ] 4.62% | 297,502 | 13.2% |
[ 4.5% - 5.0% ] 4.94% | 76,880 | 14.1% |
[ 5.0% - 5.5% ] 5.12% | 295,399 | 12.5% |
[ 5.0% - 5.5% ] 5.45% | 98,704 | 16.1% |
[ 5.5% - 6.0% ] 5.79% | 75,504 | 17.9% |
[ 6.0% - 6.5% ] 6.10% | 158,793 | 16.7% |
[ 6.0% - 6.5% ] 6.41% | 105,683 | 18.3% |
[ 6.5% - 7.0% ] 6.71% | 199,062 | 13.7% |
[ 6.5% - 7.0% ] 6.96% | 100,875 | 16.0% |
[ 7.0% - 7.5% ] 7.25% | 222,817 | 8.1% |
[ 7.5% - 8.0% ] 7.52% | 182,213 | 5.6% |
[ 7.5% - 8.0% ] 7.83% | 150,353 | 9.8% |
[ 8.0% - 8.5% ] 8.12% | 107,043 | 9.4% |
[ 8.5% - 9.0% ] 8.53% | 156,526 | 8.9% |
[ 8.5% - 9.0% ] 8.72% | 334,815 | 5.9% |
[ 9.0% - 9.5% ] 9.07% | 31,554 | 7.4% |
[ 9.0% - 9.5% ] 9.34% | 12,343 | 18.9% |
[ 9.5% - 10.0% ] 9.74% | 51,505 | 27.1% |
[ 9.5% - 10.0% ] 9.96% | 227,148 | 8.5% |
[ 10.0% - 10.5% ] 10.20% | 32,963 | 9.6% |
[ 10.5% - 11.0% ] 10.58% | 91,516 | 7.1% |
[ 10.5% - 11.0% ] 10.78% | 86,963 | 19.5% |
[ 11.0% - 11.5% ] 11.43% | 22,800 | 21.0% |
[ 11.5% - 12.0% ] 11.65% | 127,356 | 6.7% |
[ 11.5% - 12.0% ] 11.90% | 112,396 | 4.6% |
[ 12.0% - 12.5% ] 12.37% | 100,539 | 7.7% |
[ 13.0% - 13.5% ] 13.11% | 9,606 | 27.3% |
[ 13.5% - 14.0% ] 13.78% | 112,299 | 15.6% |
[ 14.0% - 14.5% ] 14.12% | 70,070 | 12.7% |
[ 14.5% - 15.0% ] 14.65% | 42,547 | 9.0% |
[ 14.5% - 15.0% ] 14.89% | 27,708 | 16.9% |
[ 15.5% - 16.0% ] 15.59% | 9,126 | 20.4% |
[ 17.0% - 17.5% ] 17.43% | 11,777 | 10.0% |
[ 18.5% - 19.0% ] 18.55% | 275 | 18.5% |
[ 19.0% - 19.5% ] 19.11% | 21,040 | 22.2% |
[ 21.0% - 21.5% ] 21.04% | 1,231 | 28.5% |
[ 22.0% - 22.5% ] 22.25% | 5,946 | 16.1% |
[ 22.0% - 22.5% ] 22.28% | 1,077 | 17.3% |
[ 22.5% - 23.0% ] 22.68% | 5,587 | 25.7% |
[ 23.0% - 23.5% ] 23.08% | 1,005 | 4.6% |
[ 23.5% - 24.0% ] 23.90% | 112,750 | 3.4% |
[ 24.0% - 24.5% ] 24.24% | 56,696 | 3.4% |
[ 24.5% - 25.0% ] 24.90% | 9,162 | 24.7% |
[ 26.5% - 27.0% ] 26.59% | 4,407 | 12.7% |
[ 35.5% - 36.0% ] 35.76% | 2,718 | 7.2% |