Ecuadorian Self-Care Disability
COMPARE
Ecuadorian
Select to Compare
Self-Care Disability
Ecuadorian Self-Care Disability
2.6%
SELF-CARE DISABILITY
4.7/ 100
METRIC RATING
213th/ 347
METRIC RANK
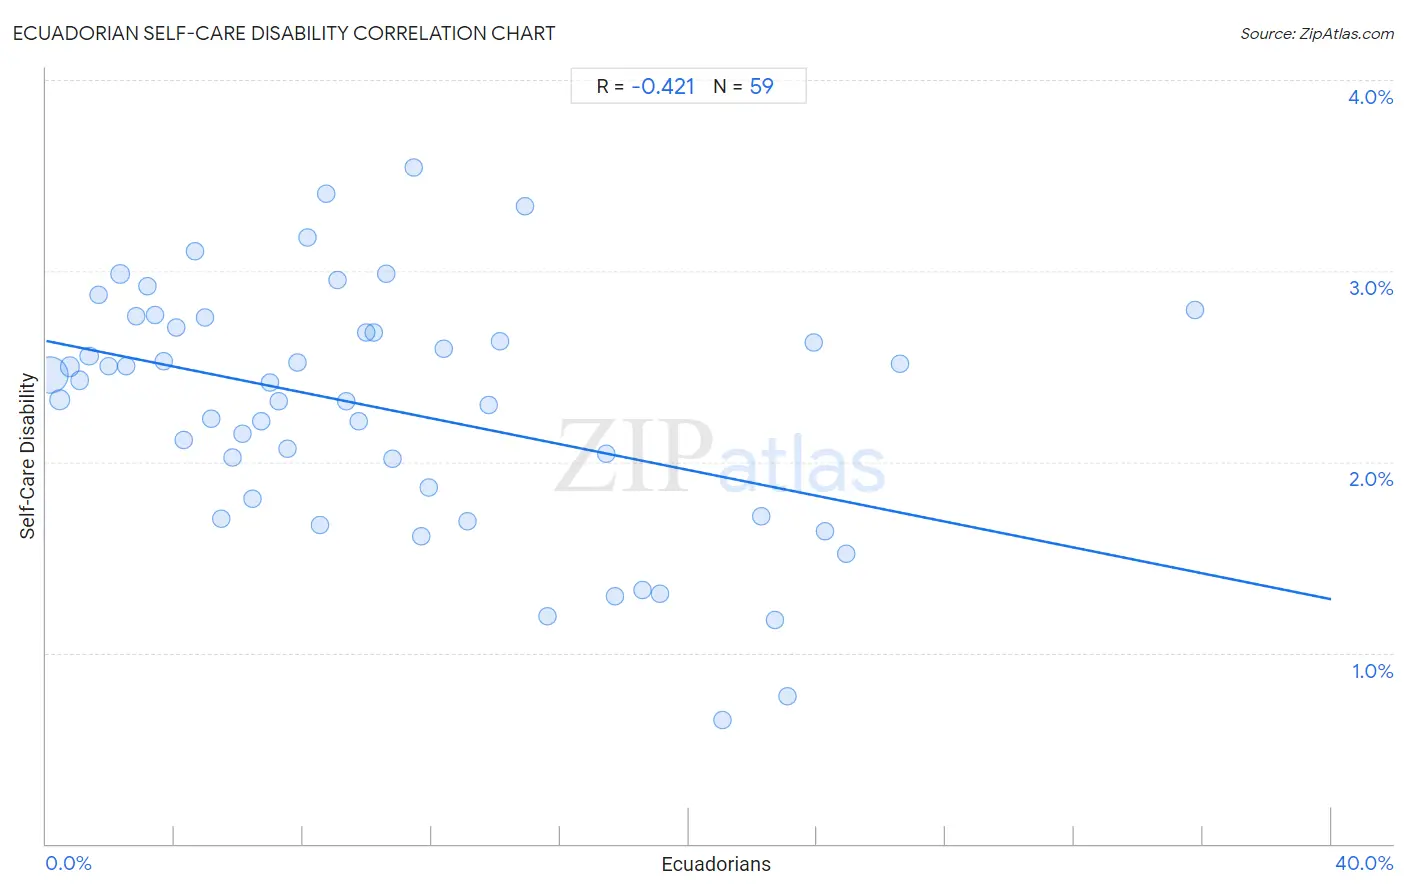
Ecuadorian Self-Care Disability Correlation Chart
The statistical analysis conducted on geographies consisting of 317,436,326 people shows a moderate negative correlation between the proportion of Ecuadorians and percentage of population with self-care disability in the United States with a correlation coefficient (R) of -0.421 and weighted average of 2.6%. On average, for every 1% (one percent) increase in Ecuadorians within a typical geography, there is a decrease of 0.034% in percentage of population with self-care disability.
It is essential to understand that the correlation between the percentage of Ecuadorians and percentage of population with self-care disability does not imply a direct cause-and-effect relationship. It remains uncertain whether the presence of Ecuadorians influences an upward or downward trend in the level of percentage of population with self-care disability within an area, or if Ecuadorians simply ended up residing in those areas with higher or lower levels of percentage of population with self-care disability due to other factors.
Demographics Similar to Ecuadorians by Self-Care Disability
In terms of self-care disability, the demographic groups most similar to Ecuadorians are Immigrants from Honduras (2.6%, a difference of 0.0%), Immigrants from Thailand (2.6%, a difference of 0.050%), White/Caucasian (2.6%, a difference of 0.070%), Celtic (2.6%, a difference of 0.090%), and Samoan (2.6%, a difference of 0.10%).
| Demographics | Rating | Rank | Self-Care Disability |
| Alaskan Athabascans | 10.4 /100 | #206 | Poor 2.5% |
| French | 9.9 /100 | #207 | Tragic 2.5% |
| Central Americans | 8.7 /100 | #208 | Tragic 2.5% |
| Malaysians | 7.7 /100 | #209 | Tragic 2.5% |
| Panamanians | 6.4 /100 | #210 | Tragic 2.5% |
| Native Hawaiians | 5.1 /100 | #211 | Tragic 2.6% |
| Samoans | 5.1 /100 | #212 | Tragic 2.6% |
| Ecuadorians | 4.7 /100 | #213 | Tragic 2.6% |
| Immigrants from Honduras | 4.7 /100 | #214 | Tragic 2.6% |
| Immigrants from Thailand | 4.5 /100 | #215 | Tragic 2.6% |
| Whites/Caucasians | 4.4 /100 | #216 | Tragic 2.6% |
| Celtics | 4.4 /100 | #217 | Tragic 2.6% |
| Scotch-Irish | 4.1 /100 | #218 | Tragic 2.6% |
| Immigrants from Moldova | 4.0 /100 | #219 | Tragic 2.6% |
| Sub-Saharan Africans | 4.0 /100 | #220 | Tragic 2.6% |
Ecuadorian Self-Care Disability Correlation Summary
| Measurement | Ecuadorian Data | Self-Care Disability Data |
| Minimum | 0.10% | 0.65% |
| Maximum | 35.8% | 3.5% |
| Range | 35.7% | 2.9% |
| Mean | 10.5% | 2.3% |
| Median | 8.7% | 2.4% |
| Interquartile 25% (IQ1) | 4.3% | 1.8% |
| Interquartile 75% (IQ3) | 14.9% | 2.7% |
| Interquartile Range (IQR) | 10.6% | 0.89% |
| Standard Deviation (Sample) | 7.9% | 0.64% |
| Standard Deviation (Population) | 7.9% | 0.63% |
Correlation Details
| Ecuadorian Percentile | Sample Size | Self-Care Disability |
[ 0.0% - 0.5% ] 0.10% | 225,823,926 | 2.5% |
[ 0.0% - 0.5% ] 0.42% | 35,379,555 | 2.3% |
[ 0.5% - 1.0% ] 0.74% | 18,187,556 | 2.5% |
[ 1.0% - 1.5% ] 1.03% | 7,914,835 | 2.4% |
[ 1.0% - 1.5% ] 1.33% | 4,816,877 | 2.6% |
[ 1.5% - 2.0% ] 1.64% | 3,845,436 | 2.9% |
[ 1.5% - 2.0% ] 1.93% | 1,909,552 | 2.5% |
[ 2.0% - 2.5% ] 2.29% | 10,133,334 | 3.0% |
[ 2.0% - 2.5% ] 2.49% | 1,884,018 | 2.5% |
[ 2.5% - 3.0% ] 2.82% | 1,060,441 | 2.8% |
[ 3.0% - 3.5% ] 3.16% | 1,009,736 | 2.9% |
[ 3.0% - 3.5% ] 3.39% | 701,516 | 2.8% |
[ 3.5% - 4.0% ] 3.68% | 274,792 | 2.5% |
[ 4.0% - 4.5% ] 4.04% | 208,720 | 2.7% |
[ 4.0% - 4.5% ] 4.28% | 370,549 | 2.1% |
[ 4.5% - 5.0% ] 4.62% | 297,502 | 3.1% |
[ 4.5% - 5.0% ] 4.94% | 76,272 | 2.8% |
[ 5.0% - 5.5% ] 5.12% | 295,399 | 2.2% |
[ 5.0% - 5.5% ] 5.45% | 96,831 | 1.7% |
[ 5.5% - 6.0% ] 5.79% | 74,976 | 2.0% |
[ 6.0% - 6.5% ] 6.10% | 158,793 | 2.1% |
[ 6.0% - 6.5% ] 6.41% | 105,683 | 1.8% |
[ 6.5% - 7.0% ] 6.71% | 199,062 | 2.2% |
[ 6.5% - 7.0% ] 6.96% | 100,875 | 2.4% |
[ 7.0% - 7.5% ] 7.25% | 222,817 | 2.3% |
[ 7.5% - 8.0% ] 7.52% | 181,924 | 2.1% |
[ 7.5% - 8.0% ] 7.83% | 150,353 | 2.5% |
[ 8.0% - 8.5% ] 8.12% | 107,043 | 3.2% |
[ 8.5% - 9.0% ] 8.53% | 155,607 | 1.7% |
[ 8.5% - 9.0% ] 8.72% | 334,815 | 3.4% |
[ 9.0% - 9.5% ] 9.07% | 31,554 | 3.0% |
[ 9.0% - 9.5% ] 9.34% | 12,343 | 2.3% |
[ 9.5% - 10.0% ] 9.74% | 51,505 | 2.2% |
[ 9.5% - 10.0% ] 9.96% | 227,148 | 2.7% |
[ 10.0% - 10.5% ] 10.20% | 32,963 | 2.7% |
[ 10.5% - 11.0% ] 10.58% | 91,516 | 3.0% |
[ 10.5% - 11.0% ] 10.78% | 86,456 | 2.0% |
[ 11.0% - 11.5% ] 11.43% | 22,800 | 3.5% |
[ 11.5% - 12.0% ] 11.65% | 127,356 | 1.6% |
[ 11.5% - 12.0% ] 11.90% | 112,396 | 1.9% |
[ 12.0% - 12.5% ] 12.37% | 100,539 | 2.6% |
[ 13.0% - 13.5% ] 13.11% | 9,461 | 1.7% |
[ 13.5% - 14.0% ] 13.78% | 112,299 | 2.3% |
[ 14.0% - 14.5% ] 14.12% | 70,070 | 2.6% |
[ 14.5% - 15.0% ] 14.89% | 27,708 | 3.3% |
[ 15.5% - 16.0% ] 15.59% | 9,126 | 1.2% |
[ 17.0% - 17.5% ] 17.45% | 10,396 | 2.0% |
[ 17.5% - 18.0% ] 17.72% | 1,078 | 1.3% |
[ 18.5% - 19.0% ] 18.55% | 275 | 1.3% |
[ 19.0% - 19.5% ] 19.11% | 21,040 | 1.3% |
[ 21.0% - 21.5% ] 21.04% | 1,231 | 0.65% |
[ 22.0% - 22.5% ] 22.25% | 5,946 | 1.7% |
[ 22.5% - 23.0% ] 22.68% | 5,587 | 1.2% |
[ 23.0% - 23.5% ] 23.08% | 1,005 | 0.77% |
[ 23.5% - 24.0% ] 23.90% | 112,750 | 2.6% |
[ 24.0% - 24.5% ] 24.24% | 56,696 | 1.6% |
[ 24.5% - 25.0% ] 24.90% | 9,162 | 1.5% |
[ 26.5% - 27.0% ] 26.59% | 4,407 | 2.5% |
[ 35.5% - 36.0% ] 35.76% | 2,718 | 2.8% |