Ecuadorian Male Disability
COMPARE
Ecuadorian
Select to Compare
Male Disability
Ecuadorian Male Disability
10.5%
DISABILITY | MALES
99.2/ 100
METRIC RATING
69th/ 347
METRIC RANK
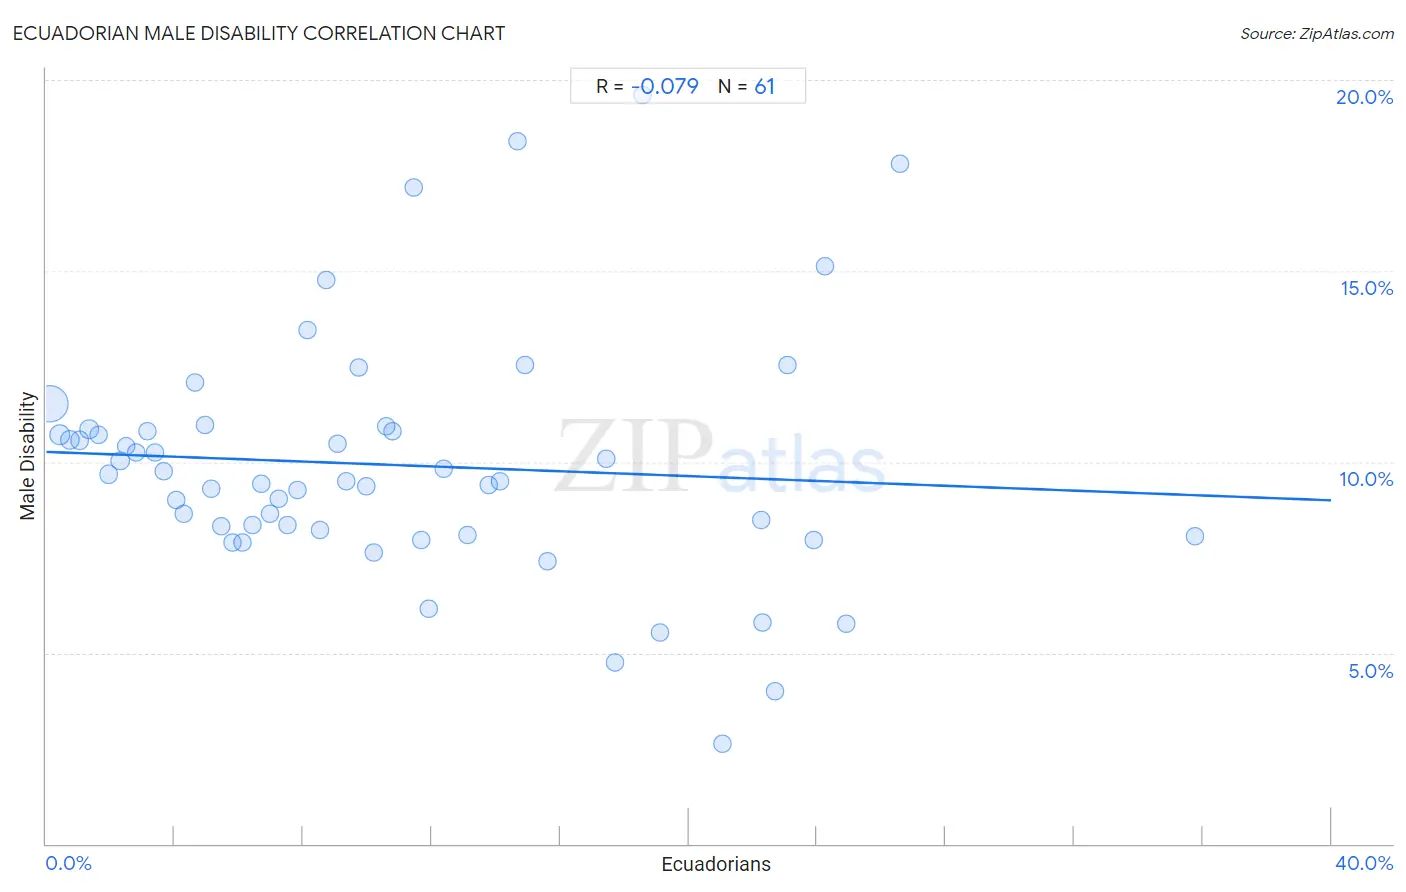
Ecuadorian Male Disability Correlation Chart
The statistical analysis conducted on geographies consisting of 317,801,764 people shows a slight negative correlation between the proportion of Ecuadorians and percentage of males with a disability in the United States with a correlation coefficient (R) of -0.079 and weighted average of 10.5%. On average, for every 1% (one percent) increase in Ecuadorians within a typical geography, there is a decrease of 0.032% in percentage of males with a disability.
It is essential to understand that the correlation between the percentage of Ecuadorians and percentage of males with a disability does not imply a direct cause-and-effect relationship. It remains uncertain whether the presence of Ecuadorians influences an upward or downward trend in the level of percentage of males with a disability within an area, or if Ecuadorians simply ended up residing in those areas with higher or lower levels of percentage of males with a disability due to other factors.
Demographics Similar to Ecuadorians by Male Disability
In terms of male disability, the demographic groups most similar to Ecuadorians are Colombian (10.5%, a difference of 0.0%), Immigrants from Afghanistan (10.5%, a difference of 0.10%), Immigrants from Grenada (10.5%, a difference of 0.11%), Guyanese (10.5%, a difference of 0.11%), and Jordanian (10.5%, a difference of 0.13%).
| Demographics | Rating | Rank | Male Disability |
| Immigrants from Ecuador | 99.3 /100 | #62 | Exceptional 10.4% |
| Immigrants from Belarus | 99.3 /100 | #63 | Exceptional 10.4% |
| Jordanians | 99.3 /100 | #64 | Exceptional 10.5% |
| Immigrants from Grenada | 99.2 /100 | #65 | Exceptional 10.5% |
| Guyanese | 99.2 /100 | #66 | Exceptional 10.5% |
| Immigrants from Afghanistan | 99.2 /100 | #67 | Exceptional 10.5% |
| Colombians | 99.2 /100 | #68 | Exceptional 10.5% |
| Ecuadorians | 99.2 /100 | #69 | Exceptional 10.5% |
| Immigrants from Bulgaria | 99.1 /100 | #70 | Exceptional 10.5% |
| Immigrants from Cameroon | 99.0 /100 | #71 | Exceptional 10.5% |
| Immigrants from Serbia | 99.0 /100 | #72 | Exceptional 10.5% |
| Immigrants from Lithuania | 98.9 /100 | #73 | Exceptional 10.5% |
| Immigrants from Lebanon | 98.8 /100 | #74 | Exceptional 10.5% |
| Sierra Leoneans | 98.7 /100 | #75 | Exceptional 10.5% |
| Immigrants from Sierra Leone | 98.7 /100 | #76 | Exceptional 10.5% |
Ecuadorian Male Disability Correlation Summary
| Measurement | Ecuadorian Data | Male Disability Data |
| Minimum | 0.10% | 2.6% |
| Maximum | 35.8% | 19.6% |
| Range | 35.7% | 17.0% |
| Mean | 10.8% | 9.9% |
| Median | 9.1% | 9.5% |
| Interquartile 25% (IQ1) | 4.5% | 8.2% |
| Interquartile 75% (IQ3) | 15.2% | 10.8% |
| Interquartile Range (IQR) | 10.8% | 2.7% |
| Standard Deviation (Sample) | 8.0% | 3.2% |
| Standard Deviation (Population) | 7.9% | 3.2% |
Correlation Details
| Ecuadorian Percentile | Sample Size | Male Disability |
[ 0.0% - 0.5% ] 0.10% | 225,932,927 | 11.5% |
[ 0.0% - 0.5% ] 0.42% | 35,451,746 | 10.7% |
[ 0.5% - 1.0% ] 0.74% | 18,224,884 | 10.6% |
[ 1.0% - 1.5% ] 1.03% | 7,929,214 | 10.6% |
[ 1.0% - 1.5% ] 1.33% | 4,841,795 | 10.9% |
[ 1.5% - 2.0% ] 1.64% | 3,861,145 | 10.7% |
[ 1.5% - 2.0% ] 1.93% | 1,926,433 | 9.7% |
[ 2.0% - 2.5% ] 2.29% | 10,139,321 | 10.0% |
[ 2.0% - 2.5% ] 2.49% | 1,889,288 | 10.4% |
[ 2.5% - 3.0% ] 2.82% | 1,070,606 | 10.2% |
[ 3.0% - 3.5% ] 3.16% | 1,010,391 | 10.8% |
[ 3.0% - 3.5% ] 3.39% | 701,516 | 10.2% |
[ 3.5% - 4.0% ] 3.68% | 275,994 | 9.8% |
[ 4.0% - 4.5% ] 4.04% | 209,404 | 9.0% |
[ 4.0% - 4.5% ] 4.28% | 370,549 | 8.6% |
[ 4.5% - 5.0% ] 4.62% | 297,502 | 12.1% |
[ 4.5% - 5.0% ] 4.94% | 76,880 | 11.0% |
[ 5.0% - 5.5% ] 5.12% | 295,399 | 9.3% |
[ 5.0% - 5.5% ] 5.45% | 98,704 | 8.3% |
[ 5.5% - 6.0% ] 5.79% | 75,504 | 7.9% |
[ 6.0% - 6.5% ] 6.10% | 159,101 | 7.9% |
[ 6.0% - 6.5% ] 6.41% | 105,683 | 8.3% |
[ 6.5% - 7.0% ] 6.71% | 199,062 | 9.4% |
[ 6.5% - 7.0% ] 6.97% | 101,959 | 8.6% |
[ 7.0% - 7.5% ] 7.25% | 222,817 | 9.0% |
[ 7.5% - 8.0% ] 7.52% | 182,213 | 8.4% |
[ 7.5% - 8.0% ] 7.83% | 150,353 | 9.3% |
[ 8.0% - 8.5% ] 8.12% | 107,043 | 13.5% |
[ 8.5% - 9.0% ] 8.53% | 156,526 | 8.2% |
[ 8.5% - 9.0% ] 8.72% | 334,815 | 14.8% |
[ 9.0% - 9.5% ] 9.07% | 31,554 | 10.5% |
[ 9.0% - 9.5% ] 9.34% | 12,343 | 9.5% |
[ 9.5% - 10.0% ] 9.74% | 51,505 | 12.5% |
[ 9.5% - 10.0% ] 9.96% | 227,148 | 9.4% |
[ 10.0% - 10.5% ] 10.20% | 32,963 | 7.6% |
[ 10.5% - 11.0% ] 10.58% | 91,516 | 10.9% |
[ 10.5% - 11.0% ] 10.78% | 86,456 | 10.8% |
[ 11.0% - 11.5% ] 11.43% | 22,800 | 17.2% |
[ 11.5% - 12.0% ] 11.65% | 127,356 | 7.9% |
[ 11.5% - 12.0% ] 11.90% | 112,396 | 6.2% |
[ 12.0% - 12.5% ] 12.37% | 100,539 | 9.8% |
[ 13.0% - 13.5% ] 13.11% | 9,461 | 8.1% |
[ 13.5% - 14.0% ] 13.78% | 112,299 | 9.4% |
[ 14.0% - 14.5% ] 14.12% | 70,524 | 9.5% |
[ 14.5% - 15.0% ] 14.65% | 42,547 | 18.4% |
[ 14.5% - 15.0% ] 14.89% | 27,708 | 12.5% |
[ 15.5% - 16.0% ] 15.59% | 9,126 | 7.4% |
[ 17.0% - 17.5% ] 17.43% | 11,777 | 10.1% |
[ 17.5% - 18.0% ] 17.72% | 1,078 | 4.8% |
[ 18.5% - 19.0% ] 18.55% | 275 | 19.6% |
[ 19.0% - 19.5% ] 19.11% | 21,040 | 5.5% |
[ 21.0% - 21.5% ] 21.04% | 1,231 | 2.6% |
[ 22.0% - 22.5% ] 22.25% | 5,946 | 8.5% |
[ 22.0% - 22.5% ] 22.28% | 1,077 | 5.8% |
[ 22.5% - 23.0% ] 22.68% | 5,587 | 4.0% |
[ 23.0% - 23.5% ] 23.08% | 1,005 | 12.5% |
[ 23.5% - 24.0% ] 23.90% | 112,750 | 8.0% |
[ 24.0% - 24.5% ] 24.24% | 56,696 | 15.1% |
[ 24.5% - 25.0% ] 24.90% | 9,162 | 5.8% |
[ 26.5% - 27.0% ] 26.59% | 4,407 | 17.8% |
[ 35.5% - 36.0% ] 35.76% | 2,718 | 8.0% |