Ecuadorian Receiving Food Stamps
COMPARE
Ecuadorian
Select to Compare
Receiving Food Stamps
Ecuadorian Receiving Food Stamps
14.9%
PUBLIC INCOME | FOOD STAMPS
0.0/ 100
METRIC RATING
280th/ 347
METRIC RANK
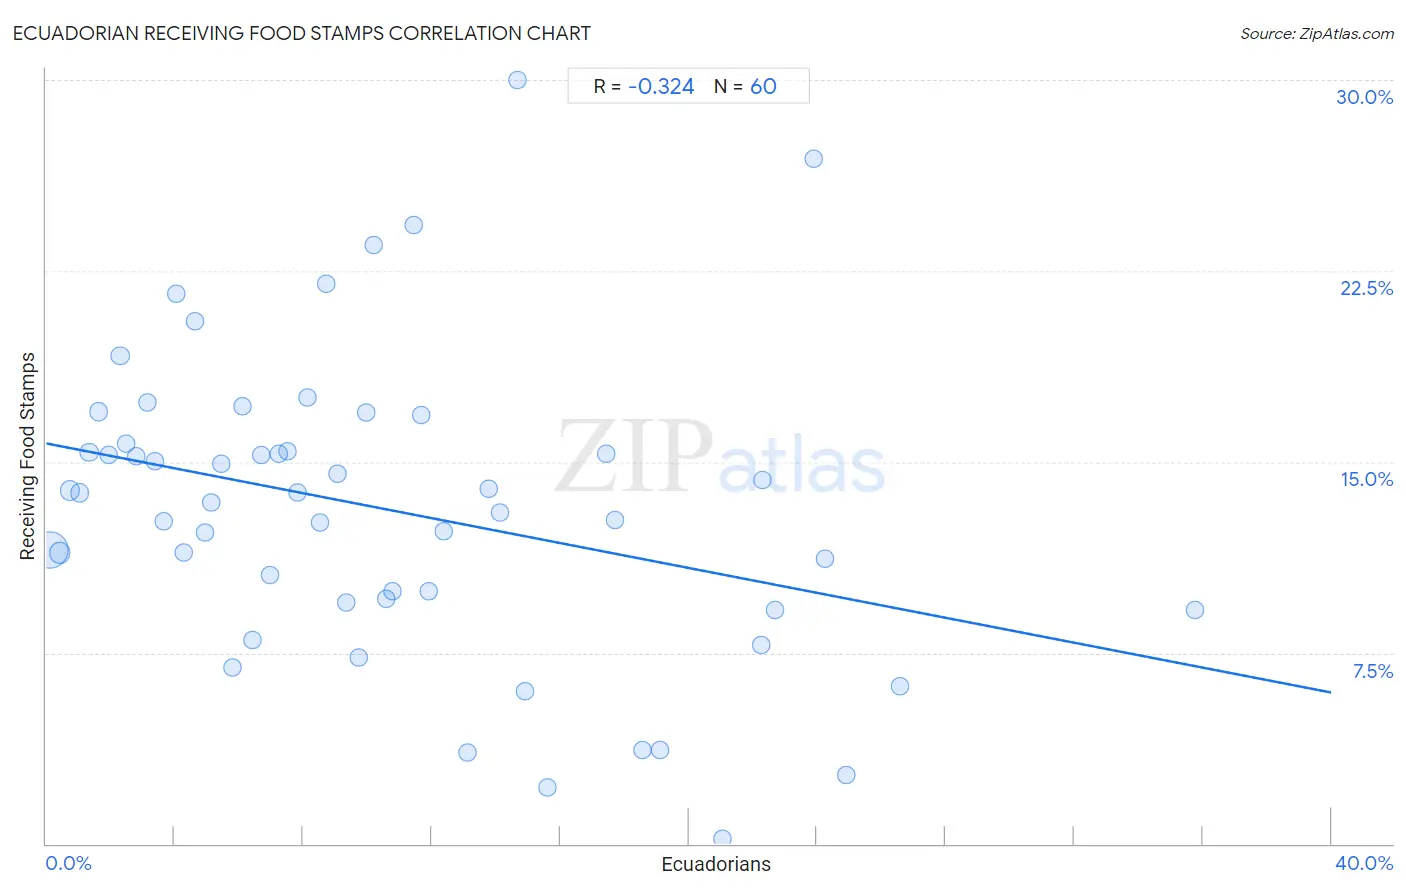
Ecuadorian Receiving Food Stamps Correlation Chart
The statistical analysis conducted on geographies consisting of 317,062,012 people shows a mild negative correlation between the proportion of Ecuadorians and percentage of population receiving government assistance and/or food stamps in the United States with a correlation coefficient (R) of -0.324 and weighted average of 14.9%. On average, for every 1% (one percent) increase in Ecuadorians within a typical geography, there is a decrease of 0.24% in percentage of population receiving government assistance and/or food stamps.
It is essential to understand that the correlation between the percentage of Ecuadorians and percentage of population receiving government assistance and/or food stamps does not imply a direct cause-and-effect relationship. It remains uncertain whether the presence of Ecuadorians influences an upward or downward trend in the level of percentage of population receiving government assistance and/or food stamps within an area, or if Ecuadorians simply ended up residing in those areas with higher or lower levels of percentage of population receiving government assistance and/or food stamps due to other factors.
Demographics Similar to Ecuadorians by Receiving Food Stamps
In terms of receiving food stamps, the demographic groups most similar to Ecuadorians are Kiowa (14.9%, a difference of 0.050%), Belizean (14.8%, a difference of 0.32%), Spanish American Indian (14.9%, a difference of 0.32%), Seminole (14.8%, a difference of 0.45%), and Liberian (14.8%, a difference of 0.50%).
| Demographics | Rating | Rank | Receiving Food Stamps |
| Alaskan Athabascans | 0.1 /100 | #273 | Tragic 14.7% |
| Immigrants from Western Africa | 0.1 /100 | #274 | Tragic 14.7% |
| Ute | 0.1 /100 | #275 | Tragic 14.7% |
| Liberians | 0.1 /100 | #276 | Tragic 14.8% |
| Seminole | 0.1 /100 | #277 | Tragic 14.8% |
| Belizeans | 0.1 /100 | #278 | Tragic 14.8% |
| Kiowa | 0.0 /100 | #279 | Tragic 14.9% |
| Ecuadorians | 0.0 /100 | #280 | Tragic 14.9% |
| Spanish American Indians | 0.0 /100 | #281 | Tragic 14.9% |
| Immigrants from Central America | 0.0 /100 | #282 | Tragic 15.0% |
| Bangladeshis | 0.0 /100 | #283 | Tragic 15.0% |
| Immigrants from Ecuador | 0.0 /100 | #284 | Tragic 15.0% |
| Immigrants from Liberia | 0.0 /100 | #285 | Tragic 15.1% |
| Africans | 0.0 /100 | #286 | Tragic 15.1% |
| Immigrants from Mexico | 0.0 /100 | #287 | Tragic 15.2% |
Ecuadorian Receiving Food Stamps Correlation Summary
| Measurement | Ecuadorian Data | Receiving Food Stamps Data |
| Minimum | 0.10% | 0.20% |
| Maximum | 35.8% | 30.0% |
| Range | 35.7% | 29.8% |
| Mean | 10.6% | 13.1% |
| Median | 8.9% | 13.6% |
| Interquartile 25% (IQ1) | 4.5% | 9.6% |
| Interquartile 75% (IQ3) | 14.8% | 15.6% |
| Interquartile Range (IQR) | 10.3% | 6.0% |
| Standard Deviation (Sample) | 7.9% | 5.9% |
| Standard Deviation (Population) | 7.8% | 5.9% |
Correlation Details
| Ecuadorian Percentile | Sample Size | Receiving Food Stamps |
[ 0.0% - 0.5% ] 0.10% | 225,620,466 | 11.5% |
[ 0.0% - 0.5% ] 0.42% | 35,328,431 | 11.4% |
[ 0.5% - 1.0% ] 0.74% | 18,095,170 | 13.9% |
[ 1.0% - 1.5% ] 1.03% | 7,873,206 | 13.8% |
[ 1.0% - 1.5% ] 1.33% | 4,806,436 | 15.4% |
[ 1.5% - 2.0% ] 1.64% | 3,837,755 | 17.0% |
[ 1.5% - 2.0% ] 1.93% | 1,910,358 | 15.3% |
[ 2.0% - 2.5% ] 2.29% | 10,134,805 | 19.2% |
[ 2.0% - 2.5% ] 2.49% | 1,872,944 | 15.7% |
[ 2.5% - 3.0% ] 2.82% | 1,070,040 | 15.2% |
[ 3.0% - 3.5% ] 3.16% | 1,010,391 | 17.3% |
[ 3.0% - 3.5% ] 3.39% | 695,385 | 15.0% |
[ 3.5% - 4.0% ] 3.68% | 275,525 | 12.7% |
[ 4.0% - 4.5% ] 4.04% | 208,939 | 21.6% |
[ 4.0% - 4.5% ] 4.28% | 369,136 | 11.5% |
[ 4.5% - 5.0% ] 4.63% | 293,459 | 20.5% |
[ 4.5% - 5.0% ] 4.94% | 74,462 | 12.2% |
[ 5.0% - 5.5% ] 5.12% | 295,399 | 13.4% |
[ 5.0% - 5.5% ] 5.45% | 98,704 | 14.9% |
[ 5.5% - 6.0% ] 5.79% | 75,504 | 6.9% |
[ 6.0% - 6.5% ] 6.10% | 158,793 | 17.2% |
[ 6.0% - 6.5% ] 6.40% | 104,421 | 8.0% |
[ 6.5% - 7.0% ] 6.71% | 197,914 | 15.3% |
[ 6.5% - 7.0% ] 6.97% | 101,959 | 10.6% |
[ 7.0% - 7.5% ] 7.25% | 222,817 | 15.3% |
[ 7.5% - 8.0% ] 7.52% | 182,213 | 15.4% |
[ 7.5% - 8.0% ] 7.83% | 150,353 | 13.8% |
[ 8.0% - 8.5% ] 8.12% | 107,043 | 17.5% |
[ 8.5% - 9.0% ] 8.53% | 156,526 | 12.6% |
[ 8.5% - 9.0% ] 8.72% | 334,815 | 22.0% |
[ 9.0% - 9.5% ] 9.07% | 31,554 | 14.5% |
[ 9.0% - 9.5% ] 9.34% | 12,343 | 9.5% |
[ 9.5% - 10.0% ] 9.74% | 51,505 | 7.3% |
[ 9.5% - 10.0% ] 9.96% | 227,148 | 16.9% |
[ 10.0% - 10.5% ] 10.20% | 32,963 | 23.5% |
[ 10.5% - 11.0% ] 10.58% | 91,516 | 9.6% |
[ 10.5% - 11.0% ] 10.78% | 86,456 | 9.9% |
[ 11.0% - 11.5% ] 11.43% | 22,800 | 24.3% |
[ 11.5% - 12.0% ] 11.65% | 127,356 | 16.8% |
[ 11.5% - 12.0% ] 11.90% | 111,707 | 9.9% |
[ 12.0% - 12.5% ] 12.37% | 100,539 | 12.3% |
[ 13.0% - 13.5% ] 13.11% | 9,461 | 3.6% |
[ 13.5% - 14.0% ] 13.78% | 112,299 | 14.0% |
[ 14.0% - 14.5% ] 14.12% | 70,524 | 13.0% |
[ 14.5% - 15.0% ] 14.65% | 41,907 | 30.0% |
[ 14.5% - 15.0% ] 14.88% | 27,076 | 6.0% |
[ 15.5% - 16.0% ] 15.59% | 9,126 | 2.2% |
[ 17.0% - 17.5% ] 17.45% | 10,396 | 15.3% |
[ 17.5% - 18.0% ] 17.72% | 1,078 | 12.7% |
[ 18.5% - 19.0% ] 18.55% | 275 | 3.7% |
[ 19.0% - 19.5% ] 19.11% | 21,040 | 3.7% |
[ 21.0% - 21.5% ] 21.04% | 1,231 | 0.20% |
[ 22.0% - 22.5% ] 22.25% | 5,946 | 7.8% |
[ 22.0% - 22.5% ] 22.28% | 1,077 | 14.3% |
[ 22.5% - 23.0% ] 22.68% | 5,587 | 9.2% |
[ 23.5% - 24.0% ] 23.90% | 112,750 | 26.9% |
[ 24.0% - 24.5% ] 24.24% | 56,696 | 11.2% |
[ 24.5% - 25.0% ] 24.90% | 9,162 | 2.7% |
[ 26.5% - 27.0% ] 26.59% | 4,407 | 6.2% |
[ 35.5% - 36.0% ] 35.76% | 2,718 | 9.2% |