Ecuadorian Unemployment Among Women with Children Ages 6 to 17 years

COMPARE

Ecuadorian
Race
Ancestry
AfghanAfricanAlaska NativeAlaskan AthabascanAlbanianAleutAlsatianAmericanApacheArabArapahoArgentineanArmenianAssyrian/Chaldean/SyriacAustralianAustrianBahamianBangladeshiBarbadianBasqueBelgianBelizeanBermudanBhutaneseBlackfeetBolivianBrazilianBritishBritish West IndianBulgarianBurmeseCajunCambodianCanadianCape VerdeanCarpatho RusynCelticCentral AmericanCentral American IndianCherokeeCheyenneChickasawChileanChineseChippewaChoctawColombianColvilleComancheCosta RicanCreeCreekCroatianCrowCubanCypriotCzechCzechoslovakianDanishDelawareDominicanDutchDutch West IndianEastern EuropeanEcuadorianEgyptianEnglishEstonianEthiopianEuropeanFijianFilipinoFinnishFrenchFrench American IndianFrench CanadianGermanGerman RussianGhanaianGreekGuamanian/ChamorroGuatemalanGuyaneseHaitianHmongHonduranHopiHoumaHungarianIcelanderIndian (Asian)IndonesianInupiatIranianIraqiIrishIroquoisIsraeliItalianJamaicanJapaneseJordanianKenyanKiowaKoreanLaotianLatvianLebaneseLiberianLithuanianLumbeeLuxembourgerMacedonianMalaysianMalteseMarshalleseMenomineeMexicanMexican American IndianMongolianMoroccanNative HawaiianNavajoNepaleseNew ZealanderNicaraguanNigerianNorthern EuropeanNorwegianOkinawanOsageOttawaPaiutePakistaniPalestinianPanamanianParaguayanPennsylvania GermanPeruvianPimaPolishPortuguesePotawatomiPuebloPuerto RicanPuget Sound SalishRomanianRussianSalvadoranSamoanScandinavianScotch-IrishScottishSeminoleSenegaleseSerbianShoshoneSierra LeoneanSiouxSlavicSlovakSloveneSomaliSouth AfricanSouth AmericanSouth American IndianSoviet UnionSpaniardSpanishSpanish AmericanSpanish American IndianSri LankanSubsaharan AfricanSudaneseSwedishSwissSyrianTaiwaneseThaiTlingit-HaidaTohono O'OdhamTonganTrinidadian and TobagonianTsimshianTurkishU.S. Virgin IslanderUgandanUkrainianUruguayanUteVenezuelanVietnameseWelshWest IndianYakamaYaquiYugoslavianYumanYup'ikZimbabwean
Immigration
NonimmigrantsImmigrantsAfghanistanAfricaAlbaniaArgentinaArmeniaAsiaAustraliaAustriaBahamasBangladeshBarbadosBelarusBelgiumBelizeBoliviaBosnia and HerzegovinaBrazilBulgariaBurma/MyanmarCabo VerdeCambodiaCameroonCanadaCaribbeanCentral AmericaChileChinaColombiaCongoCosta RicaCroatiaCubaCzechoslovakiaDenmarkDominicaDominican RepublicEastern AfricaEastern AsiaEastern EuropeEcuadorEgyptEl SalvadorEnglandEritreaEthiopiaEuropeFijiFranceGermanyGhanaGreeceGrenadaGuatemalaGuyanaHaitiHondurasHong KongHungaryIndiaIndonesiaIranIraqIrelandIsraelItalyJamaicaJapanJordanKazakhstanKenyaKoreaKuwaitLaosLatin AmericaLatviaLebanonLiberiaLithuaniaMalaysiaMexicoMicronesiaMiddle AfricaMoldovaMoroccoNepalNetherlandsNicaraguaNigeriaNorth AmericaNorth MacedoniaNorthern AfricaNorthern EuropeNorwayOceaniaPakistanPanamaPeruPhilippinesPolandPortugalRomaniaRussiaSaudi ArabiaScotlandSenegalSerbiaSierra LeoneSingaporeSomaliaSouth AfricaSouth AmericaSouth Central AsiaSouth Eastern AsiaSouthern EuropeSpainSri LankaSt. Vincent and the GrenadinesSudanSwedenSwitzerlandSyriaTaiwanThailandTrinidad and TobagoTurkeyUgandaUkraineUruguayUzbekistanVenezuelaVietnamWest IndiesWestern AfricaWestern AsiaWestern EuropeYemenZaireZimbabweAzores
Select to Compare
Race
Ancestry
AfghanAfricanAlaska NativeAlaskan AthabascanAlbanianAleutAlsatianAmericanApacheArabArapahoArgentineanArmenianAssyrian/Chaldean/SyriacAustralianAustrianBahamianBangladeshiBarbadianBasqueBelgianBelizeanBermudanBhutaneseBlackfeetBolivianBrazilianBritishBritish West IndianBulgarianBurmeseCajunCambodianCanadianCape VerdeanCarpatho RusynCelticCentral AmericanCentral American IndianCherokeeCheyenneChickasawChileanChineseChippewaChoctawColombianColvilleComancheCosta RicanCreeCreekCroatianCrowCubanCypriotCzechCzechoslovakianDanishDelawareDominicanDutchDutch West IndianEastern EuropeanEgyptianEnglishEstonianEthiopianEuropeanFijianFilipinoFinnishFrenchFrench American IndianFrench CanadianGermanGerman RussianGhanaianGreekGuamanian/ChamorroGuatemalanGuyaneseHaitianHmongHonduranHopiHoumaHungarianIcelanderIndian (Asian)IndonesianInupiatIranianIraqiIrishIroquoisIsraeliItalianJamaicanJapaneseJordanianKenyanKiowaKoreanLaotianLatvianLebaneseLiberianLithuanianLumbeeLuxembourgerMacedonianMalaysianMalteseMarshalleseMenomineeMexicanMexican American IndianMongolianMoroccanNative HawaiianNavajoNepaleseNew ZealanderNicaraguanNigerianNorthern EuropeanNorwegianOkinawanOsageOttawaPaiutePakistaniPalestinianPanamanianParaguayanPennsylvania GermanPeruvianPimaPolishPortuguesePotawatomiPuebloPuerto RicanPuget Sound SalishRomanianRussianSalvadoranSamoanScandinavianScotch-IrishScottishSeminoleSenegaleseSerbianShoshoneSierra LeoneanSiouxSlavicSlovakSloveneSomaliSouth AfricanSouth AmericanSouth American IndianSoviet UnionSpaniardSpanishSpanish AmericanSpanish American IndianSri LankanSubsaharan AfricanSudaneseSwedishSwissSyrianTaiwaneseThaiTlingit-HaidaTohono O'OdhamTonganTrinidadian and TobagonianTsimshianTurkishU.S. Virgin IslanderUgandanUkrainianUruguayanUteVenezuelanVietnameseWelshWest IndianYakamaYaquiYugoslavianYumanYup'ikZimbabwean
Immigration
NonimmigrantsImmigrantsAfghanistanAfricaAlbaniaArgentinaArmeniaAsiaAustraliaAustriaBahamasBangladeshBarbadosBelarusBelgiumBelizeBoliviaBosnia and HerzegovinaBrazilBulgariaBurma/MyanmarCabo VerdeCambodiaCameroonCanadaCaribbeanCentral AmericaChileChinaColombiaCongoCosta RicaCroatiaCubaCzechoslovakiaDenmarkDominicaDominican RepublicEastern AfricaEastern AsiaEastern EuropeEcuadorEgyptEl SalvadorEnglandEritreaEthiopiaEuropeFijiFranceGermanyGhanaGreeceGrenadaGuatemalaGuyanaHaitiHondurasHong KongHungaryIndiaIndonesiaIranIraqIrelandIsraelItalyJamaicaJapanJordanKazakhstanKenyaKoreaKuwaitLaosLatin AmericaLatviaLebanonLiberiaLithuaniaMalaysiaMexicoMicronesiaMiddle AfricaMoldovaMoroccoNepalNetherlandsNicaraguaNigeriaNorth AmericaNorth MacedoniaNorthern AfricaNorthern EuropeNorwayOceaniaPakistanPanamaPeruPhilippinesPolandPortugalRomaniaRussiaSaudi ArabiaScotlandSenegalSerbiaSierra LeoneSingaporeSomaliaSouth AfricaSouth AmericaSouth Central AsiaSouth Eastern AsiaSouthern EuropeSpainSri LankaSt. Vincent and the GrenadinesSudanSwedenSwitzerlandSyriaTaiwanThailandTrinidad and TobagoTurkeyUgandaUkraineUruguayUzbekistanVenezuelaVietnamWest IndiesWestern AfricaWestern AsiaWestern EuropeYemenZaireZimbabweAzores
Unemployment Among Women with Children Ages 6 to 17 years
Income
Poverty
Unemployment
Labor Participation
Family Structure
Vehicle Availability
Education Level
Disability

Ecuadorian Unemployment Among Women with Children Ages 6 to 17 years
Tragic

10.0%
UNEMPLOYMENT | WOMEN W/ CHILDREN 6 TO 17
0.0/ 100
METRIC RATING
294th/ 347
METRIC RANK

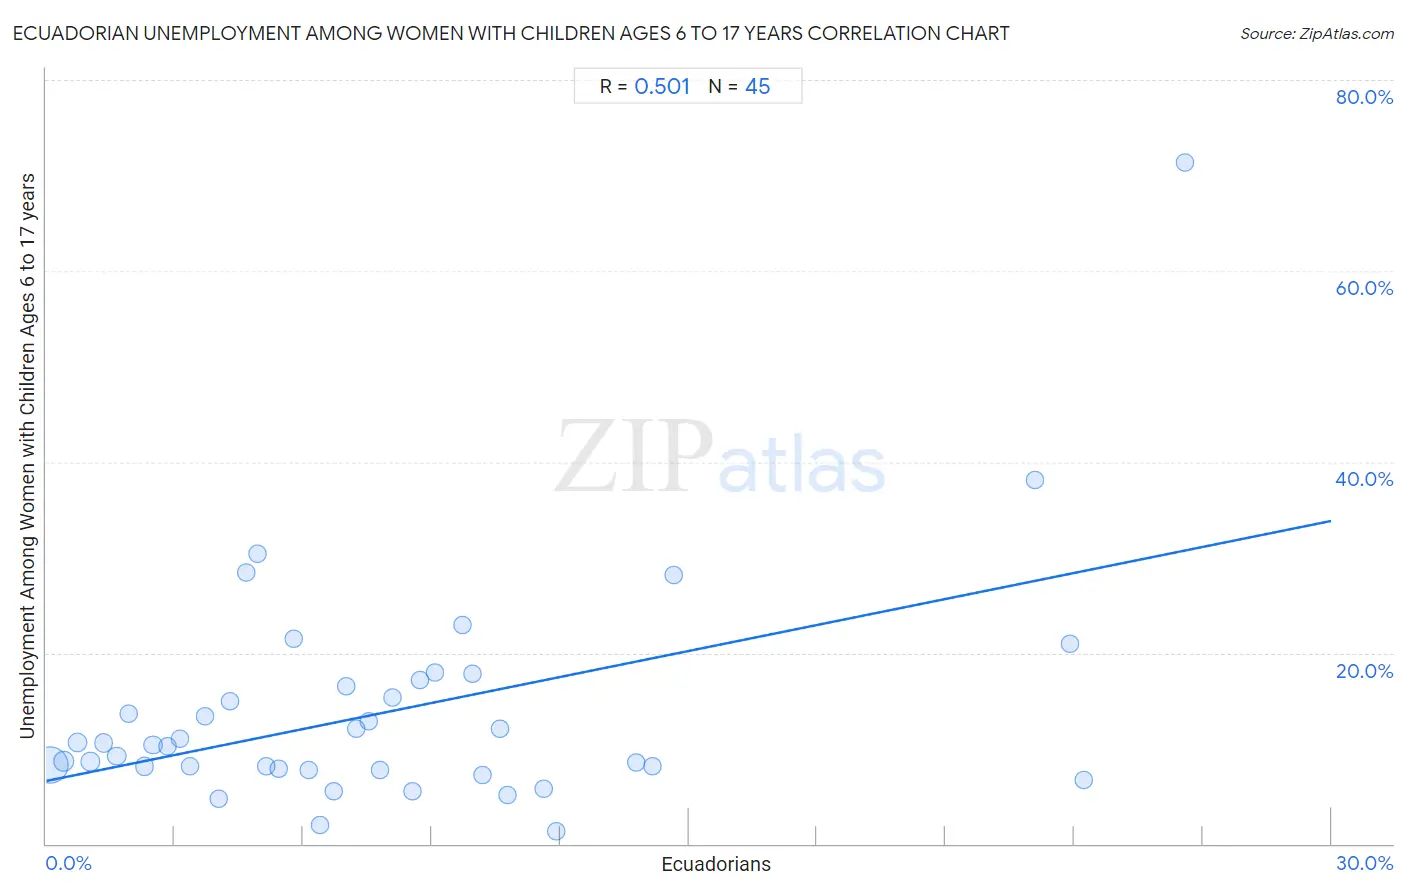
Ecuadorian Unemployment Among Women with Children Ages 6 to 17 years Correlation Chart

The statistical analysis conducted on geographies consisting of 242,852,218 people shows a substantial positive correlation between the proportion of Ecuadorians and unemployment rate among women with children between the ages 6 and 17 in the United States with a correlation coefficient (R) of 0.501 and weighted average of 10.0%. On average, for every 1% (one percent) increase in Ecuadorians within a typical geography, there is an increase of 0.91% in unemployment rate among women with children between the ages 6 and 17.
Ecuadorian Unemployment Among Women with Children Ages 6 to 17 years
It is essential to understand that the correlation between the percentage of Ecuadorians and unemployment rate among women with children between the ages 6 and 17 does not imply a direct cause-and-effect relationship. It remains uncertain whether the presence of Ecuadorians influences an upward or downward trend in the level of unemployment rate among women with children between the ages 6 and 17 within an area, or if Ecuadorians simply ended up residing in those areas with higher or lower levels of unemployment rate among women with children between the ages 6 and 17 due to other factors.

Demographics Similar to Ecuadorians by Unemployment Among Women with Children Ages 6 to 17 years

In terms of unemployment among women with children ages 6 to 17 years, the demographic groups most similar to Ecuadorians are Cherokee (10.0%, a difference of 0.030%), Haitian (10.0%, a difference of 0.090%), Carpatho Rusyn (10.0%, a difference of 0.18%), Nonimmigrants (10.0%, a difference of 0.19%), and Subsaharan African (10.0%, a difference of 0.22%).
DemographicsRating | RankUnemployment Among Women with Children Ages 6 to 17 years
Sierra Leoneans
0.0
/100
|
#287
Tragic
9.9%
Shoshone
0.0
/100
|
#288
Tragic
10.0%
Hondurans
0.0
/100
|
#289
Tragic
10.0%
Sub-Saharan Africans
0.0
/100
|
#290
Tragic
10.0%
Nonimmigrants
0.0
/100
|
#291
Tragic
10.0%
Carpatho Rusyns
0.0
/100
|
#292
Tragic
10.0%
Haitians
0.0
/100
|
#293
Tragic
10.0%
Ecuadorians
0.0
/100
|
#294
Tragic
10.0%
Cherokee
0.0
/100
|
#295
Tragic
10.0%
Immigrants from Western Africa
0.0
/100
|
#296
Tragic
10.1%
Immigrants from Caribbean
0.0
/100
|
#297
Tragic
10.1%
Immigrants from Haiti
0.0
/100
|
#298
Tragic
10.1%
Immigrants from Honduras
0.0
/100
|
#299
Tragic
10.1%
Nigerians
0.0
/100
|
#300
Tragic
10.1%
Immigrants from Bahamas
0.0
/100
|
#301
Tragic
10.1%

Ecuadorian Unemployment Among Women with Children Ages 6 to 17 years Correlation Summary

MeasurementEcuadorian DataUnemployment Among Women with Children Ages 6 to 17 years Data
Minimum0.097%1.3%
Maximum26.6%71.4%
Range26.5%70.1%
Mean7.9%13.8%
Median6.7%10.3%
Interquartile 25% (IQ1)3.2%7.8%
Interquartile 75% (IQ3)10.4%16.8%
Interquartile Range (IQR)7.1%9.0%
Standard Deviation (Sample)6.5%11.7%
Standard Deviation (Population)6.4%11.6%

Correlation Details

Ecuadorian PercentileSample SizeUnemployment Among Women with Children Ages 6 to 17 years
[
0.0%
-
0.5%
]
0.097%
178,319,3808.2%
[
0.0%
-
0.5%
]
0.42%
23,852,5818.7%
[
0.5%
-
1.0%
]
0.74%
12,474,74410.6%
[
1.0%
-
1.5%
]
1.03%
5,107,1028.6%
[
1.0%
-
1.5%
]
1.34%
2,788,23610.5%
[
1.5%
-
2.0%
]
1.64%
2,762,8059.2%
[
1.5%
-
2.0%
]
1.92%
1,246,50913.7%
[
2.0%
-
2.5%
]
2.29%
9,780,8478.1%
[
2.0%
-
2.5%
]
2.49%
1,327,62410.3%
[
2.5%
-
3.0%
]
2.82%
733,22210.3%
[
3.0%
-
3.5%
]
3.13%
510,26610.9%
[
3.0%
-
3.5%
]
3.37%
438,2038.1%
[
3.5%
-
4.0%
]
3.71%
113,44513.3%
[
4.0%
-
4.5%
]
4.04%
143,5374.7%
[
4.0%
-
4.5%
]
4.29%
277,63814.9%
[
4.5%
-
5.0%
]
4.68%
180,15128.5%
[
4.5%
-
5.0%
]
4.94%
32,72330.4%
[
5.0%
-
5.5%
]
5.13%
216,5238.1%
[
5.0%
-
5.5%
]
5.43%
26,0937.9%
[
5.5%
-
6.0%
]
5.79%
63,47121.5%
[
6.0%
-
6.5%
]
6.12%
124,0377.7%
[
6.0%
-
6.5%
]
6.40%
92,8122.0%
[
6.5%
-
7.0%
]
6.72%
158,8785.5%
[
6.5%
-
7.0%
]
6.99%
33,45516.5%
[
7.0%
-
7.5%
]
7.25%
220,84712.0%
[
7.5%
-
8.0%
]
7.52%
181,92412.8%
[
7.5%
-
8.0%
]
7.80%
62,0667.7%
[
8.0%
-
8.5%
]
8.07%
72,84515.3%
[
8.5%
-
9.0%
]
8.55%
133,5365.5%
[
8.5%
-
9.0%
]
8.72%
329,29017.1%
[
9.0%
-
9.5%
]
9.08%
27,79418.0%
[
9.5%
-
10.0%
]
9.73%
20,58622.9%
[
9.5%
-
10.0%
]
9.96%
219,55717.9%
[
10.0%
-
10.5%
]
10.20%
32,9637.2%
[
10.5%
-
11.0%
]
10.58%
91,51612.1%
[
10.5%
-
11.0%
]
10.78%
86,4565.1%
[
11.5%
-
12.0%
]
11.62%
102,6185.8%
[
11.5%
-
12.0%
]
11.89%
105,5211.3%
[
13.5%
-
14.0%
]
13.78%
105,7598.6%
[
14.0%
-
14.5%
]
14.15%
37,8938.1%
[
14.5%
-
15.0%
]
14.65%
41,90728.2%
[
23.0%
-
23.5%
]
23.08%
1,00538.1%
[
23.5%
-
24.0%
]
23.90%
112,75021.0%
[
24.0%
-
24.5%
]
24.24%
56,6966.7%
[
26.5%
-
27.0%
]
26.59%
4,40771.4%