Ecuadorian Disability
COMPARE
Ecuadorian
Select to Compare
Disability
Ecuadorian Disability
11.2%
DISABILITY
98.0/ 100
METRIC RATING
92nd/ 347
METRIC RANK
Ecuadorian Disability Correlation Chart
The statistical analysis conducted on geographies consisting of 317,822,544 people shows a poor negative correlation between the proportion of Ecuadorians and percentage of population with a disability in the United States with a correlation coefficient (R) of -0.164 and weighted average of 11.2%. On average, for every 1% (one percent) increase in Ecuadorians within a typical geography, there is a decrease of 0.052% in percentage of population with a disability.
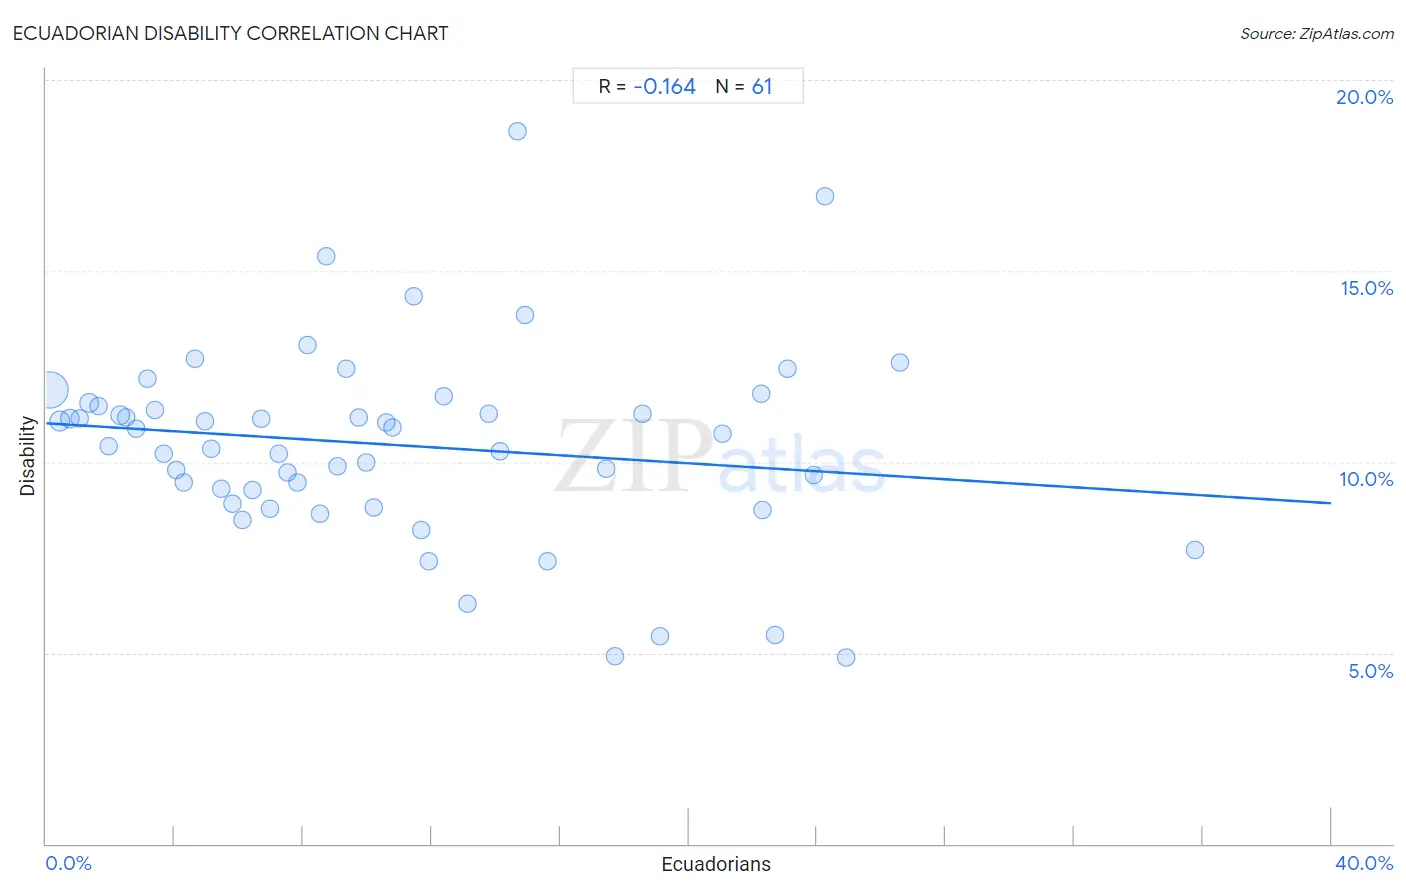
It is essential to understand that the correlation between the percentage of Ecuadorians and percentage of population with a disability does not imply a direct cause-and-effect relationship. It remains uncertain whether the presence of Ecuadorians influences an upward or downward trend in the level of percentage of population with a disability within an area, or if Ecuadorians simply ended up residing in those areas with higher or lower levels of percentage of population with a disability due to other factors.
Demographics Similar to Ecuadorians by Disability
In terms of disability, the demographic groups most similar to Ecuadorians are Immigrants from Ecuador (11.2%, a difference of 0.0%), Immigrants from Western Asia (11.2%, a difference of 0.040%), Immigrants from Brazil (11.2%, a difference of 0.060%), Immigrants from South Africa (11.2%, a difference of 0.11%), and Immigrants from Morocco (11.2%, a difference of 0.12%).
| Demographics | Rating | Rank | Disability |
| Immigrants from Belarus | 98.9 /100 | #85 | Exceptional 11.1% |
| Immigrants from Russia | 98.9 /100 | #86 | Exceptional 11.1% |
| Palestinians | 98.9 /100 | #87 | Exceptional 11.1% |
| Immigrants from Romania | 98.5 /100 | #88 | Exceptional 11.2% |
| Immigrants from South Africa | 98.2 /100 | #89 | Exceptional 11.2% |
| Immigrants from Brazil | 98.1 /100 | #90 | Exceptional 11.2% |
| Immigrants from Western Asia | 98.1 /100 | #91 | Exceptional 11.2% |
| Ecuadorians | 98.0 /100 | #92 | Exceptional 11.2% |
| Immigrants from Ecuador | 98.0 /100 | #93 | Exceptional 11.2% |
| Immigrants from Morocco | 97.8 /100 | #94 | Exceptional 11.2% |
| Eastern Europeans | 97.8 /100 | #95 | Exceptional 11.2% |
| Immigrants from Zimbabwe | 97.7 /100 | #96 | Exceptional 11.2% |
| Bhutanese | 97.4 /100 | #97 | Exceptional 11.2% |
| Uruguayans | 97.4 /100 | #98 | Exceptional 11.2% |
| Immigrants from Czechoslovakia | 97.4 /100 | #99 | Exceptional 11.2% |
Ecuadorian Disability Correlation Summary
| Measurement | Ecuadorian Data | Disability Data |
| Minimum | 0.10% | 4.9% |
| Maximum | 35.8% | 18.7% |
| Range | 35.7% | 13.8% |
| Mean | 10.8% | 10.4% |
| Median | 9.1% | 10.7% |
| Interquartile 25% (IQ1) | 4.5% | 9.1% |
| Interquartile 75% (IQ3) | 15.2% | 11.5% |
| Interquartile Range (IQR) | 10.8% | 2.4% |
| Standard Deviation (Sample) | 8.0% | 2.5% |
| Standard Deviation (Population) | 7.9% | 2.5% |
Correlation Details
| Ecuadorian Percentile | Sample Size | Disability |
[ 0.0% - 0.5% ] 0.10% | 225,935,498 | 11.9% |
[ 0.0% - 0.5% ] 0.42% | 35,455,147 | 11.1% |
[ 0.5% - 1.0% ] 0.74% | 18,235,609 | 11.1% |
[ 1.0% - 1.5% ] 1.03% | 7,929,214 | 11.1% |
[ 1.0% - 1.5% ] 1.33% | 4,841,795 | 11.5% |
[ 1.5% - 2.0% ] 1.64% | 3,863,454 | 11.5% |
[ 1.5% - 2.0% ] 1.93% | 1,926,871 | 10.4% |
[ 2.0% - 2.5% ] 2.29% | 10,140,357 | 11.2% |
[ 2.0% - 2.5% ] 2.49% | 1,889,443 | 11.2% |
[ 2.5% - 3.0% ] 2.82% | 1,070,606 | 10.9% |
[ 3.0% - 3.5% ] 3.16% | 1,010,391 | 12.2% |
[ 3.0% - 3.5% ] 3.39% | 701,516 | 11.4% |
[ 3.5% - 4.0% ] 3.68% | 275,994 | 10.2% |
[ 4.0% - 4.5% ] 4.04% | 209,404 | 9.8% |
[ 4.0% - 4.5% ] 4.28% | 370,549 | 9.4% |
[ 4.5% - 5.0% ] 4.62% | 297,502 | 12.7% |
[ 4.5% - 5.0% ] 4.94% | 76,880 | 11.1% |
[ 5.0% - 5.5% ] 5.12% | 295,399 | 10.3% |
[ 5.0% - 5.5% ] 5.45% | 98,704 | 9.3% |
[ 5.5% - 6.0% ] 5.79% | 75,504 | 8.9% |
[ 6.0% - 6.5% ] 6.10% | 159,101 | 8.5% |
[ 6.0% - 6.5% ] 6.41% | 105,683 | 9.3% |
[ 6.5% - 7.0% ] 6.71% | 199,062 | 11.1% |
[ 6.5% - 7.0% ] 6.97% | 101,959 | 8.8% |
[ 7.0% - 7.5% ] 7.25% | 222,817 | 10.2% |
[ 7.5% - 8.0% ] 7.52% | 182,213 | 9.7% |
[ 7.5% - 8.0% ] 7.83% | 150,353 | 9.4% |
[ 8.0% - 8.5% ] 8.12% | 107,043 | 13.1% |
[ 8.5% - 9.0% ] 8.53% | 156,526 | 8.6% |
[ 8.5% - 9.0% ] 8.72% | 334,815 | 15.4% |
[ 9.0% - 9.5% ] 9.07% | 31,554 | 9.9% |
[ 9.0% - 9.5% ] 9.34% | 12,343 | 12.4% |
[ 9.5% - 10.0% ] 9.74% | 51,505 | 11.2% |
[ 9.5% - 10.0% ] 9.96% | 227,148 | 10.0% |
[ 10.0% - 10.5% ] 10.20% | 32,963 | 8.8% |
[ 10.5% - 11.0% ] 10.58% | 91,516 | 11.0% |
[ 10.5% - 11.0% ] 10.78% | 86,456 | 10.9% |
[ 11.0% - 11.5% ] 11.43% | 22,800 | 14.3% |
[ 11.5% - 12.0% ] 11.65% | 127,356 | 8.2% |
[ 11.5% - 12.0% ] 11.90% | 112,396 | 7.4% |
[ 12.0% - 12.5% ] 12.37% | 100,539 | 11.7% |
[ 13.0% - 13.5% ] 13.11% | 9,606 | 6.3% |
[ 13.5% - 14.0% ] 13.78% | 112,299 | 11.3% |
[ 14.0% - 14.5% ] 14.12% | 70,524 | 10.3% |
[ 14.5% - 15.0% ] 14.65% | 42,547 | 18.7% |
[ 14.5% - 15.0% ] 14.89% | 27,708 | 13.8% |
[ 15.5% - 16.0% ] 15.59% | 9,126 | 7.4% |
[ 17.0% - 17.5% ] 17.43% | 11,777 | 9.8% |
[ 17.5% - 18.0% ] 17.72% | 1,078 | 4.9% |
[ 18.5% - 19.0% ] 18.55% | 275 | 11.3% |
[ 19.0% - 19.5% ] 19.11% | 21,040 | 5.4% |
[ 21.0% - 21.5% ] 21.04% | 1,231 | 10.7% |
[ 22.0% - 22.5% ] 22.25% | 5,946 | 11.8% |
[ 22.0% - 22.5% ] 22.28% | 1,077 | 8.7% |
[ 22.5% - 23.0% ] 22.68% | 5,587 | 5.5% |
[ 23.0% - 23.5% ] 23.08% | 1,005 | 12.4% |
[ 23.5% - 24.0% ] 23.90% | 112,750 | 9.7% |
[ 24.0% - 24.5% ] 24.24% | 56,696 | 16.9% |
[ 24.5% - 25.0% ] 24.90% | 9,162 | 4.9% |
[ 26.5% - 27.0% ] 26.59% | 4,407 | 12.6% |
[ 35.5% - 36.0% ] 35.76% | 2,718 | 7.7% |