Ecuadorian College, 1 year or more
COMPARE
Ecuadorian
Select to Compare
College, 1 year or more
Ecuadorian College, 1 year or more
54.3%
COLLEGE, 1 YEAR OR MORE
0.2/ 100
METRIC RATING
277th/ 347
METRIC RANK
Ecuadorian College, 1 year or more Correlation Chart
The statistical analysis conducted on geographies consisting of 317,865,755 people shows a mild negative correlation between the proportion of Ecuadorians and percentage of population with at least college, 1 year or more education in the United States with a correlation coefficient (R) of -0.312 and weighted average of 54.3%. On average, for every 1% (one percent) increase in Ecuadorians within a typical geography, there is a decrease of 0.29% in percentage of population with at least college, 1 year or more education.
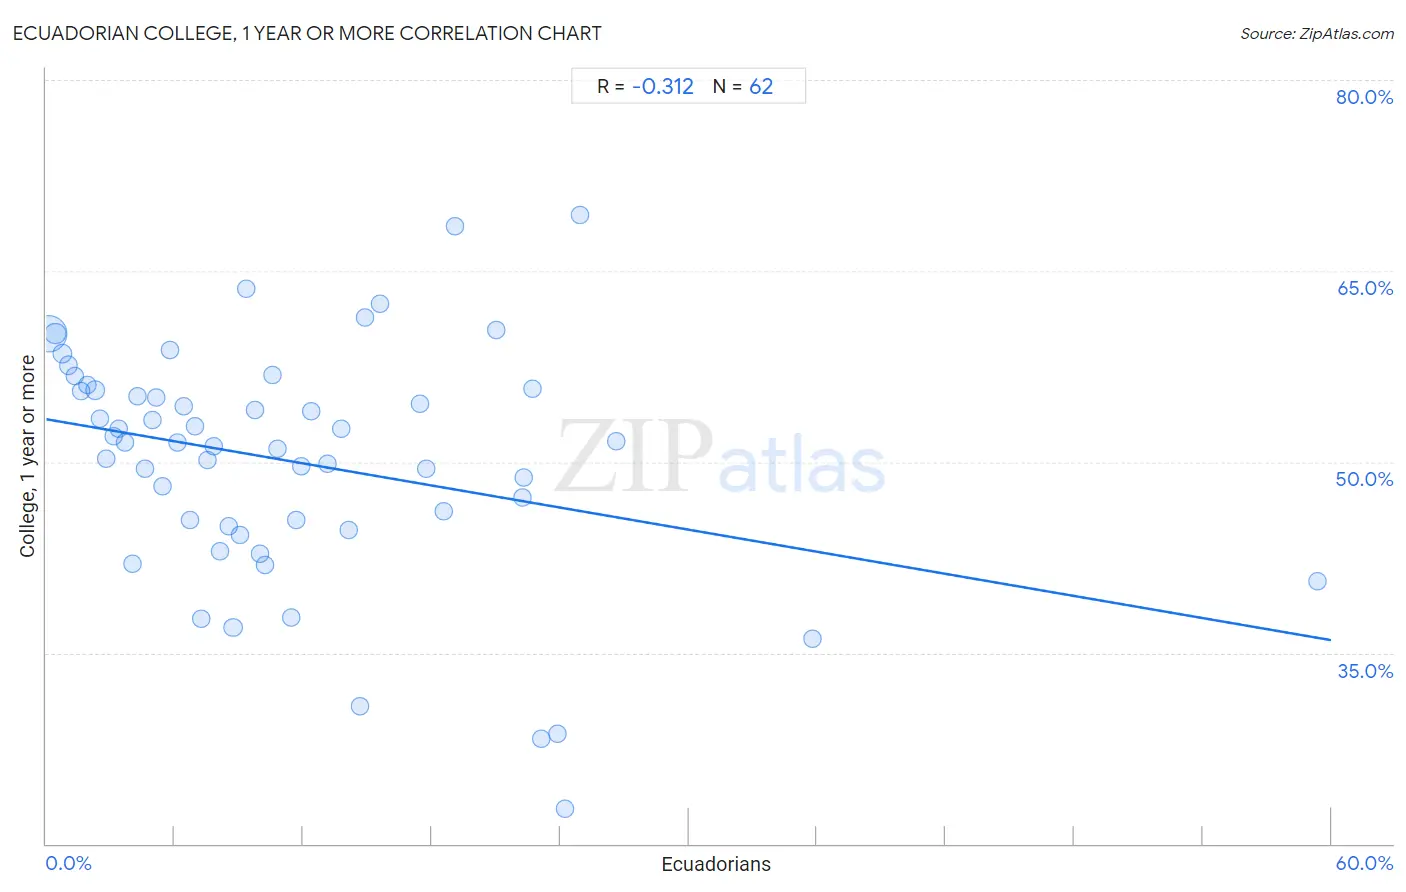
It is essential to understand that the correlation between the percentage of Ecuadorians and percentage of population with at least college, 1 year or more education does not imply a direct cause-and-effect relationship. It remains uncertain whether the presence of Ecuadorians influences an upward or downward trend in the level of percentage of population with at least college, 1 year or more education within an area, or if Ecuadorians simply ended up residing in those areas with higher or lower levels of percentage of population with at least college, 1 year or more education due to other factors.
Demographics Similar to Ecuadorians by College, 1 year or more
In terms of college, 1 year or more, the demographic groups most similar to Ecuadorians are Shoshone (54.3%, a difference of 0.040%), American (54.4%, a difference of 0.12%), Belizean (54.4%, a difference of 0.15%), Immigrants from Grenada (54.4%, a difference of 0.19%), and Comanche (54.4%, a difference of 0.22%).
| Demographics | Rating | Rank | College, 1 year or more |
| Crow | 0.2 /100 | #270 | Tragic 54.5% |
| Bahamians | 0.2 /100 | #271 | Tragic 54.5% |
| Comanche | 0.2 /100 | #272 | Tragic 54.4% |
| Immigrants from Grenada | 0.2 /100 | #273 | Tragic 54.4% |
| Belizeans | 0.2 /100 | #274 | Tragic 54.4% |
| Americans | 0.2 /100 | #275 | Tragic 54.4% |
| Shoshone | 0.2 /100 | #276 | Tragic 54.3% |
| Ecuadorians | 0.2 /100 | #277 | Tragic 54.3% |
| Immigrants from Jamaica | 0.1 /100 | #278 | Tragic 54.2% |
| Arapaho | 0.1 /100 | #279 | Tragic 54.1% |
| Cheyenne | 0.1 /100 | #280 | Tragic 54.1% |
| Colville | 0.1 /100 | #281 | Tragic 54.1% |
| Guyanese | 0.1 /100 | #282 | Tragic 54.1% |
| Nicaraguans | 0.1 /100 | #283 | Tragic 53.9% |
| Ute | 0.1 /100 | #284 | Tragic 53.8% |
Ecuadorian College, 1 year or more Correlation Summary
| Measurement | Ecuadorian Data | College, 1 year or more Data |
| Minimum | 0.10% | 22.7% |
| Maximum | 59.4% | 69.4% |
| Range | 59.3% | 46.6% |
| Mean | 11.5% | 50.0% |
| Median | 9.2% | 51.5% |
| Interquartile 25% (IQ1) | 4.6% | 44.9% |
| Interquartile 75% (IQ3) | 15.6% | 55.7% |
| Interquartile Range (IQR) | 11.0% | 10.7% |
| Standard Deviation (Sample) | 10.0% | 9.3% |
| Standard Deviation (Population) | 9.9% | 9.2% |
Correlation Details
| Ecuadorian Percentile | Sample Size | College, 1 year or more |
[ 0.0% - 0.5% ] 0.10% | 225,971,849 | 60.1% |
[ 0.0% - 0.5% ] 0.42% | 35,456,479 | 60.1% |
[ 0.5% - 1.0% ] 0.74% | 18,239,071 | 58.5% |
[ 1.0% - 1.5% ] 1.03% | 7,929,214 | 57.6% |
[ 1.0% - 1.5% ] 1.33% | 4,841,795 | 56.8% |
[ 1.5% - 2.0% ] 1.64% | 3,861,198 | 55.5% |
[ 1.5% - 2.0% ] 1.93% | 1,926,433 | 56.1% |
[ 2.0% - 2.5% ] 2.29% | 10,140,357 | 55.7% |
[ 2.0% - 2.5% ] 2.49% | 1,889,443 | 53.4% |
[ 2.5% - 3.0% ] 2.82% | 1,070,606 | 50.3% |
[ 3.0% - 3.5% ] 3.16% | 1,010,740 | 52.0% |
[ 3.0% - 3.5% ] 3.39% | 701,516 | 52.6% |
[ 3.5% - 4.0% ] 3.68% | 275,994 | 51.5% |
[ 4.0% - 4.5% ] 4.04% | 212,133 | 42.0% |
[ 4.0% - 4.5% ] 4.28% | 370,549 | 55.1% |
[ 4.5% - 5.0% ] 4.62% | 297,502 | 49.4% |
[ 4.5% - 5.0% ] 4.94% | 76,880 | 53.3% |
[ 5.0% - 5.5% ] 5.12% | 295,399 | 55.1% |
[ 5.0% - 5.5% ] 5.45% | 98,704 | 48.1% |
[ 5.5% - 6.0% ] 5.79% | 75,504 | 58.8% |
[ 6.0% - 6.5% ] 6.10% | 159,101 | 51.5% |
[ 6.0% - 6.5% ] 6.41% | 105,683 | 54.4% |
[ 6.5% - 7.0% ] 6.71% | 199,062 | 45.4% |
[ 6.5% - 7.0% ] 6.97% | 101,959 | 52.8% |
[ 7.0% - 7.5% ] 7.25% | 222,817 | 37.7% |
[ 7.5% - 8.0% ] 7.52% | 183,356 | 50.2% |
[ 7.5% - 8.0% ] 7.83% | 150,353 | 51.3% |
[ 8.0% - 8.5% ] 8.12% | 107,043 | 43.0% |
[ 8.5% - 9.0% ] 8.53% | 156,526 | 44.9% |
[ 8.5% - 9.0% ] 8.72% | 334,815 | 37.0% |
[ 9.0% - 9.5% ] 9.07% | 31,554 | 44.3% |
[ 9.0% - 9.5% ] 9.34% | 12,343 | 63.6% |
[ 9.5% - 10.0% ] 9.74% | 51,505 | 54.1% |
[ 9.5% - 10.0% ] 9.96% | 227,148 | 42.8% |
[ 10.0% - 10.5% ] 10.20% | 32,963 | 41.9% |
[ 10.5% - 11.0% ] 10.58% | 91,516 | 56.8% |
[ 10.5% - 11.0% ] 10.78% | 86,963 | 51.1% |
[ 11.0% - 11.5% ] 11.43% | 22,800 | 37.8% |
[ 11.5% - 12.0% ] 11.65% | 127,356 | 45.4% |
[ 11.5% - 12.0% ] 11.90% | 112,396 | 49.6% |
[ 12.0% - 12.5% ] 12.37% | 100,539 | 54.0% |
[ 13.0% - 13.5% ] 13.11% | 9,606 | 49.9% |
[ 13.5% - 14.0% ] 13.78% | 112,299 | 52.6% |
[ 14.0% - 14.5% ] 14.12% | 70,524 | 44.6% |
[ 14.5% - 15.0% ] 14.65% | 42,547 | 30.8% |
[ 14.5% - 15.0% ] 14.89% | 27,708 | 61.3% |
[ 15.5% - 16.0% ] 15.59% | 9,126 | 62.4% |
[ 17.0% - 17.5% ] 17.43% | 11,777 | 54.5% |
[ 17.5% - 18.0% ] 17.72% | 1,078 | 49.5% |
[ 18.5% - 19.0% ] 18.55% | 275 | 46.1% |
[ 19.0% - 19.5% ] 19.11% | 21,040 | 68.5% |
[ 21.0% - 21.5% ] 21.04% | 1,231 | 60.3% |
[ 22.0% - 22.5% ] 22.25% | 5,946 | 47.2% |
[ 22.0% - 22.5% ] 22.28% | 1,077 | 48.7% |
[ 22.5% - 23.0% ] 22.68% | 5,587 | 55.7% |
[ 23.0% - 23.5% ] 23.08% | 1,005 | 28.3% |
[ 23.5% - 24.0% ] 23.90% | 112,750 | 28.6% |
[ 24.0% - 24.5% ] 24.24% | 56,696 | 22.7% |
[ 24.5% - 25.0% ] 24.90% | 9,162 | 69.4% |
[ 26.5% - 27.0% ] 26.59% | 4,407 | 51.6% |
[ 35.5% - 36.0% ] 35.76% | 2,718 | 36.1% |
[ 59.0% - 59.5% ] 59.38% | 32 | 40.6% |