Ecuadorian 4 or more Vehicles in Household
COMPARE
Ecuadorian
Select to Compare
4 or more Vehicles in Household
Ecuadorian 4 or more Vehicles in Household
4.5%
4+ VEHICLES AVAILABLE
0.0/ 100
METRIC RATING
321st/ 347
METRIC RANK
Ecuadorian 4 or more Vehicles in Household Correlation Chart
The statistical analysis conducted on geographies consisting of 316,107,100 people shows a poor negative correlation between the proportion of Ecuadorians and percentage of households with 4 or more vehicles available in the United States with a correlation coefficient (R) of -0.118 and weighted average of 4.5%. On average, for every 1% (one percent) increase in Ecuadorians within a typical geography, there is a decrease of 0.039% in percentage of households with 4 or more vehicles available.
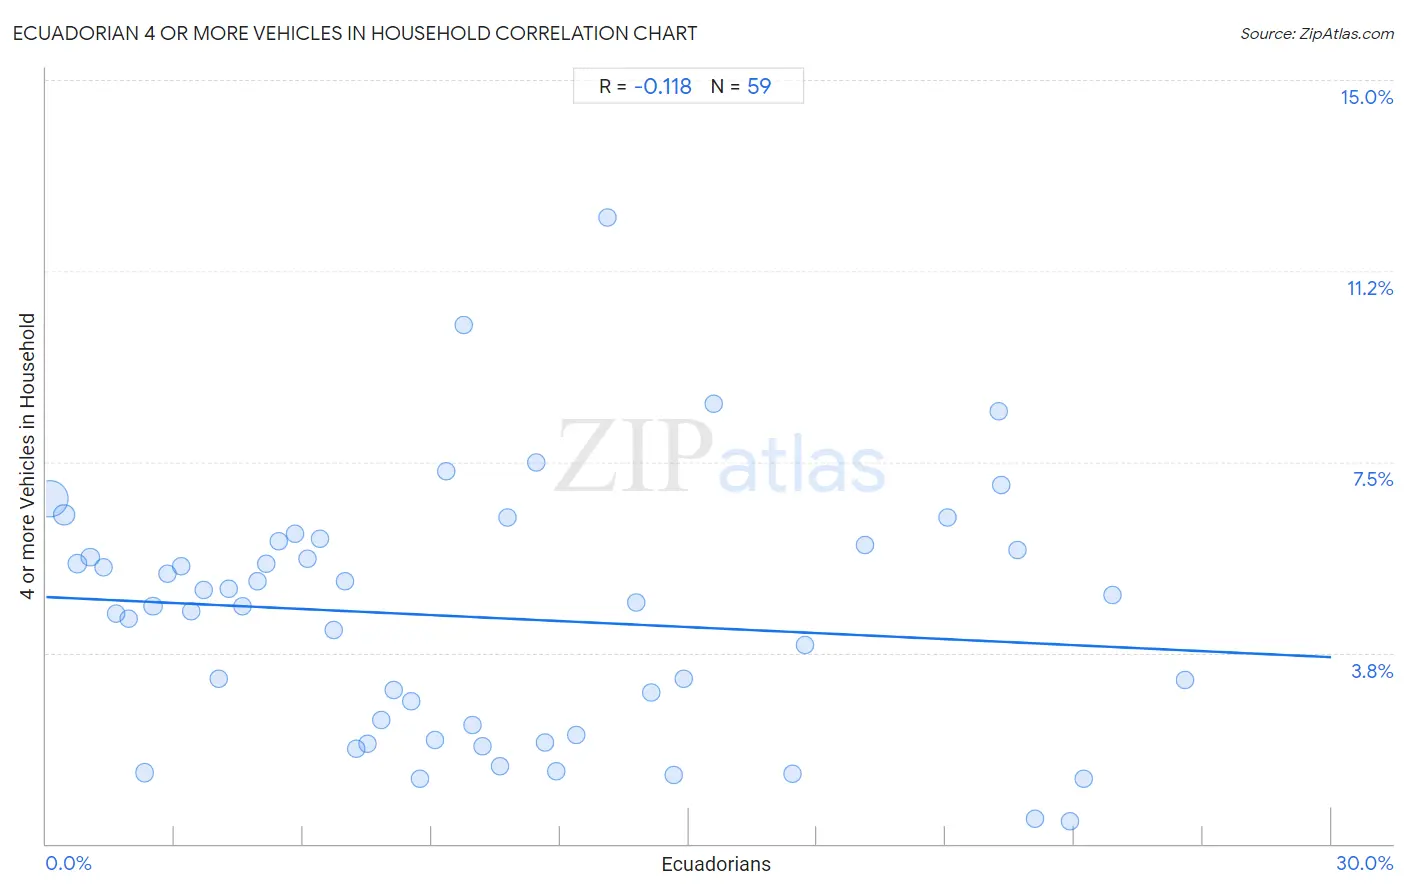
It is essential to understand that the correlation between the percentage of Ecuadorians and percentage of households with 4 or more vehicles available does not imply a direct cause-and-effect relationship. It remains uncertain whether the presence of Ecuadorians influences an upward or downward trend in the level of percentage of households with 4 or more vehicles available within an area, or if Ecuadorians simply ended up residing in those areas with higher or lower levels of percentage of households with 4 or more vehicles available due to other factors.
Demographics Similar to Ecuadorians by 4 or more Vehicles in Household
In terms of 4 or more vehicles in household, the demographic groups most similar to Ecuadorians are Immigrants from Yemen (4.5%, a difference of 0.17%), Immigrants from Caribbean (4.4%, a difference of 0.58%), Immigrants from Haiti (4.5%, a difference of 0.75%), Soviet Union (4.4%, a difference of 0.86%), and Immigrants from Jamaica (4.4%, a difference of 1.2%).
| Demographics | Rating | Rank | 4 or more Vehicles in Household |
| Immigrants from West Indies | 0.0 /100 | #314 | Tragic 4.7% |
| Immigrants from Belarus | 0.0 /100 | #315 | Tragic 4.7% |
| Puerto Ricans | 0.0 /100 | #316 | Tragic 4.7% |
| U.S. Virgin Islanders | 0.0 /100 | #317 | Tragic 4.6% |
| Jamaicans | 0.0 /100 | #318 | Tragic 4.6% |
| Haitians | 0.0 /100 | #319 | Tragic 4.6% |
| Immigrants from Haiti | 0.0 /100 | #320 | Tragic 4.5% |
| Ecuadorians | 0.0 /100 | #321 | Tragic 4.5% |
| Immigrants from Yemen | 0.0 /100 | #322 | Tragic 4.5% |
| Immigrants from Caribbean | 0.0 /100 | #323 | Tragic 4.4% |
| Soviet Union | 0.0 /100 | #324 | Tragic 4.4% |
| Immigrants from Jamaica | 0.0 /100 | #325 | Tragic 4.4% |
| Cape Verdeans | 0.0 /100 | #326 | Tragic 4.4% |
| Senegalese | 0.0 /100 | #327 | Tragic 4.3% |
| Trinidadians and Tobagonians | 0.0 /100 | #328 | Tragic 4.3% |
Ecuadorian 4 or more Vehicles in Household Correlation Summary
| Measurement | Ecuadorian Data | 4 or more Vehicles in Household Data |
| Minimum | 0.10% | 0.44% |
| Maximum | 26.6% | 12.3% |
| Range | 26.5% | 11.9% |
| Mean | 10.2% | 4.4% |
| Median | 8.7% | 4.7% |
| Interquartile 25% (IQ1) | 4.3% | 2.1% |
| Interquartile 75% (IQ3) | 14.7% | 5.9% |
| Interquartile Range (IQR) | 10.4% | 3.8% |
| Standard Deviation (Sample) | 7.3% | 2.4% |
| Standard Deviation (Population) | 7.2% | 2.4% |
Correlation Details
| Ecuadorian Percentile | Sample Size | 4 or more Vehicles in Household |
[ 0.0% - 0.5% ] 0.10% | 225,344,615 | 6.8% |
[ 0.0% - 0.5% ] 0.42% | 35,207,336 | 6.5% |
[ 0.5% - 1.0% ] 0.74% | 18,162,690 | 5.5% |
[ 1.0% - 1.5% ] 1.03% | 7,851,195 | 5.6% |
[ 1.0% - 1.5% ] 1.33% | 4,705,547 | 5.4% |
[ 1.5% - 2.0% ] 1.64% | 3,729,013 | 4.5% |
[ 1.5% - 2.0% ] 1.93% | 1,859,796 | 4.4% |
[ 2.0% - 2.5% ] 2.29% | 10,127,481 | 1.4% |
[ 2.0% - 2.5% ] 2.49% | 1,833,473 | 4.7% |
[ 2.5% - 3.0% ] 2.82% | 1,060,441 | 5.3% |
[ 3.0% - 3.5% ] 3.16% | 963,004 | 5.5% |
[ 3.0% - 3.5% ] 3.39% | 696,924 | 4.6% |
[ 3.5% - 4.0% ] 3.68% | 275,994 | 5.0% |
[ 4.0% - 4.5% ] 4.04% | 208,939 | 3.2% |
[ 4.0% - 4.5% ] 4.27% | 342,412 | 5.0% |
[ 4.5% - 5.0% ] 4.59% | 237,022 | 4.7% |
[ 4.5% - 5.0% ] 4.94% | 63,374 | 5.2% |
[ 5.0% - 5.5% ] 5.12% | 209,749 | 5.5% |
[ 5.0% - 5.5% ] 5.44% | 89,101 | 5.9% |
[ 5.5% - 6.0% ] 5.79% | 75,504 | 6.1% |
[ 6.0% - 6.5% ] 6.10% | 158,793 | 5.6% |
[ 6.0% - 6.5% ] 6.41% | 105,683 | 6.0% |
[ 6.5% - 7.0% ] 6.71% | 199,062 | 4.2% |
[ 6.5% - 7.0% ] 6.96% | 100,875 | 5.1% |
[ 7.0% - 7.5% ] 7.25% | 222,817 | 1.9% |
[ 7.5% - 8.0% ] 7.51% | 135,030 | 2.0% |
[ 7.5% - 8.0% ] 7.83% | 150,353 | 2.4% |
[ 8.0% - 8.5% ] 8.12% | 107,043 | 3.0% |
[ 8.5% - 9.0% ] 8.53% | 155,607 | 2.8% |
[ 8.5% - 9.0% ] 8.72% | 334,815 | 1.3% |
[ 9.0% - 9.5% ] 9.07% | 31,554 | 2.0% |
[ 9.0% - 9.5% ] 9.34% | 12,343 | 7.3% |
[ 9.5% - 10.0% ] 9.74% | 50,351 | 10.2% |
[ 9.5% - 10.0% ] 9.96% | 224,421 | 2.3% |
[ 10.0% - 10.5% ] 10.20% | 32,963 | 1.9% |
[ 10.5% - 11.0% ] 10.58% | 91,516 | 1.5% |
[ 10.5% - 11.0% ] 10.78% | 86,456 | 6.4% |
[ 11.0% - 11.5% ] 11.43% | 21,332 | 7.5% |
[ 11.5% - 12.0% ] 11.65% | 127,356 | 2.0% |
[ 11.5% - 12.0% ] 11.90% | 112,396 | 1.4% |
[ 12.0% - 12.5% ] 12.37% | 100,539 | 2.1% |
[ 13.0% - 13.5% ] 13.11% | 9,461 | 12.3% |
[ 13.5% - 14.0% ] 13.78% | 112,299 | 4.7% |
[ 14.0% - 14.5% ] 14.12% | 70,070 | 3.0% |
[ 14.5% - 15.0% ] 14.65% | 42,547 | 1.4% |
[ 14.5% - 15.0% ] 14.89% | 27,708 | 3.2% |
[ 15.5% - 16.0% ] 15.59% | 9,126 | 8.6% |
[ 17.0% - 17.5% ] 17.43% | 11,777 | 1.4% |
[ 17.5% - 18.0% ] 17.72% | 1,078 | 3.9% |
[ 19.0% - 19.5% ] 19.11% | 21,040 | 5.9% |
[ 21.0% - 21.5% ] 21.04% | 1,231 | 6.4% |
[ 22.0% - 22.5% ] 22.25% | 5,164 | 8.5% |
[ 22.0% - 22.5% ] 22.28% | 1,077 | 7.0% |
[ 22.5% - 23.0% ] 22.68% | 5,587 | 5.8% |
[ 23.0% - 23.5% ] 23.08% | 1,005 | 0.49% |
[ 23.5% - 24.0% ] 23.90% | 112,750 | 0.44% |
[ 24.0% - 24.5% ] 24.24% | 56,696 | 1.3% |
[ 24.5% - 25.0% ] 24.90% | 9,162 | 4.9% |
[ 26.5% - 27.0% ] 26.59% | 4,407 | 3.2% |