Polish Married-couple Households
COMPARE
Polish
Select to Compare
Married-couple Households
Polish Married-couple Households
48.5%
MARRIED-COUPLE HOUSEHOLDS
99.2/ 100
METRIC RATING
57th/ 347
METRIC RANK
Polish Married-couple Households Correlation Chart
The statistical analysis conducted on geographies consisting of 559,940,539 people shows a mild positive correlation between the proportion of Poles and percentage of married-couple family households in the United States with a correlation coefficient (R) of 0.369 and weighted average of 48.5%. On average, for every 1% (one percent) increase in Poles within a typical geography, there is an increase of 0.28% in percentage of married-couple family households.
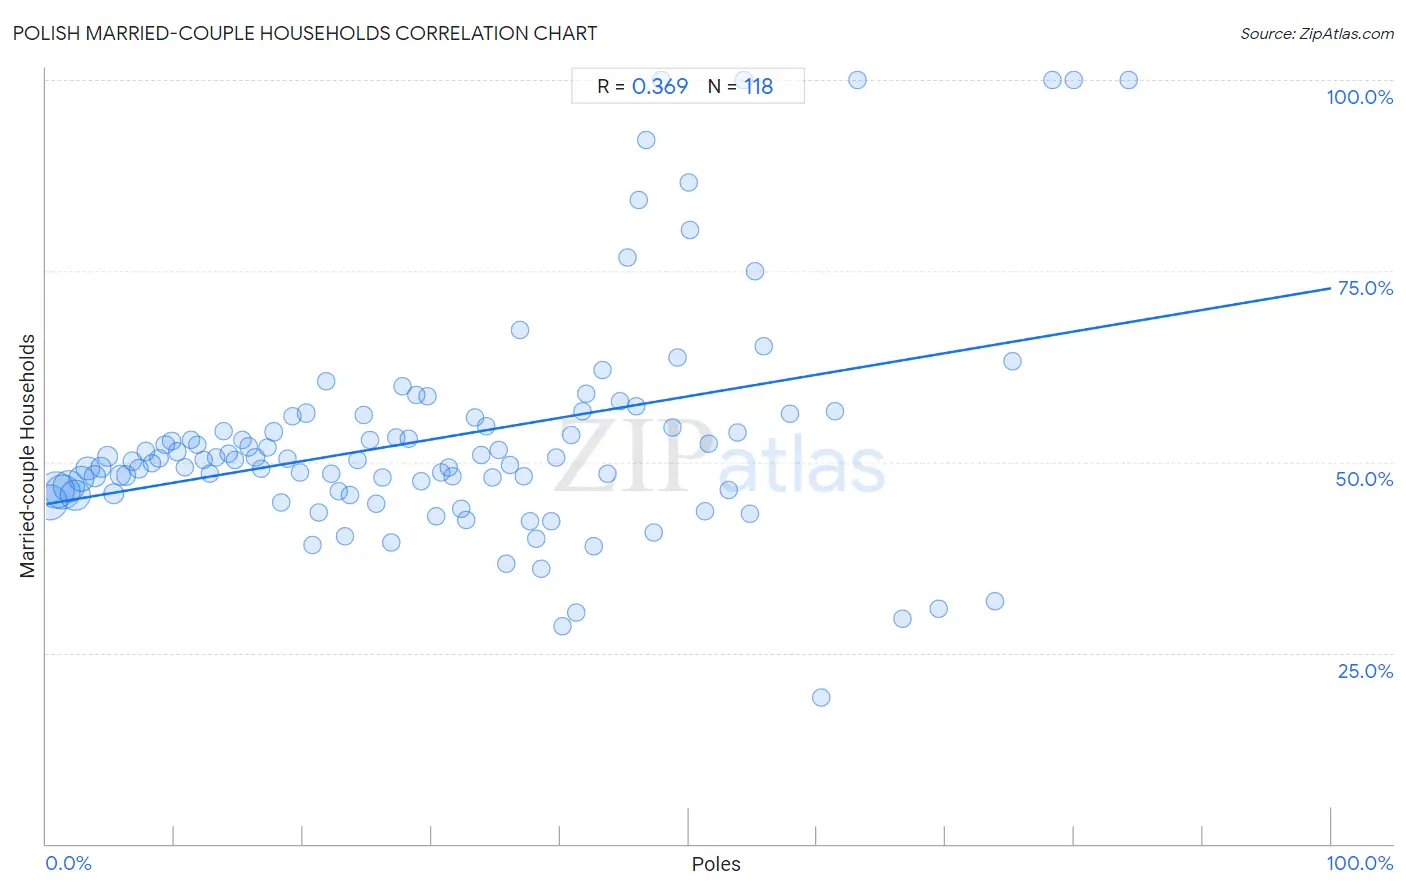
It is essential to understand that the correlation between the percentage of Poles and percentage of married-couple family households does not imply a direct cause-and-effect relationship. It remains uncertain whether the presence of Poles influences an upward or downward trend in the level of percentage of married-couple family households within an area, or if Poles simply ended up residing in those areas with higher or lower levels of percentage of married-couple family households due to other factors.
Demographics Similar to Poles by Married-couple Households
In terms of married-couple households, the demographic groups most similar to Poles are Immigrants from Indonesia (48.5%, a difference of 0.0%), Czechoslovakian (48.5%, a difference of 0.010%), Croatian (48.5%, a difference of 0.080%), Immigrants from Lithuania (48.6%, a difference of 0.090%), and Austrian (48.6%, a difference of 0.090%).
| Demographics | Rating | Rank | Married-couple Households |
| Samoans | 99.4 /100 | #50 | Exceptional 48.7% |
| Eastern Europeans | 99.3 /100 | #51 | Exceptional 48.6% |
| Irish | 99.3 /100 | #52 | Exceptional 48.6% |
| Whites/Caucasians | 99.3 /100 | #53 | Exceptional 48.6% |
| Immigrants from Lithuania | 99.3 /100 | #54 | Exceptional 48.6% |
| Austrians | 99.3 /100 | #55 | Exceptional 48.6% |
| Immigrants from Northern Europe | 99.3 /100 | #56 | Exceptional 48.6% |
| Poles | 99.2 /100 | #57 | Exceptional 48.5% |
| Immigrants from Indonesia | 99.2 /100 | #58 | Exceptional 48.5% |
| Czechoslovakians | 99.2 /100 | #59 | Exceptional 48.5% |
| Croatians | 99.1 /100 | #60 | Exceptional 48.5% |
| Bulgarians | 99.1 /100 | #61 | Exceptional 48.5% |
| Luxembourgers | 99.1 /100 | #62 | Exceptional 48.5% |
| Basques | 99.0 /100 | #63 | Exceptional 48.4% |
| Northern Europeans | 99.0 /100 | #64 | Exceptional 48.4% |
Polish Married-couple Households Correlation Summary
| Measurement | Polish Data | Married-couple Households Data |
| Minimum | 0.26% | 19.1% |
| Maximum | 84.3% | 100.0% |
| Range | 84.0% | 80.9% |
| Mean | 31.0% | 53.2% |
| Median | 29.4% | 50.3% |
| Interquartile 25% (IQ1) | 14.7% | 46.2% |
| Interquartile 75% (IQ3) | 44.6% | 56.0% |
| Interquartile Range (IQR) | 29.9% | 9.8% |
| Standard Deviation (Sample) | 19.8% | 15.2% |
| Standard Deviation (Population) | 19.8% | 15.1% |
Correlation Details
| Polish Percentile | Sample Size | Married-couple Households |
[ 0.0% - 0.5% ] 0.26% | 84,713,473 | 44.7% |
[ 0.5% - 1.0% ] 0.76% | 88,891,254 | 46.3% |
[ 1.0% - 1.5% ] 1.26% | 82,115,560 | 46.0% |
[ 1.5% - 2.0% ] 1.74% | 64,505,608 | 46.9% |
[ 2.0% - 2.5% ] 2.23% | 57,204,030 | 45.7% |
[ 2.5% - 3.0% ] 2.75% | 34,967,241 | 47.7% |
[ 3.0% - 3.5% ] 3.24% | 26,597,999 | 49.1% |
[ 3.5% - 4.0% ] 3.76% | 18,268,293 | 48.1% |
[ 4.0% - 4.5% ] 4.24% | 14,245,267 | 49.3% |
[ 4.5% - 5.0% ] 4.74% | 11,039,057 | 50.8% |
[ 5.0% - 5.5% ] 5.21% | 11,852,612 | 45.8% |
[ 5.5% - 6.0% ] 5.75% | 9,056,912 | 48.3% |
[ 6.0% - 6.5% ] 6.23% | 6,967,489 | 48.2% |
[ 6.5% - 7.0% ] 6.74% | 6,380,315 | 50.1% |
[ 7.0% - 7.5% ] 7.21% | 5,113,720 | 49.1% |
[ 7.5% - 8.0% ] 7.73% | 3,763,602 | 51.4% |
[ 8.0% - 8.5% ] 8.23% | 4,666,647 | 49.8% |
[ 8.5% - 9.0% ] 8.75% | 3,697,635 | 50.5% |
[ 9.0% - 9.5% ] 9.24% | 3,045,019 | 52.2% |
[ 9.5% - 10.0% ] 9.75% | 2,487,303 | 52.7% |
[ 10.0% - 10.5% ] 10.22% | 1,921,981 | 51.3% |
[ 10.5% - 11.0% ] 10.76% | 2,035,022 | 49.3% |
[ 11.0% - 11.5% ] 11.25% | 1,907,318 | 52.9% |
[ 11.5% - 12.0% ] 11.72% | 1,646,559 | 52.3% |
[ 12.0% - 12.5% ] 12.21% | 1,485,321 | 50.2% |
[ 12.5% - 13.0% ] 12.77% | 1,294,161 | 48.5% |
[ 13.0% - 13.5% ] 13.23% | 1,280,306 | 50.6% |
[ 13.5% - 14.0% ] 13.77% | 758,257 | 54.0% |
[ 14.0% - 14.5% ] 14.23% | 1,042,778 | 51.1% |
[ 14.5% - 15.0% ] 14.72% | 645,787 | 50.3% |
[ 15.0% - 15.5% ] 15.27% | 740,308 | 52.9% |
[ 15.5% - 16.0% ] 15.73% | 748,194 | 52.0% |
[ 16.0% - 16.5% ] 16.29% | 834,790 | 50.6% |
[ 16.5% - 17.0% ] 16.74% | 357,180 | 49.1% |
[ 17.0% - 17.5% ] 17.22% | 363,488 | 51.9% |
[ 17.5% - 18.0% ] 17.72% | 399,572 | 53.9% |
[ 18.0% - 18.5% ] 18.25% | 354,965 | 44.7% |
[ 18.5% - 19.0% ] 18.78% | 356,975 | 50.3% |
[ 19.0% - 19.5% ] 19.19% | 174,135 | 56.0% |
[ 19.5% - 20.0% ] 19.77% | 177,145 | 48.6% |
[ 20.0% - 20.5% ] 20.26% | 207,786 | 56.4% |
[ 20.5% - 21.0% ] 20.69% | 55,623 | 39.0% |
[ 21.0% - 21.5% ] 21.24% | 83,672 | 43.4% |
[ 21.5% - 22.0% ] 21.79% | 64,400 | 60.5% |
[ 22.0% - 22.5% ] 22.15% | 145,427 | 48.4% |
[ 22.5% - 23.0% ] 22.72% | 166,228 | 46.2% |
[ 23.0% - 23.5% ] 23.26% | 105,296 | 40.3% |
[ 23.5% - 24.0% ] 23.67% | 40,369 | 45.6% |
[ 24.0% - 24.5% ] 24.22% | 136,142 | 50.2% |
[ 24.5% - 25.0% ] 24.76% | 72,122 | 56.1% |
[ 25.0% - 25.5% ] 25.23% | 118,891 | 52.8% |
[ 25.5% - 26.0% ] 25.68% | 19,673 | 44.5% |
[ 26.0% - 26.5% ] 26.16% | 117,161 | 48.0% |
[ 26.5% - 27.0% ] 26.88% | 39,846 | 39.4% |
[ 27.0% - 27.5% ] 27.20% | 17,012 | 53.2% |
[ 27.5% - 28.0% ] 27.70% | 40,891 | 59.9% |
[ 28.0% - 28.5% ] 28.19% | 12,725 | 53.1% |
[ 28.5% - 29.0% ] 28.76% | 74,063 | 58.7% |
[ 29.0% - 29.5% ] 29.20% | 10,643 | 47.5% |
[ 29.5% - 30.0% ] 29.64% | 9,498 | 58.6% |
[ 30.0% - 30.5% ] 30.32% | 30,846 | 42.9% |
[ 30.5% - 31.0% ] 30.73% | 14,925 | 48.5% |
[ 31.0% - 31.5% ] 31.28% | 84,108 | 49.3% |
[ 31.5% - 32.0% ] 31.58% | 36,002 | 48.0% |
[ 32.0% - 32.5% ] 32.28% | 31,457 | 43.8% |
[ 32.5% - 33.0% ] 32.65% | 23,370 | 42.4% |
[ 33.0% - 33.5% ] 33.35% | 4,165 | 55.8% |
[ 33.5% - 34.0% ] 33.81% | 2,023 | 50.8% |
[ 34.0% - 34.5% ] 34.22% | 9,931 | 54.7% |
[ 34.5% - 35.0% ] 34.77% | 604 | 48.0% |
[ 35.0% - 35.5% ] 35.17% | 1,396 | 51.5% |
[ 35.5% - 36.0% ] 35.75% | 1,102 | 36.7% |
[ 36.0% - 36.5% ] 36.08% | 2,098 | 49.6% |
[ 36.5% - 37.0% ] 36.85% | 578 | 67.2% |
[ 37.0% - 37.5% ] 37.12% | 23,894 | 48.0% |
[ 37.5% - 38.0% ] 37.62% | 2,294 | 42.3% |
[ 38.0% - 38.5% ] 38.10% | 63 | 40.0% |
[ 38.5% - 39.0% ] 38.55% | 1,603 | 36.0% |
[ 39.0% - 39.5% ] 39.34% | 943 | 42.2% |
[ 39.5% - 40.0% ] 39.65% | 2,507 | 50.5% |
[ 40.0% - 40.5% ] 40.16% | 1,016 | 28.5% |
[ 40.5% - 41.0% ] 40.86% | 1,263 | 53.5% |
[ 41.0% - 41.5% ] 41.21% | 182 | 30.3% |
[ 41.5% - 42.0% ] 41.78% | 529 | 56.7% |
[ 42.0% - 42.5% ] 42.07% | 3,076 | 58.9% |
[ 42.5% - 43.0% ] 42.59% | 108 | 38.9% |
[ 43.0% - 43.5% ] 43.31% | 1,494 | 62.0% |
[ 43.5% - 44.0% ] 43.67% | 245 | 48.4% |
[ 44.5% - 45.0% ] 44.62% | 1,739 | 57.9% |
[ 45.0% - 45.5% ] 45.24% | 336 | 76.7% |
[ 45.5% - 46.0% ] 45.90% | 2,549 | 57.3% |
[ 46.0% - 46.5% ] 46.15% | 91 | 84.2% |
[ 46.5% - 47.0% ] 46.70% | 379 | 92.2% |
[ 47.0% - 47.5% ] 47.24% | 3,497 | 40.7% |
[ 47.5% - 48.0% ] 47.83% | 23 | 100.0% |
[ 48.5% - 49.0% ] 48.78% | 41 | 54.5% |
[ 49.0% - 49.5% ] 49.10% | 2,067 | 63.7% |
[ 50.0% - 50.5% ] 50.00% | 220 | 86.5% |
[ 50.0% - 50.5% ] 50.14% | 2,140 | 80.3% |
[ 51.0% - 51.5% ] 51.31% | 1,183 | 43.5% |
[ 51.5% - 52.0% ] 51.59% | 283 | 52.4% |
[ 53.0% - 53.5% ] 53.08% | 130 | 46.4% |
[ 53.5% - 54.0% ] 53.81% | 433 | 53.8% |
[ 54.0% - 54.5% ] 54.29% | 35 | 100.0% |
[ 54.5% - 55.0% ] 54.81% | 135 | 43.2% |
[ 55.0% - 55.5% ] 55.19% | 183 | 75.0% |
[ 55.5% - 56.0% ] 55.81% | 568 | 65.1% |
[ 57.5% - 58.0% ] 57.88% | 387 | 56.2% |
[ 60.0% - 60.5% ] 60.31% | 446 | 19.1% |
[ 61.0% - 61.5% ] 61.42% | 324 | 56.7% |
[ 63.0% - 63.5% ] 63.10% | 84 | 100.0% |
[ 66.5% - 67.0% ] 66.67% | 36 | 29.4% |
[ 69.0% - 69.5% ] 69.48% | 154 | 30.8% |
[ 73.5% - 74.0% ] 73.81% | 84 | 31.8% |
[ 75.0% - 75.5% ] 75.22% | 226 | 63.1% |
[ 78.0% - 78.5% ] 78.26% | 46 | 100.0% |
[ 80.0% - 80.5% ] 80.00% | 25 | 100.0% |
[ 84.0% - 84.5% ] 84.25% | 127 | 100.0% |