Polish Receiving Food Stamps
COMPARE
Polish
Select to Compare
Receiving Food Stamps
Polish Receiving Food Stamps
10.0%
PUBLIC INCOME | FOOD STAMPS
98.6/ 100
METRIC RATING
80th/ 347
METRIC RANK
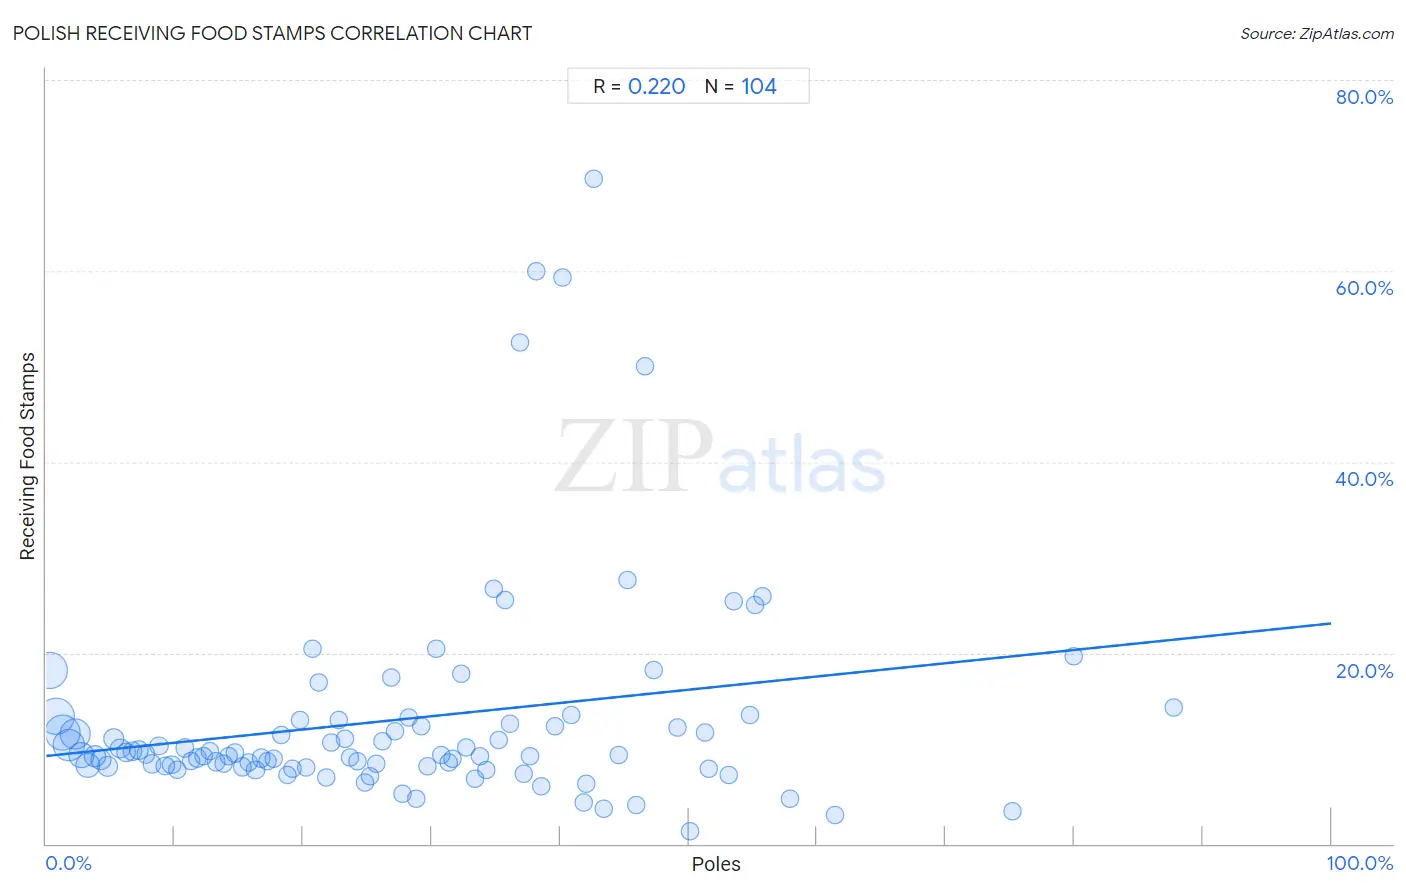
Polish Receiving Food Stamps Correlation Chart
The statistical analysis conducted on geographies consisting of 556,985,146 people shows a weak positive correlation between the proportion of Poles and percentage of population receiving government assistance and/or food stamps in the United States with a correlation coefficient (R) of 0.220 and weighted average of 10.0%. On average, for every 1% (one percent) increase in Poles within a typical geography, there is an increase of 0.14% in percentage of population receiving government assistance and/or food stamps.
It is essential to understand that the correlation between the percentage of Poles and percentage of population receiving government assistance and/or food stamps does not imply a direct cause-and-effect relationship. It remains uncertain whether the presence of Poles influences an upward or downward trend in the level of percentage of population receiving government assistance and/or food stamps within an area, or if Poles simply ended up residing in those areas with higher or lower levels of percentage of population receiving government assistance and/or food stamps due to other factors.
Demographics Similar to Poles by Receiving Food Stamps
In terms of receiving food stamps, the demographic groups most similar to Poles are Laotian (10.0%, a difference of 0.080%), South African (10.0%, a difference of 0.12%), Immigrants from England (10.0%, a difference of 0.14%), Immigrants from North Macedonia (10.0%, a difference of 0.16%), and Immigrants from Croatia (10.0%, a difference of 0.25%).
| Demographics | Rating | Rank | Receiving Food Stamps |
| Macedonians | 98.9 /100 | #73 | Exceptional 9.9% |
| New Zealanders | 98.8 /100 | #74 | Exceptional 9.9% |
| Immigrants from Zimbabwe | 98.7 /100 | #75 | Exceptional 9.9% |
| Immigrants from Croatia | 98.7 /100 | #76 | Exceptional 10.0% |
| Immigrants from North Macedonia | 98.7 /100 | #77 | Exceptional 10.0% |
| South Africans | 98.7 /100 | #78 | Exceptional 10.0% |
| Laotians | 98.7 /100 | #79 | Exceptional 10.0% |
| Poles | 98.6 /100 | #80 | Exceptional 10.0% |
| Immigrants from England | 98.6 /100 | #81 | Exceptional 10.0% |
| Austrians | 98.6 /100 | #82 | Exceptional 10.0% |
| Dutch | 98.6 /100 | #83 | Exceptional 10.0% |
| Immigrants from Israel | 98.5 /100 | #84 | Exceptional 10.0% |
| Immigrants from Romania | 98.5 /100 | #85 | Exceptional 10.0% |
| Immigrants from Norway | 98.4 /100 | #86 | Exceptional 10.0% |
| Egyptians | 98.4 /100 | #87 | Exceptional 10.0% |
Polish Receiving Food Stamps Correlation Summary
| Measurement | Polish Data | Receiving Food Stamps Data |
| Minimum | 0.26% | 1.3% |
| Maximum | 87.8% | 69.7% |
| Range | 87.5% | 68.4% |
| Mean | 27.7% | 13.0% |
| Median | 25.9% | 9.3% |
| Interquartile 25% (IQ1) | 13.0% | 8.1% |
| Interquartile 75% (IQ3) | 39.1% | 12.7% |
| Interquartile Range (IQR) | 26.1% | 4.6% |
| Standard Deviation (Sample) | 18.3% | 11.6% |
| Standard Deviation (Population) | 18.2% | 11.5% |
Correlation Details
| Polish Percentile | Sample Size | Receiving Food Stamps |
[ 0.0% - 0.5% ] 0.26% | 84,620,241 | 18.2% |
[ 0.5% - 1.0% ] 0.76% | 88,669,520 | 13.3% |
[ 1.0% - 1.5% ] 1.26% | 81,881,375 | 11.7% |
[ 1.5% - 2.0% ] 1.74% | 64,223,570 | 10.3% |
[ 2.0% - 2.5% ] 2.23% | 56,998,510 | 11.5% |
[ 2.5% - 3.0% ] 2.75% | 34,738,152 | 9.3% |
[ 3.0% - 3.5% ] 3.24% | 26,374,715 | 8.2% |
[ 3.5% - 4.0% ] 3.76% | 18,079,813 | 9.2% |
[ 4.0% - 4.5% ] 4.24% | 14,052,113 | 8.8% |
[ 4.5% - 5.0% ] 4.74% | 10,858,352 | 8.1% |
[ 5.0% - 5.5% ] 5.21% | 11,755,722 | 10.9% |
[ 5.5% - 6.0% ] 5.75% | 8,915,122 | 10.0% |
[ 6.0% - 6.5% ] 6.23% | 6,880,659 | 9.5% |
[ 6.5% - 7.0% ] 6.74% | 6,311,423 | 9.7% |
[ 7.0% - 7.5% ] 7.21% | 5,056,224 | 9.9% |
[ 7.5% - 8.0% ] 7.74% | 3,698,792 | 9.4% |
[ 8.0% - 8.5% ] 8.23% | 4,622,989 | 8.4% |
[ 8.5% - 9.0% ] 8.75% | 3,631,548 | 10.3% |
[ 9.0% - 9.5% ] 9.24% | 3,035,661 | 8.2% |
[ 9.5% - 10.0% ] 9.75% | 2,456,477 | 8.3% |
[ 10.0% - 10.5% ] 10.22% | 1,893,682 | 7.8% |
[ 10.5% - 11.0% ] 10.76% | 2,012,707 | 10.1% |
[ 11.0% - 11.5% ] 11.25% | 1,891,121 | 8.7% |
[ 11.5% - 12.0% ] 11.72% | 1,624,172 | 9.0% |
[ 12.0% - 12.5% ] 12.21% | 1,470,068 | 9.2% |
[ 12.5% - 13.0% ] 12.77% | 1,277,492 | 9.7% |
[ 13.0% - 13.5% ] 13.23% | 1,272,966 | 8.6% |
[ 13.5% - 14.0% ] 13.77% | 753,556 | 8.4% |
[ 14.0% - 14.5% ] 14.23% | 1,032,999 | 9.1% |
[ 14.5% - 15.0% ] 14.72% | 640,076 | 9.5% |
[ 15.0% - 15.5% ] 15.27% | 732,182 | 8.1% |
[ 15.5% - 16.0% ] 15.73% | 735,567 | 8.5% |
[ 16.0% - 16.5% ] 16.29% | 827,185 | 7.7% |
[ 16.5% - 17.0% ] 16.74% | 355,129 | 9.0% |
[ 17.0% - 17.5% ] 17.22% | 360,701 | 8.7% |
[ 17.5% - 18.0% ] 17.72% | 396,856 | 8.9% |
[ 18.0% - 18.5% ] 18.25% | 348,461 | 11.3% |
[ 18.5% - 19.0% ] 18.78% | 352,492 | 7.2% |
[ 19.0% - 19.5% ] 19.19% | 171,615 | 7.9% |
[ 19.5% - 20.0% ] 19.76% | 173,095 | 12.9% |
[ 20.0% - 20.5% ] 20.26% | 203,393 | 8.0% |
[ 20.5% - 21.0% ] 20.69% | 53,976 | 20.5% |
[ 21.0% - 21.5% ] 21.23% | 83,358 | 16.9% |
[ 21.5% - 22.0% ] 21.80% | 60,805 | 6.9% |
[ 22.0% - 22.5% ] 22.15% | 142,774 | 10.7% |
[ 22.5% - 23.0% ] 22.72% | 165,469 | 13.0% |
[ 23.0% - 23.5% ] 23.26% | 104,885 | 11.0% |
[ 23.5% - 24.0% ] 23.66% | 38,208 | 9.0% |
[ 24.0% - 24.5% ] 24.22% | 135,817 | 8.6% |
[ 24.5% - 25.0% ] 24.76% | 72,081 | 6.5% |
[ 25.0% - 25.5% ] 25.23% | 117,332 | 7.0% |
[ 25.5% - 26.0% ] 25.68% | 18,444 | 8.4% |
[ 26.0% - 26.5% ] 26.16% | 117,138 | 10.7% |
[ 26.5% - 27.0% ] 26.88% | 39,671 | 17.4% |
[ 27.0% - 27.5% ] 27.16% | 14,449 | 11.8% |
[ 27.5% - 28.0% ] 27.70% | 40,549 | 5.2% |
[ 28.0% - 28.5% ] 28.19% | 12,584 | 13.2% |
[ 28.5% - 29.0% ] 28.76% | 73,260 | 4.7% |
[ 29.0% - 29.5% ] 29.20% | 10,643 | 12.4% |
[ 29.5% - 30.0% ] 29.64% | 8,573 | 8.1% |
[ 30.0% - 30.5% ] 30.32% | 30,325 | 20.5% |
[ 30.5% - 31.0% ] 30.74% | 14,690 | 9.3% |
[ 31.0% - 31.5% ] 31.28% | 83,607 | 8.5% |
[ 31.5% - 32.0% ] 31.58% | 35,657 | 8.9% |
[ 32.0% - 32.5% ] 32.28% | 31,420 | 17.8% |
[ 32.5% - 33.0% ] 32.65% | 22,934 | 10.1% |
[ 33.0% - 33.5% ] 33.36% | 3,903 | 6.9% |
[ 33.5% - 34.0% ] 33.80% | 2,083 | 9.1% |
[ 34.0% - 34.5% ] 34.21% | 9,235 | 7.7% |
[ 34.5% - 35.0% ] 34.80% | 523 | 26.7% |
[ 35.0% - 35.5% ] 35.17% | 1,396 | 10.9% |
[ 35.5% - 36.0% ] 35.74% | 985 | 25.5% |
[ 36.0% - 36.5% ] 36.07% | 1,952 | 12.5% |
[ 36.5% - 37.0% ] 36.90% | 458 | 52.5% |
[ 37.0% - 37.5% ] 37.12% | 23,676 | 7.3% |
[ 37.5% - 38.0% ] 37.61% | 2,034 | 9.2% |
[ 38.0% - 38.5% ] 38.10% | 63 | 60.0% |
[ 38.5% - 39.0% ] 38.55% | 1,603 | 6.0% |
[ 39.5% - 40.0% ] 39.61% | 1,482 | 12.3% |
[ 40.0% - 40.5% ] 40.22% | 552 | 59.3% |
[ 40.5% - 41.0% ] 40.86% | 1,182 | 13.5% |
[ 41.5% - 42.0% ] 41.84% | 380 | 4.3% |
[ 42.0% - 42.5% ] 42.07% | 3,007 | 6.3% |
[ 42.5% - 43.0% ] 42.58% | 310 | 69.7% |
[ 43.0% - 43.5% ] 43.36% | 1,137 | 3.7% |
[ 44.5% - 45.0% ] 44.54% | 339 | 9.3% |
[ 45.0% - 45.5% ] 45.24% | 336 | 27.7% |
[ 45.5% - 46.0% ] 45.90% | 2,525 | 4.0% |
[ 46.5% - 47.0% ] 46.61% | 118 | 50.0% |
[ 47.0% - 47.5% ] 47.25% | 3,412 | 18.2% |
[ 49.0% - 49.5% ] 49.10% | 1,719 | 12.2% |
[ 50.0% - 50.5% ] 50.14% | 2,140 | 1.3% |
[ 51.0% - 51.5% ] 51.31% | 1,183 | 11.7% |
[ 51.5% - 52.0% ] 51.56% | 256 | 7.9% |
[ 53.0% - 53.5% ] 53.08% | 130 | 7.2% |
[ 53.5% - 54.0% ] 53.52% | 71 | 25.4% |
[ 54.5% - 55.0% ] 54.81% | 135 | 13.5% |
[ 55.0% - 55.5% ] 55.19% | 183 | 25.0% |
[ 55.5% - 56.0% ] 55.79% | 242 | 25.9% |
[ 57.5% - 58.0% ] 57.88% | 387 | 4.7% |
[ 61.0% - 61.5% ] 61.42% | 324 | 3.0% |
[ 75.0% - 75.5% ] 75.22% | 226 | 3.4% |
[ 80.0% - 80.5% ] 80.00% | 80 | 19.7% |
[ 87.5% - 88.0% ] 87.76% | 237 | 14.3% |