Polish GED/Equivalency
COMPARE
Polish
Select to Compare
GED/Equivalency
Polish GED/Equivalency
88.5%
GED/EQUIVALENCY
99.8/ 100
METRIC RATING
29th/ 347
METRIC RANK
Polish GED/Equivalency Correlation Chart
The statistical analysis conducted on geographies consisting of 560,593,858 people shows a weak positive correlation between the proportion of Poles and percentage of population with at least ged/equivalency education in the United States with a correlation coefficient (R) of 0.299 and weighted average of 88.5%. On average, for every 1% (one percent) increase in Poles within a typical geography, there is an increase of 0.081% in percentage of population with at least ged/equivalency education.
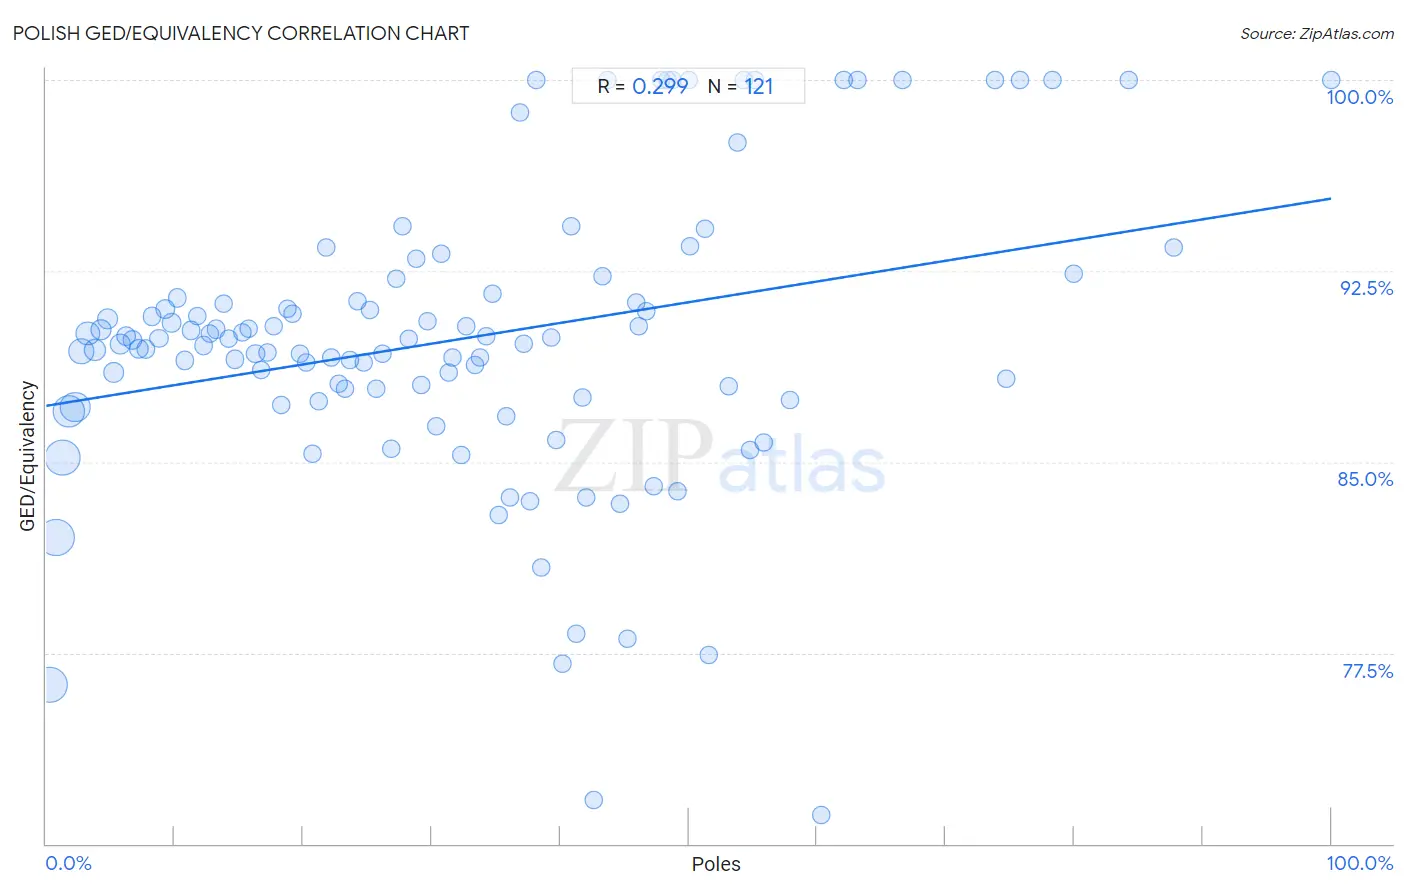
It is essential to understand that the correlation between the percentage of Poles and percentage of population with at least ged/equivalency education does not imply a direct cause-and-effect relationship. It remains uncertain whether the presence of Poles influences an upward or downward trend in the level of percentage of population with at least ged/equivalency education within an area, or if Poles simply ended up residing in those areas with higher or lower levels of percentage of population with at least ged/equivalency education due to other factors.
Demographics Similar to Poles by GED/Equivalency
In terms of ged/equivalency, the demographic groups most similar to Poles are Turkish (88.5%, a difference of 0.020%), Immigrants from Northern Europe (88.5%, a difference of 0.030%), Bhutanese (88.4%, a difference of 0.050%), Immigrants from Lithuania (88.6%, a difference of 0.070%), and Danish (88.4%, a difference of 0.070%).
| Demographics | Rating | Rank | GED/Equivalency |
| Immigrants from Ireland | 99.8 /100 | #22 | Exceptional 88.6% |
| Russians | 99.8 /100 | #23 | Exceptional 88.6% |
| Slovaks | 99.8 /100 | #24 | Exceptional 88.6% |
| Estonians | 99.8 /100 | #25 | Exceptional 88.6% |
| Immigrants from Australia | 99.8 /100 | #26 | Exceptional 88.6% |
| Immigrants from Lithuania | 99.8 /100 | #27 | Exceptional 88.6% |
| Immigrants from Northern Europe | 99.8 /100 | #28 | Exceptional 88.5% |
| Poles | 99.8 /100 | #29 | Exceptional 88.5% |
| Turks | 99.8 /100 | #30 | Exceptional 88.5% |
| Bhutanese | 99.8 /100 | #31 | Exceptional 88.4% |
| Danes | 99.8 /100 | #32 | Exceptional 88.4% |
| Immigrants from Sweden | 99.7 /100 | #33 | Exceptional 88.4% |
| Immigrants from Japan | 99.7 /100 | #34 | Exceptional 88.4% |
| Immigrants from South Central Asia | 99.7 /100 | #35 | Exceptional 88.4% |
| Immigrants from Belgium | 99.7 /100 | #36 | Exceptional 88.3% |
Polish GED/Equivalency Correlation Summary
| Measurement | Polish Data | GED/Equivalency Data |
| Minimum | 0.26% | 71.1% |
| Maximum | 100.0% | 100.0% |
| Range | 99.7% | 28.9% |
| Mean | 32.2% | 89.8% |
| Median | 30.3% | 89.8% |
| Interquartile 25% (IQ1) | 15.0% | 87.5% |
| Interquartile 75% (IQ3) | 46.0% | 91.5% |
| Interquartile Range (IQR) | 31.0% | 4.1% |
| Standard Deviation (Sample) | 21.3% | 5.8% |
| Standard Deviation (Population) | 21.3% | 5.8% |
Correlation Details
| Polish Percentile | Sample Size | GED/Equivalency |
[ 0.0% - 0.5% ] 0.26% | 84,782,135 | 76.3% |
[ 0.5% - 1.0% ] 0.76% | 88,968,930 | 82.0% |
[ 1.0% - 1.5% ] 1.26% | 82,192,281 | 85.2% |
[ 1.5% - 2.0% ] 1.74% | 64,587,321 | 87.0% |
[ 2.0% - 2.5% ] 2.23% | 57,280,257 | 87.2% |
[ 2.5% - 3.0% ] 2.75% | 35,008,610 | 89.3% |
[ 3.0% - 3.5% ] 3.24% | 26,625,744 | 90.0% |
[ 3.5% - 4.0% ] 3.76% | 18,315,997 | 89.4% |
[ 4.0% - 4.5% ] 4.24% | 14,258,648 | 90.2% |
[ 4.5% - 5.0% ] 4.74% | 11,076,119 | 90.6% |
[ 5.0% - 5.5% ] 5.21% | 11,862,906 | 88.5% |
[ 5.5% - 6.0% ] 5.75% | 9,062,764 | 89.6% |
[ 6.0% - 6.5% ] 6.23% | 7,001,698 | 90.0% |
[ 6.5% - 7.0% ] 6.74% | 6,394,855 | 89.8% |
[ 7.0% - 7.5% ] 7.21% | 5,126,035 | 89.4% |
[ 7.5% - 8.0% ] 7.74% | 3,772,957 | 89.4% |
[ 8.0% - 8.5% ] 8.23% | 4,671,567 | 90.7% |
[ 8.5% - 9.0% ] 8.75% | 3,700,354 | 89.9% |
[ 9.0% - 9.5% ] 9.24% | 3,045,911 | 91.0% |
[ 9.5% - 10.0% ] 9.75% | 2,490,445 | 90.5% |
[ 10.0% - 10.5% ] 10.22% | 1,922,129 | 91.4% |
[ 10.5% - 11.0% ] 10.76% | 2,037,510 | 89.0% |
[ 11.0% - 11.5% ] 11.25% | 1,907,513 | 90.2% |
[ 11.5% - 12.0% ] 11.72% | 1,648,048 | 90.7% |
[ 12.0% - 12.5% ] 12.21% | 1,485,321 | 89.6% |
[ 12.5% - 13.0% ] 12.77% | 1,294,161 | 90.0% |
[ 13.0% - 13.5% ] 13.23% | 1,280,306 | 90.2% |
[ 13.5% - 14.0% ] 13.77% | 758,336 | 91.2% |
[ 14.0% - 14.5% ] 14.23% | 1,042,778 | 89.8% |
[ 14.5% - 15.0% ] 14.72% | 645,868 | 89.0% |
[ 15.0% - 15.5% ] 15.27% | 740,308 | 90.1% |
[ 15.5% - 16.0% ] 15.73% | 748,283 | 90.2% |
[ 16.0% - 16.5% ] 16.29% | 834,790 | 89.3% |
[ 16.5% - 17.0% ] 16.74% | 357,360 | 88.6% |
[ 17.0% - 17.5% ] 17.22% | 363,511 | 89.3% |
[ 17.5% - 18.0% ] 17.72% | 399,896 | 90.3% |
[ 18.0% - 18.5% ] 18.25% | 354,965 | 87.2% |
[ 18.5% - 19.0% ] 18.78% | 356,975 | 91.0% |
[ 19.0% - 19.5% ] 19.19% | 174,156 | 90.8% |
[ 19.5% - 20.0% ] 19.77% | 177,145 | 89.3% |
[ 20.0% - 20.5% ] 20.26% | 207,786 | 88.9% |
[ 20.5% - 21.0% ] 20.69% | 55,700 | 85.3% |
[ 21.0% - 21.5% ] 21.24% | 83,672 | 87.4% |
[ 21.5% - 22.0% ] 21.79% | 64,400 | 93.4% |
[ 22.0% - 22.5% ] 22.15% | 145,427 | 89.1% |
[ 22.5% - 23.0% ] 22.72% | 166,228 | 88.1% |
[ 23.0% - 23.5% ] 23.26% | 105,296 | 87.9% |
[ 23.5% - 24.0% ] 23.67% | 40,369 | 89.0% |
[ 24.0% - 24.5% ] 24.22% | 136,179 | 91.3% |
[ 24.5% - 25.0% ] 24.76% | 72,146 | 88.9% |
[ 25.0% - 25.5% ] 25.23% | 118,891 | 91.0% |
[ 25.5% - 26.0% ] 25.68% | 19,673 | 87.9% |
[ 26.0% - 26.5% ] 26.16% | 117,161 | 89.3% |
[ 26.5% - 27.0% ] 26.88% | 39,861 | 85.5% |
[ 27.0% - 27.5% ] 27.20% | 17,012 | 92.2% |
[ 27.5% - 28.0% ] 27.70% | 40,891 | 94.3% |
[ 28.0% - 28.5% ] 28.19% | 12,725 | 89.8% |
[ 28.5% - 29.0% ] 28.76% | 74,063 | 93.0% |
[ 29.0% - 29.5% ] 29.20% | 10,643 | 88.0% |
[ 29.5% - 30.0% ] 29.64% | 9,498 | 90.5% |
[ 30.0% - 30.5% ] 30.32% | 31,030 | 86.4% |
[ 30.5% - 31.0% ] 30.73% | 15,000 | 93.2% |
[ 31.0% - 31.5% ] 31.28% | 84,108 | 88.5% |
[ 31.5% - 32.0% ] 31.58% | 36,002 | 89.1% |
[ 32.0% - 32.5% ] 32.28% | 31,457 | 85.3% |
[ 32.5% - 33.0% ] 32.65% | 23,370 | 90.3% |
[ 33.0% - 33.5% ] 33.35% | 4,183 | 88.8% |
[ 33.5% - 34.0% ] 33.80% | 2,139 | 89.1% |
[ 34.0% - 34.5% ] 34.22% | 9,931 | 89.9% |
[ 34.5% - 35.0% ] 34.77% | 604 | 91.6% |
[ 35.0% - 35.5% ] 35.17% | 1,396 | 82.9% |
[ 35.5% - 36.0% ] 35.75% | 1,102 | 86.8% |
[ 36.0% - 36.5% ] 36.08% | 2,098 | 83.6% |
[ 36.5% - 37.0% ] 36.84% | 608 | 98.7% |
[ 37.0% - 37.5% ] 37.12% | 23,894 | 89.6% |
[ 37.5% - 38.0% ] 37.62% | 2,294 | 83.5% |
[ 38.0% - 38.5% ] 38.10% | 63 | 100.0% |
[ 38.5% - 39.0% ] 38.55% | 1,603 | 80.8% |
[ 39.0% - 39.5% ] 39.34% | 943 | 89.9% |
[ 39.5% - 40.0% ] 39.65% | 2,507 | 85.9% |
[ 40.0% - 40.5% ] 40.16% | 1,016 | 77.1% |
[ 40.5% - 41.0% ] 40.86% | 1,263 | 94.2% |
[ 41.0% - 41.5% ] 41.21% | 182 | 78.3% |
[ 41.5% - 42.0% ] 41.78% | 529 | 87.5% |
[ 42.0% - 42.5% ] 42.07% | 3,076 | 83.6% |
[ 42.5% - 43.0% ] 42.58% | 310 | 71.7% |
[ 43.0% - 43.5% ] 43.31% | 1,494 | 92.3% |
[ 43.5% - 44.0% ] 43.67% | 245 | 100.0% |
[ 44.5% - 45.0% ] 44.62% | 1,739 | 83.4% |
[ 45.0% - 45.5% ] 45.24% | 336 | 78.1% |
[ 45.5% - 46.0% ] 45.90% | 2,549 | 91.3% |
[ 46.0% - 46.5% ] 46.15% | 91 | 90.3% |
[ 46.5% - 47.0% ] 46.74% | 460 | 90.9% |
[ 47.0% - 47.5% ] 47.24% | 3,497 | 84.0% |
[ 47.5% - 48.0% ] 47.83% | 23 | 100.0% |
[ 48.0% - 48.5% ] 48.39% | 31 | 100.0% |
[ 48.5% - 49.0% ] 48.78% | 41 | 100.0% |
[ 49.0% - 49.5% ] 49.10% | 2,067 | 83.8% |
[ 50.0% - 50.5% ] 50.00% | 374 | 100.0% |
[ 50.0% - 50.5% ] 50.14% | 2,140 | 93.5% |
[ 51.0% - 51.5% ] 51.31% | 1,183 | 94.2% |
[ 51.5% - 52.0% ] 51.59% | 283 | 77.4% |
[ 53.0% - 53.5% ] 53.08% | 130 | 88.0% |
[ 53.5% - 54.0% ] 53.81% | 433 | 97.6% |
[ 54.0% - 54.5% ] 54.29% | 35 | 100.0% |
[ 54.5% - 55.0% ] 54.74% | 190 | 85.5% |
[ 55.0% - 55.5% ] 55.19% | 183 | 100.0% |
[ 55.5% - 56.0% ] 55.81% | 568 | 85.8% |
[ 57.5% - 58.0% ] 57.88% | 387 | 87.4% |
[ 60.0% - 60.5% ] 60.31% | 446 | 71.1% |
[ 62.0% - 62.5% ] 62.07% | 29 | 100.0% |
[ 63.0% - 63.5% ] 63.10% | 84 | 100.0% |
[ 66.5% - 67.0% ] 66.67% | 36 | 100.0% |
[ 73.5% - 74.0% ] 73.81% | 84 | 100.0% |
[ 74.5% - 75.0% ] 74.69% | 573 | 88.3% |
[ 75.5% - 76.0% ] 75.75% | 268 | 100.0% |
[ 78.0% - 78.5% ] 78.26% | 46 | 100.0% |
[ 80.0% - 80.5% ] 80.00% | 105 | 92.4% |
[ 84.0% - 84.5% ] 84.24% | 184 | 100.0% |
[ 87.5% - 88.0% ] 87.76% | 237 | 93.4% |
[ 99.5% - 100.0% ] 100.00% | 65 | 100.0% |