Polish Unemployment Among Women with Children Ages 6 to 17 years
COMPARE
Polish
Select to Compare
Unemployment Among Women with Children Ages 6 to 17 years
Polish Unemployment Among Women with Children Ages 6 to 17 years
9.4%
UNEMPLOYMENT | WOMEN W/ CHILDREN 6 TO 17
1.5/ 100
METRIC RATING
247th/ 347
METRIC RANK
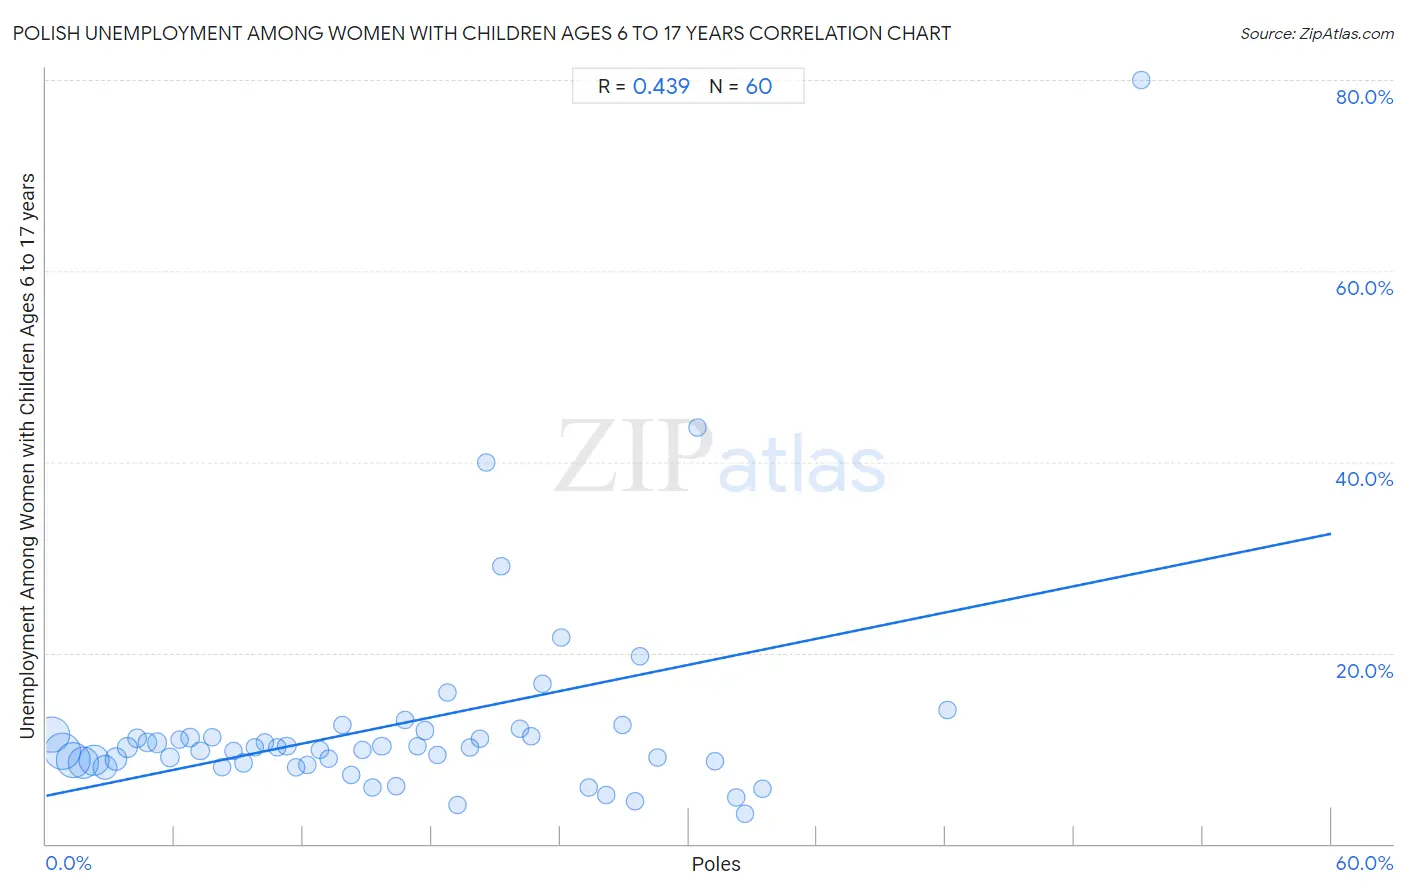
Polish Unemployment Among Women with Children Ages 6 to 17 years Correlation Chart
The statistical analysis conducted on geographies consisting of 352,978,208 people shows a moderate positive correlation between the proportion of Poles and unemployment rate among women with children between the ages 6 and 17 in the United States with a correlation coefficient (R) of 0.439 and weighted average of 9.4%. On average, for every 1% (one percent) increase in Poles within a typical geography, there is an increase of 0.46% in unemployment rate among women with children between the ages 6 and 17.
It is essential to understand that the correlation between the percentage of Poles and unemployment rate among women with children between the ages 6 and 17 does not imply a direct cause-and-effect relationship. It remains uncertain whether the presence of Poles influences an upward or downward trend in the level of unemployment rate among women with children between the ages 6 and 17 within an area, or if Poles simply ended up residing in those areas with higher or lower levels of unemployment rate among women with children between the ages 6 and 17 due to other factors.
Demographics Similar to Poles by Unemployment Among Women with Children Ages 6 to 17 years
In terms of unemployment among women with children ages 6 to 17 years, the demographic groups most similar to Poles are Immigrants from Africa (9.4%, a difference of 0.030%), Dutch (9.4%, a difference of 0.040%), Immigrants from South America (9.4%, a difference of 0.050%), Immigrants from Guatemala (9.4%, a difference of 0.14%), and Central American (9.4%, a difference of 0.15%).
| Demographics | Rating | Rank | Unemployment Among Women with Children Ages 6 to 17 years |
| Guatemalans | 2.3 /100 | #240 | Tragic 9.3% |
| Colombians | 2.2 /100 | #241 | Tragic 9.3% |
| Immigrants from Colombia | 2.1 /100 | #242 | Tragic 9.3% |
| Scottish | 2.0 /100 | #243 | Tragic 9.4% |
| English | 1.9 /100 | #244 | Tragic 9.4% |
| Immigrants from Cameroon | 1.8 /100 | #245 | Tragic 9.4% |
| Immigrants from Africa | 1.6 /100 | #246 | Tragic 9.4% |
| Poles | 1.5 /100 | #247 | Tragic 9.4% |
| Dutch | 1.5 /100 | #248 | Tragic 9.4% |
| Immigrants from South America | 1.5 /100 | #249 | Tragic 9.4% |
| Immigrants from Guatemala | 1.3 /100 | #250 | Tragic 9.4% |
| Central Americans | 1.3 /100 | #251 | Tragic 9.4% |
| Creek | 1.2 /100 | #252 | Tragic 9.4% |
| Portuguese | 1.1 /100 | #253 | Tragic 9.4% |
| Nicaraguans | 1.0 /100 | #254 | Tragic 9.4% |
Polish Unemployment Among Women with Children Ages 6 to 17 years Correlation Summary
| Measurement | Polish Data | Unemployment Among Women with Children Ages 6 to 17 years Data |
| Minimum | 0.26% | 3.2% |
| Maximum | 51.1% | 80.0% |
| Range | 50.8% | 76.8% |
| Mean | 16.1% | 12.4% |
| Median | 15.0% | 10.1% |
| Interquartile 25% (IQ1) | 7.5% | 8.5% |
| Interquartile 75% (IQ3) | 22.9% | 11.4% |
| Interquartile Range (IQR) | 15.4% | 2.9% |
| Standard Deviation (Sample) | 10.9% | 11.3% |
| Standard Deviation (Population) | 10.8% | 11.2% |
Correlation Details
| Polish Percentile | Sample Size | Unemployment Among Women with Children Ages 6 to 17 years |
[ 0.0% - 0.5% ] 0.26% | 59,621,104 | 11.4% |
[ 0.5% - 1.0% ] 0.76% | 61,453,793 | 9.6% |
[ 1.0% - 1.5% ] 1.26% | 56,526,291 | 8.8% |
[ 1.5% - 2.0% ] 1.74% | 43,476,366 | 8.5% |
[ 2.0% - 2.5% ] 2.22% | 39,289,662 | 8.7% |
[ 2.5% - 3.0% ] 2.76% | 20,982,248 | 8.0% |
[ 3.0% - 3.5% ] 3.24% | 14,243,115 | 8.9% |
[ 3.5% - 4.0% ] 3.77% | 8,574,432 | 10.1% |
[ 4.0% - 4.5% ] 4.24% | 6,901,990 | 11.0% |
[ 4.5% - 5.0% ] 4.74% | 4,765,153 | 10.7% |
[ 5.0% - 5.5% ] 5.18% | 6,648,436 | 10.6% |
[ 5.5% - 6.0% ] 5.76% | 4,498,065 | 9.1% |
[ 6.0% - 6.5% ] 6.23% | 2,718,049 | 10.9% |
[ 6.5% - 7.0% ] 6.73% | 3,258,153 | 11.1% |
[ 7.0% - 7.5% ] 7.20% | 2,718,820 | 9.7% |
[ 7.5% - 8.0% ] 7.75% | 1,750,802 | 11.2% |
[ 8.0% - 8.5% ] 8.21% | 2,288,884 | 8.0% |
[ 8.5% - 9.0% ] 8.74% | 1,750,985 | 9.7% |
[ 9.0% - 9.5% ] 9.22% | 1,574,752 | 8.5% |
[ 9.5% - 10.0% ] 9.76% | 1,024,082 | 10.1% |
[ 10.0% - 10.5% ] 10.21% | 716,206 | 10.6% |
[ 10.5% - 11.0% ] 10.77% | 1,091,418 | 10.1% |
[ 11.0% - 11.5% ] 11.23% | 642,107 | 10.2% |
[ 11.5% - 12.0% ] 11.69% | 882,009 | 8.0% |
[ 12.0% - 12.5% ] 12.18% | 738,171 | 8.2% |
[ 12.5% - 13.0% ] 12.79% | 585,580 | 9.8% |
[ 13.0% - 13.5% ] 13.20% | 617,475 | 9.0% |
[ 13.5% - 14.0% ] 13.81% | 377,329 | 12.5% |
[ 14.0% - 14.5% ] 14.24% | 442,364 | 7.2% |
[ 14.5% - 15.0% ] 14.76% | 343,036 | 9.8% |
[ 15.0% - 15.5% ] 15.26% | 138,924 | 5.9% |
[ 15.5% - 16.0% ] 15.67% | 365,500 | 10.2% |
[ 16.0% - 16.5% ] 16.31% | 447,068 | 6.1% |
[ 16.5% - 17.0% ] 16.75% | 133,631 | 13.0% |
[ 17.0% - 17.5% ] 17.32% | 112,346 | 10.2% |
[ 17.5% - 18.0% ] 17.71% | 242,806 | 11.9% |
[ 18.0% - 18.5% ] 18.25% | 264,825 | 9.3% |
[ 18.5% - 19.0% ] 18.71% | 42,034 | 15.9% |
[ 19.0% - 19.5% ] 19.19% | 101,414 | 4.0% |
[ 19.5% - 20.0% ] 19.78% | 53,314 | 10.1% |
[ 20.0% - 20.5% ] 20.26% | 117,467 | 11.1% |
[ 20.5% - 21.0% ] 20.53% | 5,973 | 40.0% |
[ 21.0% - 21.5% ] 21.27% | 37,360 | 29.1% |
[ 22.0% - 22.5% ] 22.13% | 87,404 | 12.0% |
[ 22.5% - 23.0% ] 22.64% | 44,075 | 11.3% |
[ 23.0% - 23.5% ] 23.16% | 1,792 | 16.7% |
[ 24.0% - 24.5% ] 24.05% | 2,640 | 21.6% |
[ 25.0% - 25.5% ] 25.35% | 34,898 | 5.8% |
[ 26.0% - 26.5% ] 26.16% | 100,990 | 5.1% |
[ 26.5% - 27.0% ] 26.90% | 21,726 | 12.4% |
[ 27.0% - 27.5% ] 27.47% | 1,937 | 4.5% |
[ 27.5% - 28.0% ] 27.70% | 23,584 | 19.7% |
[ 28.5% - 29.0% ] 28.52% | 24,670 | 9.0% |
[ 30.0% - 30.5% ] 30.41% | 5,117 | 43.6% |
[ 31.0% - 31.5% ] 31.23% | 36,556 | 8.6% |
[ 32.0% - 32.5% ] 32.20% | 2,140 | 4.9% |
[ 32.5% - 33.0% ] 32.64% | 21,329 | 3.2% |
[ 33.0% - 33.5% ] 33.45% | 2,613 | 5.7% |
[ 42.0% - 42.5% ] 42.05% | 2,699 | 14.0% |
[ 51.0% - 51.5% ] 51.10% | 499 | 80.0% |