Polish 4 or more Vehicles in Household
COMPARE
Polish
Select to Compare
4 or more Vehicles in Household
Polish 4 or more Vehicles in Household
6.4%
4+ VEHICLES AVAILABLE
56.9/ 100
METRIC RATING
167th/ 347
METRIC RANK
Polish 4 or more Vehicles in Household Correlation Chart
The statistical analysis conducted on geographies consisting of 557,050,036 people shows a moderate positive correlation between the proportion of Poles and percentage of households with 4 or more vehicles available in the United States with a correlation coefficient (R) of 0.475 and weighted average of 6.4%. On average, for every 1% (one percent) increase in Poles within a typical geography, there is an increase of 0.19% in percentage of households with 4 or more vehicles available.
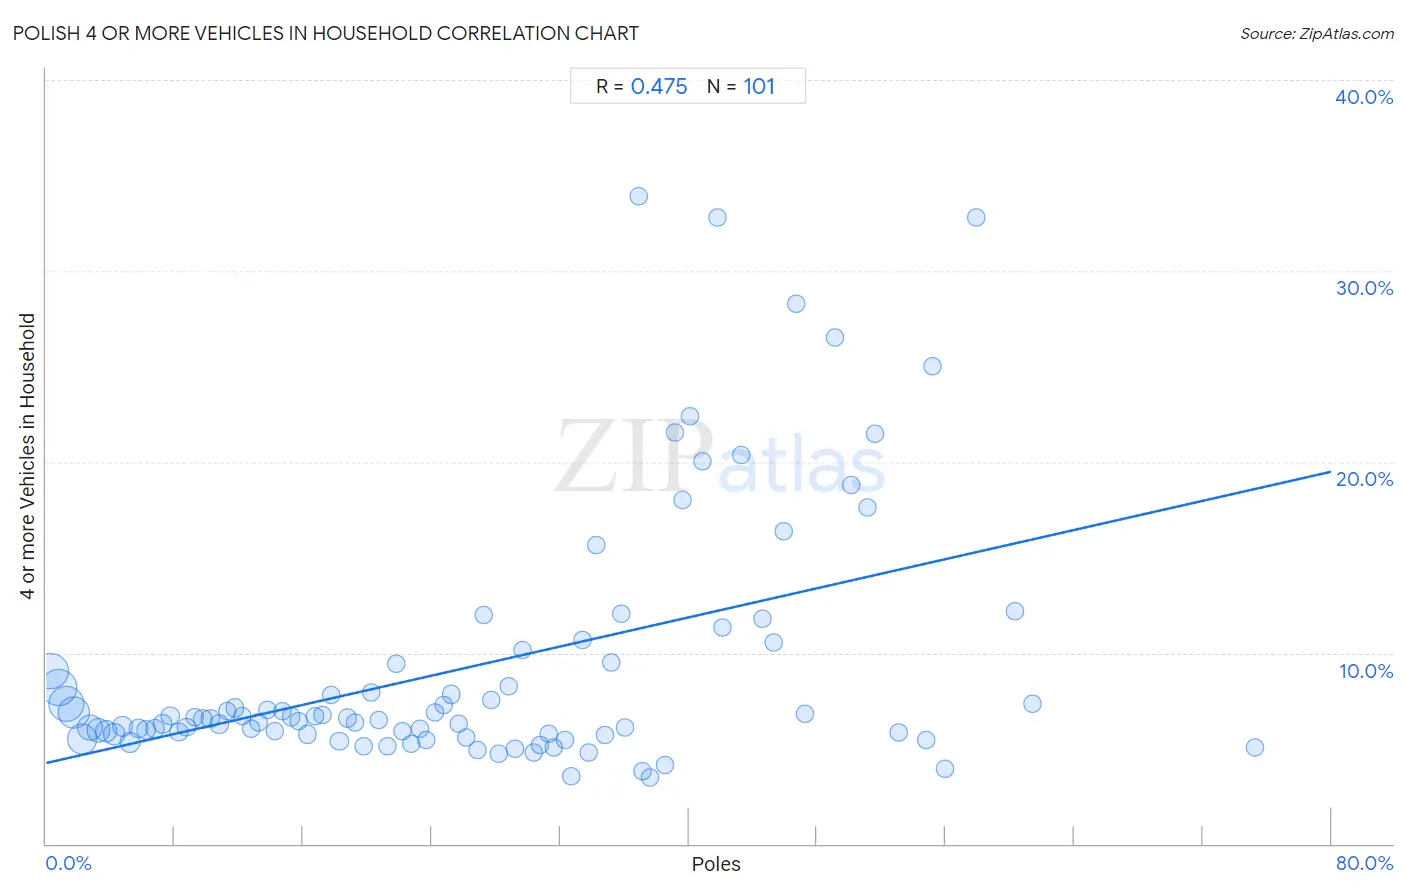
It is essential to understand that the correlation between the percentage of Poles and percentage of households with 4 or more vehicles available does not imply a direct cause-and-effect relationship. It remains uncertain whether the presence of Poles influences an upward or downward trend in the level of percentage of households with 4 or more vehicles available within an area, or if Poles simply ended up residing in those areas with higher or lower levels of percentage of households with 4 or more vehicles available due to other factors.
Demographics Similar to Poles by 4 or more Vehicles in Household
In terms of 4 or more vehicles in household, the demographic groups most similar to Poles are Immigrants from Denmark (6.4%, a difference of 0.10%), Lebanese (6.4%, a difference of 0.11%), Estonian (6.4%, a difference of 0.18%), Immigrants from Peru (6.4%, a difference of 0.31%), and Immigrants from Syria (6.3%, a difference of 0.42%).
| Demographics | Rating | Rank | 4 or more Vehicles in Household |
| Palestinians | 65.8 /100 | #160 | Good 6.4% |
| Immigrants from Cameroon | 64.4 /100 | #161 | Good 6.4% |
| Immigrants from Pakistan | 63.2 /100 | #162 | Good 6.4% |
| Chileans | 61.2 /100 | #163 | Good 6.4% |
| Hungarians | 61.1 /100 | #164 | Good 6.4% |
| Immigrants from Peru | 59.8 /100 | #165 | Average 6.4% |
| Immigrants from Denmark | 57.8 /100 | #166 | Average 6.4% |
| Poles | 56.9 /100 | #167 | Average 6.4% |
| Lebanese | 55.8 /100 | #168 | Average 6.4% |
| Estonians | 55.1 /100 | #169 | Average 6.4% |
| Immigrants from Syria | 52.8 /100 | #170 | Average 6.3% |
| Immigrants from India | 51.9 /100 | #171 | Average 6.3% |
| Immigrants from Lebanon | 51.7 /100 | #172 | Average 6.3% |
| Slovenes | 51.1 /100 | #173 | Average 6.3% |
| Lithuanians | 50.0 /100 | #174 | Average 6.3% |
Polish 4 or more Vehicles in Household Correlation Summary
| Measurement | Polish Data | 4 or more Vehicles in Household Data |
| Minimum | 0.26% | 3.5% |
| Maximum | 75.2% | 33.9% |
| Range | 75.0% | 30.4% |
| Mean | 26.5% | 9.3% |
| Median | 25.2% | 6.6% |
| Interquartile 25% (IQ1) | 12.5% | 5.7% |
| Interquartile 75% (IQ3) | 38.1% | 9.5% |
| Interquartile Range (IQR) | 25.6% | 3.7% |
| Standard Deviation (Sample) | 16.8% | 6.7% |
| Standard Deviation (Population) | 16.7% | 6.7% |
Correlation Details
| Polish Percentile | Sample Size | 4 or more Vehicles in Household |
[ 0.0% - 0.5% ] 0.26% | 84,348,435 | 9.0% |
[ 0.5% - 1.0% ] 0.76% | 88,609,281 | 8.2% |
[ 1.0% - 1.5% ] 1.26% | 81,783,138 | 7.3% |
[ 1.5% - 2.0% ] 1.74% | 64,344,808 | 6.9% |
[ 2.0% - 2.5% ] 2.23% | 56,866,654 | 5.5% |
[ 2.5% - 3.0% ] 2.75% | 34,764,579 | 6.1% |
[ 3.0% - 3.5% ] 3.24% | 26,495,785 | 5.9% |
[ 3.5% - 4.0% ] 3.76% | 18,027,179 | 5.9% |
[ 4.0% - 4.5% ] 4.24% | 14,179,661 | 5.7% |
[ 4.5% - 5.0% ] 4.74% | 10,765,833 | 6.1% |
[ 5.0% - 5.5% ] 5.21% | 11,800,544 | 5.3% |
[ 5.5% - 6.0% ] 5.75% | 8,947,280 | 6.1% |
[ 6.0% - 6.5% ] 6.23% | 6,905,120 | 5.9% |
[ 6.5% - 7.0% ] 6.74% | 6,335,249 | 6.0% |
[ 7.0% - 7.5% ] 7.21% | 5,080,599 | 6.3% |
[ 7.5% - 8.0% ] 7.74% | 3,726,226 | 6.7% |
[ 8.0% - 8.5% ] 8.23% | 4,646,439 | 5.9% |
[ 8.5% - 9.0% ] 8.75% | 3,688,546 | 6.1% |
[ 9.0% - 9.5% ] 9.24% | 3,030,095 | 6.6% |
[ 9.5% - 10.0% ] 9.75% | 2,480,865 | 6.5% |
[ 10.0% - 10.5% ] 10.22% | 1,895,488 | 6.6% |
[ 10.5% - 11.0% ] 10.76% | 2,028,754 | 6.3% |
[ 11.0% - 11.5% ] 11.25% | 1,897,452 | 7.0% |
[ 11.5% - 12.0% ] 11.72% | 1,637,672 | 7.1% |
[ 12.0% - 12.5% ] 12.21% | 1,480,434 | 6.7% |
[ 12.5% - 13.0% ] 12.77% | 1,287,426 | 6.0% |
[ 13.0% - 13.5% ] 13.23% | 1,276,166 | 6.4% |
[ 13.5% - 14.0% ] 13.77% | 754,643 | 7.0% |
[ 14.0% - 14.5% ] 14.23% | 1,037,246 | 5.9% |
[ 14.5% - 15.0% ] 14.72% | 644,601 | 6.9% |
[ 15.0% - 15.5% ] 15.27% | 738,289 | 6.7% |
[ 15.5% - 16.0% ] 15.73% | 745,846 | 6.4% |
[ 16.0% - 16.5% ] 16.29% | 830,479 | 5.7% |
[ 16.5% - 17.0% ] 16.74% | 355,873 | 6.7% |
[ 17.0% - 17.5% ] 17.22% | 357,824 | 6.7% |
[ 17.5% - 18.0% ] 17.72% | 397,408 | 7.8% |
[ 18.0% - 18.5% ] 18.25% | 353,829 | 5.4% |
[ 18.5% - 19.0% ] 18.78% | 354,280 | 6.6% |
[ 19.0% - 19.5% ] 19.19% | 172,163 | 6.3% |
[ 19.5% - 20.0% ] 19.77% | 171,725 | 5.1% |
[ 20.0% - 20.5% ] 20.26% | 205,093 | 7.9% |
[ 20.5% - 21.0% ] 20.69% | 55,047 | 6.5% |
[ 21.0% - 21.5% ] 21.23% | 83,292 | 5.1% |
[ 21.5% - 22.0% ] 21.79% | 62,560 | 9.5% |
[ 22.0% - 22.5% ] 22.15% | 144,799 | 5.9% |
[ 22.5% - 23.0% ] 22.72% | 165,273 | 5.2% |
[ 23.0% - 23.5% ] 23.25% | 105,070 | 6.0% |
[ 23.5% - 24.0% ] 23.67% | 40,268 | 5.5% |
[ 24.0% - 24.5% ] 24.22% | 135,583 | 6.9% |
[ 24.5% - 25.0% ] 24.76% | 71,101 | 7.3% |
[ 25.0% - 25.5% ] 25.23% | 118,600 | 7.8% |
[ 25.5% - 26.0% ] 25.69% | 18,968 | 6.3% |
[ 26.0% - 26.5% ] 26.17% | 110,036 | 5.6% |
[ 26.5% - 27.0% ] 26.88% | 39,782 | 4.9% |
[ 27.0% - 27.5% ] 27.20% | 16,480 | 12.0% |
[ 27.5% - 28.0% ] 27.70% | 40,646 | 7.5% |
[ 28.0% - 28.5% ] 28.19% | 11,786 | 4.7% |
[ 28.5% - 29.0% ] 28.76% | 73,759 | 8.3% |
[ 29.0% - 29.5% ] 29.20% | 9,278 | 5.0% |
[ 29.5% - 30.0% ] 29.63% | 8,838 | 10.1% |
[ 30.0% - 30.5% ] 30.32% | 30,391 | 4.8% |
[ 30.5% - 31.0% ] 30.74% | 14,563 | 5.2% |
[ 31.0% - 31.5% ] 31.28% | 83,640 | 5.8% |
[ 31.5% - 32.0% ] 31.58% | 35,758 | 5.1% |
[ 32.0% - 32.5% ] 32.28% | 31,420 | 5.4% |
[ 32.5% - 33.0% ] 32.65% | 23,370 | 3.6% |
[ 33.0% - 33.5% ] 33.36% | 3,921 | 10.6% |
[ 33.5% - 34.0% ] 33.81% | 1,967 | 4.8% |
[ 34.0% - 34.5% ] 34.22% | 9,746 | 15.7% |
[ 34.5% - 35.0% ] 34.80% | 523 | 5.7% |
[ 35.0% - 35.5% ] 35.16% | 1,169 | 9.5% |
[ 35.5% - 36.0% ] 35.76% | 962 | 12.0% |
[ 36.0% - 36.5% ] 36.05% | 1,864 | 6.1% |
[ 36.5% - 37.0% ] 36.86% | 350 | 33.9% |
[ 37.0% - 37.5% ] 37.12% | 23,894 | 3.8% |
[ 37.5% - 38.0% ] 37.61% | 2,212 | 3.5% |
[ 38.5% - 39.0% ] 38.54% | 1,383 | 4.1% |
[ 39.0% - 39.5% ] 39.17% | 120 | 21.6% |
[ 39.5% - 40.0% ] 39.64% | 2,341 | 18.0% |
[ 40.0% - 40.5% ] 40.05% | 402 | 22.4% |
[ 40.5% - 41.0% ] 40.86% | 1,263 | 20.0% |
[ 41.5% - 42.0% ] 41.78% | 529 | 32.8% |
[ 42.0% - 42.5% ] 42.07% | 3,007 | 11.3% |
[ 43.0% - 43.5% ] 43.31% | 1,494 | 20.4% |
[ 44.5% - 45.0% ] 44.58% | 1,337 | 11.8% |
[ 45.0% - 45.5% ] 45.31% | 192 | 10.5% |
[ 45.5% - 46.0% ] 45.90% | 2,525 | 16.4% |
[ 46.5% - 47.0% ] 46.73% | 214 | 28.3% |
[ 47.0% - 47.5% ] 47.25% | 3,346 | 6.8% |
[ 49.0% - 49.5% ] 49.14% | 1,219 | 26.5% |
[ 50.0% - 50.5% ] 50.14% | 2,140 | 18.8% |
[ 51.0% - 51.5% ] 51.10% | 499 | 17.6% |
[ 51.5% - 52.0% ] 51.59% | 283 | 21.4% |
[ 53.0% - 53.5% ] 53.08% | 130 | 5.8% |
[ 54.5% - 55.0% ] 54.81% | 135 | 5.4% |
[ 55.0% - 55.5% ] 55.19% | 183 | 25.0% |
[ 55.5% - 56.0% ] 55.93% | 177 | 3.9% |
[ 57.5% - 58.0% ] 57.88% | 387 | 32.8% |
[ 60.0% - 60.5% ] 60.31% | 257 | 12.2% |
[ 61.0% - 61.5% ] 61.42% | 324 | 7.4% |
[ 75.0% - 75.5% ] 75.22% | 226 | 5.0% |