Polish 3 or more Vehicles in Household
COMPARE
Polish
Select to Compare
3 or more Vehicles in Household
Polish 3 or more Vehicles in Household
20.2%
3+ VEHICLES AVAILABLE
87.3/ 100
METRIC RATING
134th/ 347
METRIC RANK
Polish 3 or more Vehicles in Household Correlation Chart
The statistical analysis conducted on geographies consisting of 559,689,592 people shows a significant positive correlation between the proportion of Poles and percentage of households with 3 or more vehicles available in the United States with a correlation coefficient (R) of 0.604 and weighted average of 20.2%. On average, for every 1% (one percent) increase in Poles within a typical geography, there is an increase of 0.62% in percentage of households with 3 or more vehicles available.
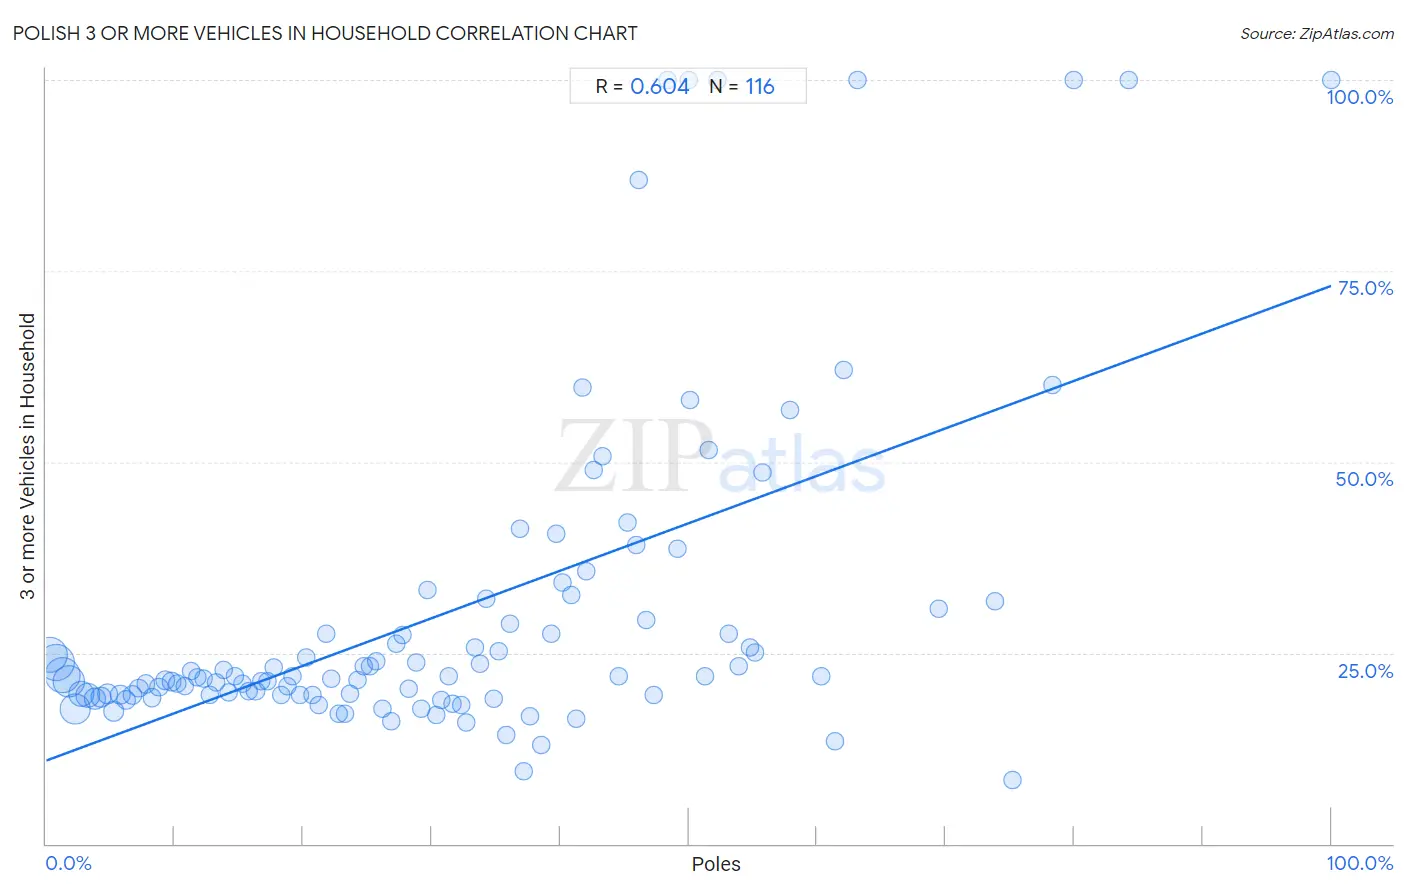
It is essential to understand that the correlation between the percentage of Poles and percentage of households with 3 or more vehicles available does not imply a direct cause-and-effect relationship. It remains uncertain whether the presence of Poles influences an upward or downward trend in the level of percentage of households with 3 or more vehicles available within an area, or if Poles simply ended up residing in those areas with higher or lower levels of percentage of households with 3 or more vehicles available due to other factors.
Demographics Similar to Poles by 3 or more Vehicles in Household
In terms of 3 or more vehicles in household, the demographic groups most similar to Poles are Immigrants from India (20.2%, a difference of 0.020%), Immigrants from Nicaragua (20.2%, a difference of 0.030%), Immigrants from Iraq (20.2%, a difference of 0.040%), Immigrants from Canada (20.2%, a difference of 0.090%), and Immigrants from North America (20.2%, a difference of 0.090%).
| Demographics | Rating | Rank | 3 or more Vehicles in Household |
| Immigrants from Bolivia | 92.0 /100 | #127 | Exceptional 20.4% |
| New Zealanders | 91.3 /100 | #128 | Exceptional 20.4% |
| Zimbabweans | 88.7 /100 | #129 | Excellent 20.3% |
| Greeks | 88.6 /100 | #130 | Excellent 20.3% |
| Immigrants from Asia | 88.1 /100 | #131 | Excellent 20.2% |
| Immigrants from Canada | 87.8 /100 | #132 | Excellent 20.2% |
| Immigrants from North America | 87.8 /100 | #133 | Excellent 20.2% |
| Poles | 87.3 /100 | #134 | Excellent 20.2% |
| Immigrants from India | 87.2 /100 | #135 | Excellent 20.2% |
| Immigrants from Nicaragua | 87.1 /100 | #136 | Excellent 20.2% |
| Immigrants from Iraq | 87.1 /100 | #137 | Excellent 20.2% |
| Aleuts | 86.3 /100 | #138 | Excellent 20.2% |
| Slovenes | 85.5 /100 | #139 | Excellent 20.2% |
| French American Indians | 85.3 /100 | #140 | Excellent 20.1% |
| Ottawa | 84.9 /100 | #141 | Excellent 20.1% |
Polish 3 or more Vehicles in Household Correlation Summary
| Measurement | Polish Data | 3 or more Vehicles in Household Data |
| Minimum | 0.26% | 8.4% |
| Maximum | 100.0% | 100.0% |
| Range | 99.7% | 91.6% |
| Mean | 31.2% | 30.3% |
| Median | 29.0% | 21.9% |
| Interquartile 25% (IQ1) | 14.5% | 19.5% |
| Interquartile 75% (IQ3) | 44.9% | 30.0% |
| Interquartile Range (IQR) | 30.4% | 10.6% |
| Standard Deviation (Sample) | 20.8% | 21.4% |
| Standard Deviation (Population) | 20.7% | 21.3% |
Correlation Details
| Polish Percentile | Sample Size | 3 or more Vehicles in Household |
[ 0.0% - 0.5% ] 0.26% | 84,709,333 | 24.8% |
[ 0.5% - 1.0% ] 0.76% | 88,870,374 | 23.7% |
[ 1.0% - 1.5% ] 1.26% | 82,095,918 | 22.0% |
[ 1.5% - 2.0% ] 1.74% | 64,495,021 | 21.3% |
[ 2.0% - 2.5% ] 2.23% | 57,186,301 | 17.6% |
[ 2.5% - 3.0% ] 2.75% | 34,950,920 | 19.6% |
[ 3.0% - 3.5% ] 3.24% | 26,578,215 | 19.5% |
[ 3.5% - 4.0% ] 3.76% | 18,254,955 | 18.9% |
[ 4.0% - 4.5% ] 4.24% | 14,227,097 | 19.2% |
[ 4.5% - 5.0% ] 4.74% | 11,029,574 | 19.6% |
[ 5.0% - 5.5% ] 5.21% | 11,841,657 | 17.3% |
[ 5.5% - 6.0% ] 5.75% | 9,038,079 | 19.5% |
[ 6.0% - 6.5% ] 6.23% | 6,954,449 | 18.8% |
[ 6.5% - 7.0% ] 6.74% | 6,367,345 | 19.5% |
[ 7.0% - 7.5% ] 7.21% | 5,112,527 | 20.4% |
[ 7.5% - 8.0% ] 7.74% | 3,752,271 | 20.9% |
[ 8.0% - 8.5% ] 8.23% | 4,667,998 | 19.2% |
[ 8.5% - 9.0% ] 8.75% | 3,695,846 | 20.5% |
[ 9.0% - 9.5% ] 9.24% | 3,043,950 | 21.4% |
[ 9.5% - 10.0% ] 9.75% | 2,486,625 | 21.2% |
[ 10.0% - 10.5% ] 10.22% | 1,904,820 | 21.0% |
[ 10.5% - 11.0% ] 10.76% | 2,033,675 | 20.6% |
[ 11.0% - 11.5% ] 11.25% | 1,906,945 | 22.6% |
[ 11.5% - 12.0% ] 11.72% | 1,644,660 | 21.8% |
[ 12.0% - 12.5% ] 12.21% | 1,484,731 | 21.6% |
[ 12.5% - 13.0% ] 12.77% | 1,294,161 | 19.5% |
[ 13.0% - 13.5% ] 13.23% | 1,279,799 | 21.1% |
[ 13.5% - 14.0% ] 13.77% | 757,738 | 22.7% |
[ 14.0% - 14.5% ] 14.23% | 1,042,750 | 19.9% |
[ 14.5% - 15.0% ] 14.72% | 645,463 | 21.9% |
[ 15.0% - 15.5% ] 15.27% | 740,308 | 20.9% |
[ 15.5% - 16.0% ] 15.73% | 747,897 | 20.0% |
[ 16.0% - 16.5% ] 16.29% | 833,206 | 20.0% |
[ 16.5% - 17.0% ] 16.74% | 357,150 | 21.3% |
[ 17.0% - 17.5% ] 17.22% | 363,488 | 21.3% |
[ 17.5% - 18.0% ] 17.72% | 399,498 | 23.1% |
[ 18.0% - 18.5% ] 18.25% | 354,965 | 19.5% |
[ 18.5% - 19.0% ] 18.78% | 356,458 | 20.7% |
[ 19.0% - 19.5% ] 19.19% | 174,041 | 21.9% |
[ 19.5% - 20.0% ] 19.77% | 177,003 | 19.4% |
[ 20.0% - 20.5% ] 20.26% | 206,885 | 24.3% |
[ 20.5% - 21.0% ] 20.69% | 55,623 | 19.4% |
[ 21.0% - 21.5% ] 21.24% | 83,644 | 18.1% |
[ 21.5% - 22.0% ] 21.79% | 64,400 | 27.6% |
[ 22.0% - 22.5% ] 22.15% | 145,278 | 21.6% |
[ 22.5% - 23.0% ] 22.72% | 166,088 | 17.1% |
[ 23.0% - 23.5% ] 23.26% | 105,296 | 17.1% |
[ 23.5% - 24.0% ] 23.67% | 40,369 | 19.6% |
[ 24.0% - 24.5% ] 24.22% | 135,941 | 21.4% |
[ 24.5% - 25.0% ] 24.76% | 72,110 | 23.3% |
[ 25.0% - 25.5% ] 25.23% | 118,891 | 23.2% |
[ 25.5% - 26.0% ] 25.69% | 19,259 | 23.9% |
[ 26.0% - 26.5% ] 26.16% | 117,161 | 17.6% |
[ 26.5% - 27.0% ] 26.88% | 39,861 | 16.0% |
[ 27.0% - 27.5% ] 27.20% | 17,012 | 26.1% |
[ 27.5% - 28.0% ] 27.70% | 40,646 | 27.3% |
[ 28.0% - 28.5% ] 28.19% | 12,584 | 20.3% |
[ 28.5% - 29.0% ] 28.76% | 73,759 | 23.7% |
[ 29.0% - 29.5% ] 29.20% | 10,643 | 17.6% |
[ 29.5% - 30.0% ] 29.63% | 9,297 | 33.2% |
[ 30.0% - 30.5% ] 30.32% | 30,908 | 16.9% |
[ 30.5% - 31.0% ] 30.74% | 14,686 | 18.8% |
[ 31.0% - 31.5% ] 31.28% | 84,108 | 21.9% |
[ 31.5% - 32.0% ] 31.58% | 36,002 | 18.3% |
[ 32.0% - 32.5% ] 32.28% | 31,457 | 18.1% |
[ 32.5% - 33.0% ] 32.65% | 23,370 | 15.9% |
[ 33.0% - 33.5% ] 33.36% | 3,942 | 25.7% |
[ 33.5% - 34.0% ] 33.80% | 2,083 | 23.6% |
[ 34.0% - 34.5% ] 34.22% | 9,931 | 32.0% |
[ 34.5% - 35.0% ] 34.80% | 523 | 19.0% |
[ 35.0% - 35.5% ] 35.17% | 1,396 | 25.2% |
[ 35.5% - 36.0% ] 35.75% | 1,102 | 14.2% |
[ 36.0% - 36.5% ] 36.08% | 2,098 | 28.8% |
[ 36.5% - 37.0% ] 36.86% | 350 | 41.3% |
[ 37.0% - 37.5% ] 37.12% | 23,894 | 9.4% |
[ 37.5% - 38.0% ] 37.62% | 2,294 | 16.6% |
[ 38.5% - 39.0% ] 38.55% | 1,603 | 12.9% |
[ 39.0% - 39.5% ] 39.34% | 943 | 27.5% |
[ 39.5% - 40.0% ] 39.65% | 2,396 | 40.6% |
[ 40.0% - 40.5% ] 40.16% | 1,016 | 34.2% |
[ 40.5% - 41.0% ] 40.86% | 1,263 | 32.6% |
[ 41.0% - 41.5% ] 41.21% | 182 | 16.4% |
[ 41.5% - 42.0% ] 41.78% | 529 | 59.7% |
[ 42.0% - 42.5% ] 42.07% | 3,076 | 35.7% |
[ 42.5% - 43.0% ] 42.58% | 310 | 48.9% |
[ 43.0% - 43.5% ] 43.31% | 1,494 | 50.8% |
[ 44.5% - 45.0% ] 44.58% | 1,337 | 21.9% |
[ 45.0% - 45.5% ] 45.24% | 336 | 42.1% |
[ 45.5% - 46.0% ] 45.90% | 2,525 | 39.2% |
[ 46.0% - 46.5% ] 46.15% | 91 | 86.8% |
[ 46.5% - 47.0% ] 46.73% | 413 | 29.3% |
[ 47.0% - 47.5% ] 47.25% | 3,346 | 19.5% |
[ 48.0% - 48.5% ] 48.39% | 31 | 100.0% |
[ 49.0% - 49.5% ] 49.10% | 2,067 | 38.6% |
[ 50.0% - 50.5% ] 50.00% | 24 | 100.0% |
[ 50.0% - 50.5% ] 50.14% | 2,140 | 58.2% |
[ 51.0% - 51.5% ] 51.31% | 1,183 | 21.9% |
[ 51.5% - 52.0% ] 51.59% | 283 | 51.6% |
[ 52.0% - 52.5% ] 52.27% | 44 | 100.0% |
[ 53.0% - 53.5% ] 53.08% | 130 | 27.5% |
[ 53.5% - 54.0% ] 53.87% | 362 | 23.2% |
[ 54.5% - 55.0% ] 54.81% | 135 | 25.7% |
[ 55.0% - 55.5% ] 55.19% | 183 | 25.0% |
[ 55.5% - 56.0% ] 55.78% | 294 | 48.5% |
[ 57.5% - 58.0% ] 57.88% | 387 | 56.8% |
[ 60.0% - 60.5% ] 60.31% | 257 | 22.0% |
[ 61.0% - 61.5% ] 61.42% | 324 | 13.4% |
[ 62.0% - 62.5% ] 62.07% | 29 | 62.1% |
[ 63.0% - 63.5% ] 63.10% | 84 | 100.0% |
[ 69.0% - 69.5% ] 69.48% | 154 | 30.8% |
[ 73.5% - 74.0% ] 73.81% | 84 | 31.8% |
[ 75.0% - 75.5% ] 75.22% | 226 | 8.4% |
[ 78.0% - 78.5% ] 78.26% | 46 | 60.0% |
[ 80.0% - 80.5% ] 80.00% | 25 | 100.0% |
[ 84.0% - 84.5% ] 84.25% | 127 | 100.0% |
[ 99.5% - 100.0% ] 100.00% | 11 | 100.0% |