Polish Married-Couple Family Poverty
COMPARE
Polish
Select to Compare
Married-Couple Family Poverty
Polish Married-Couple Family Poverty
4.0%
POVERTY | MARRIED-COUPLE FAMILIES
100.0/ 100
METRIC RATING
15th/ 347
METRIC RANK
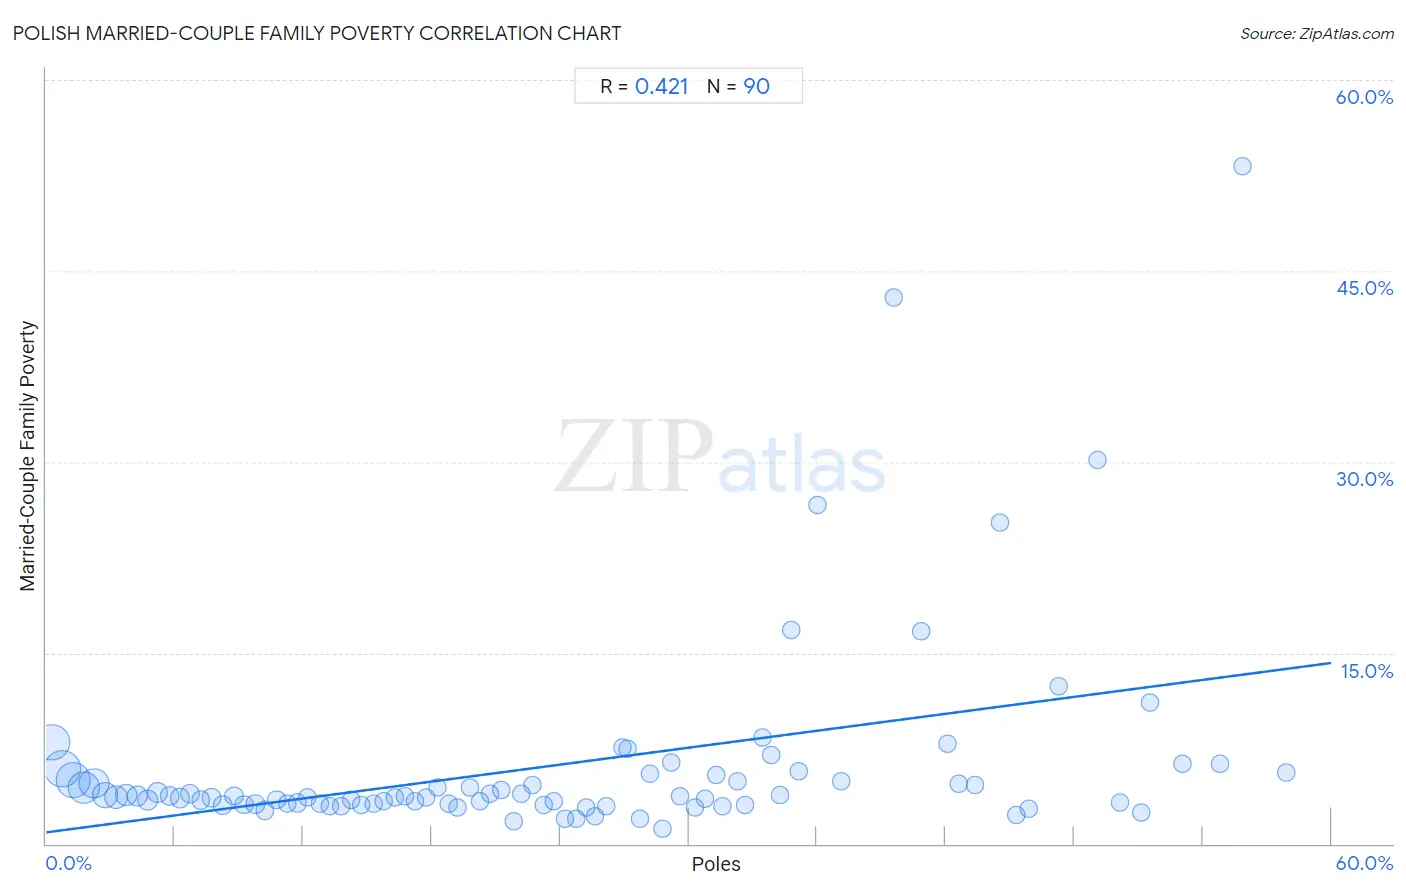
Polish Married-Couple Family Poverty Correlation Chart
The statistical analysis conducted on geographies consisting of 546,544,798 people shows a moderate positive correlation between the proportion of Poles and poverty level among married-couple families in the United States with a correlation coefficient (R) of 0.421 and weighted average of 4.0%. On average, for every 1% (one percent) increase in Poles within a typical geography, there is an increase of 0.22% in poverty level among married-couple families.
It is essential to understand that the correlation between the percentage of Poles and poverty level among married-couple families does not imply a direct cause-and-effect relationship. It remains uncertain whether the presence of Poles influences an upward or downward trend in the level of poverty level among married-couple families within an area, or if Poles simply ended up residing in those areas with higher or lower levels of poverty level among married-couple families due to other factors.
Demographics Similar to Poles by Married-Couple Family Poverty
In terms of married-couple family poverty, the demographic groups most similar to Poles are Slovak (4.0%, a difference of 0.030%), Czech (4.0%, a difference of 0.070%), German (4.0%, a difference of 0.27%), Filipino (4.0%, a difference of 0.30%), and Italian (4.0%, a difference of 0.31%).
| Demographics | Rating | Rank | Married-Couple Family Poverty |
| Thais | 100.0 /100 | #8 | Exceptional 3.9% |
| Croatians | 100.0 /100 | #9 | Exceptional 3.9% |
| Carpatho Rusyns | 100.0 /100 | #10 | Exceptional 3.9% |
| Lithuanians | 100.0 /100 | #11 | Exceptional 4.0% |
| Bulgarians | 100.0 /100 | #12 | Exceptional 4.0% |
| Czechs | 100.0 /100 | #13 | Exceptional 4.0% |
| Slovaks | 100.0 /100 | #14 | Exceptional 4.0% |
| Poles | 100.0 /100 | #15 | Exceptional 4.0% |
| Germans | 100.0 /100 | #16 | Exceptional 4.0% |
| Filipinos | 100.0 /100 | #17 | Exceptional 4.0% |
| Italians | 100.0 /100 | #18 | Exceptional 4.0% |
| Immigrants from Ireland | 99.9 /100 | #19 | Exceptional 4.1% |
| Maltese | 99.9 /100 | #20 | Exceptional 4.1% |
| Zimbabweans | 99.9 /100 | #21 | Exceptional 4.1% |
| Immigrants from Singapore | 99.9 /100 | #22 | Exceptional 4.1% |
Polish Married-Couple Family Poverty Correlation Summary
| Measurement | Polish Data | Married-Couple Family Poverty Data |
| Minimum | 0.26% | 1.1% |
| Maximum | 57.9% | 53.2% |
| Range | 57.6% | 52.1% |
| Mean | 23.9% | 6.2% |
| Median | 22.4% | 3.7% |
| Interquartile 25% (IQ1) | 11.2% | 3.1% |
| Interquartile 75% (IQ3) | 33.9% | 5.4% |
| Interquartile Range (IQR) | 22.6% | 2.3% |
| Standard Deviation (Sample) | 15.3% | 8.1% |
| Standard Deviation (Population) | 15.2% | 8.0% |
Correlation Details
| Polish Percentile | Sample Size | Married-Couple Family Poverty |
[ 0.0% - 0.5% ] 0.26% | 83,559,131 | 8.0% |
[ 0.5% - 1.0% ] 0.76% | 87,582,426 | 5.9% |
[ 1.0% - 1.5% ] 1.26% | 80,943,928 | 5.0% |
[ 1.5% - 2.0% ] 1.74% | 63,343,468 | 4.4% |
[ 2.0% - 2.5% ] 2.23% | 56,143,750 | 4.8% |
[ 2.5% - 3.0% ] 2.75% | 34,027,156 | 3.8% |
[ 3.0% - 3.5% ] 3.24% | 25,872,598 | 3.7% |
[ 3.5% - 4.0% ] 3.76% | 17,509,493 | 3.8% |
[ 4.0% - 4.5% ] 4.24% | 13,593,140 | 3.7% |
[ 4.5% - 5.0% ] 4.74% | 10,520,043 | 3.4% |
[ 5.0% - 5.5% ] 5.21% | 11,471,844 | 4.0% |
[ 5.5% - 6.0% ] 5.75% | 8,702,233 | 3.8% |
[ 6.0% - 6.5% ] 6.23% | 6,605,490 | 3.6% |
[ 6.5% - 7.0% ] 6.74% | 6,020,266 | 4.0% |
[ 7.0% - 7.5% ] 7.21% | 4,821,398 | 3.4% |
[ 7.5% - 8.0% ] 7.73% | 3,509,586 | 3.6% |
[ 8.0% - 8.5% ] 8.23% | 4,453,126 | 3.0% |
[ 8.5% - 9.0% ] 8.75% | 3,494,602 | 3.8% |
[ 9.0% - 9.5% ] 9.24% | 2,903,773 | 3.1% |
[ 9.5% - 10.0% ] 9.75% | 2,337,270 | 3.1% |
[ 10.0% - 10.5% ] 10.22% | 1,791,905 | 2.6% |
[ 10.5% - 11.0% ] 10.76% | 1,940,446 | 3.4% |
[ 11.0% - 11.5% ] 11.25% | 1,809,215 | 3.2% |
[ 11.5% - 12.0% ] 11.73% | 1,555,589 | 3.2% |
[ 12.0% - 12.5% ] 12.21% | 1,410,375 | 3.7% |
[ 12.5% - 13.0% ] 12.77% | 1,226,619 | 3.2% |
[ 13.0% - 13.5% ] 13.23% | 1,215,138 | 2.9% |
[ 13.5% - 14.0% ] 13.77% | 714,596 | 3.0% |
[ 14.0% - 14.5% ] 14.23% | 969,938 | 3.5% |
[ 14.5% - 15.0% ] 14.72% | 609,772 | 3.1% |
[ 15.0% - 15.5% ] 15.27% | 719,745 | 3.2% |
[ 15.5% - 16.0% ] 15.73% | 700,007 | 3.3% |
[ 16.0% - 16.5% ] 16.29% | 791,062 | 3.7% |
[ 16.5% - 17.0% ] 16.74% | 339,727 | 3.7% |
[ 17.0% - 17.5% ] 17.22% | 318,652 | 3.3% |
[ 17.5% - 18.0% ] 17.72% | 372,396 | 3.6% |
[ 18.0% - 18.5% ] 18.24% | 335,197 | 4.4% |
[ 18.5% - 19.0% ] 18.79% | 326,209 | 3.1% |
[ 19.0% - 19.5% ] 19.20% | 162,476 | 2.9% |
[ 19.5% - 20.0% ] 19.77% | 165,933 | 4.5% |
[ 20.0% - 20.5% ] 20.28% | 192,453 | 3.3% |
[ 20.5% - 21.0% ] 20.70% | 48,961 | 3.9% |
[ 21.0% - 21.5% ] 21.25% | 70,184 | 4.2% |
[ 21.5% - 22.0% ] 21.81% | 55,234 | 1.7% |
[ 22.0% - 22.5% ] 22.15% | 132,681 | 3.9% |
[ 22.5% - 23.0% ] 22.72% | 160,676 | 4.6% |
[ 23.0% - 23.5% ] 23.25% | 94,116 | 3.0% |
[ 23.5% - 24.0% ] 23.68% | 26,604 | 3.4% |
[ 24.0% - 24.5% ] 24.22% | 130,053 | 2.0% |
[ 24.5% - 25.0% ] 24.76% | 68,679 | 2.0% |
[ 25.0% - 25.5% ] 25.22% | 112,348 | 2.8% |
[ 25.5% - 26.0% ] 25.65% | 14,335 | 2.1% |
[ 26.0% - 26.5% ] 26.17% | 105,874 | 3.0% |
[ 26.5% - 27.0% ] 26.88% | 34,134 | 7.6% |
[ 27.0% - 27.5% ] 27.15% | 13,609 | 7.5% |
[ 27.5% - 28.0% ] 27.71% | 31,573 | 1.9% |
[ 28.0% - 28.5% ] 28.20% | 11,040 | 5.5% |
[ 28.5% - 29.0% ] 28.76% | 69,945 | 1.1% |
[ 29.0% - 29.5% ] 29.20% | 8,658 | 6.3% |
[ 29.5% - 30.0% ] 29.59% | 6,408 | 3.8% |
[ 30.0% - 30.5% ] 30.32% | 29,652 | 2.8% |
[ 30.5% - 31.0% ] 30.75% | 13,549 | 3.6% |
[ 31.0% - 31.5% ] 31.29% | 79,388 | 5.4% |
[ 31.5% - 32.0% ] 31.58% | 35,813 | 3.0% |
[ 32.0% - 32.5% ] 32.28% | 31,420 | 4.9% |
[ 32.5% - 33.0% ] 32.65% | 23,024 | 3.1% |
[ 33.0% - 33.5% ] 33.45% | 2,613 | 8.4% |
[ 33.5% - 34.0% ] 33.87% | 1,565 | 7.0% |
[ 34.0% - 34.5% ] 34.27% | 5,243 | 3.8% |
[ 34.5% - 35.0% ] 34.80% | 523 | 16.8% |
[ 35.0% - 35.5% ] 35.16% | 1,169 | 5.7% |
[ 36.0% - 36.5% ] 36.03% | 1,718 | 26.6% |
[ 37.0% - 37.5% ] 37.12% | 23,676 | 5.0% |
[ 39.5% - 40.0% ] 39.57% | 877 | 42.9% |
[ 40.5% - 41.0% ] 40.86% | 1,182 | 16.7% |
[ 42.0% - 42.5% ] 42.06% | 2,936 | 7.9% |
[ 42.5% - 43.0% ] 42.59% | 108 | 4.8% |
[ 43.0% - 43.5% ] 43.37% | 913 | 4.7% |
[ 44.5% - 45.0% ] 44.52% | 611 | 25.3% |
[ 45.0% - 45.5% ] 45.31% | 192 | 2.2% |
[ 45.5% - 46.0% ] 45.90% | 2,525 | 2.8% |
[ 47.0% - 47.5% ] 47.25% | 3,278 | 12.3% |
[ 49.0% - 49.5% ] 49.10% | 1,719 | 30.1% |
[ 50.0% - 50.5% ] 50.14% | 2,140 | 3.2% |
[ 51.0% - 51.5% ] 51.10% | 499 | 2.5% |
[ 51.5% - 52.0% ] 51.56% | 256 | 11.1% |
[ 53.0% - 53.5% ] 53.08% | 130 | 6.2% |
[ 54.5% - 55.0% ] 54.81% | 135 | 6.2% |
[ 55.5% - 56.0% ] 55.84% | 274 | 53.2% |
[ 57.5% - 58.0% ] 57.88% | 387 | 5.6% |