Polish Disability
COMPARE
Polish
Select to Compare
Disability
Polish Disability
12.2%
DISABILITY
1.7/ 100
METRIC RATING
242nd/ 347
METRIC RANK
Polish Disability Correlation Chart
The statistical analysis conducted on geographies consisting of 560,456,636 people shows a mild positive correlation between the proportion of Poles and percentage of population with a disability in the United States with a correlation coefficient (R) of 0.385 and weighted average of 12.2%. On average, for every 1% (one percent) increase in Poles within a typical geography, there is an increase of 0.17% in percentage of population with a disability.
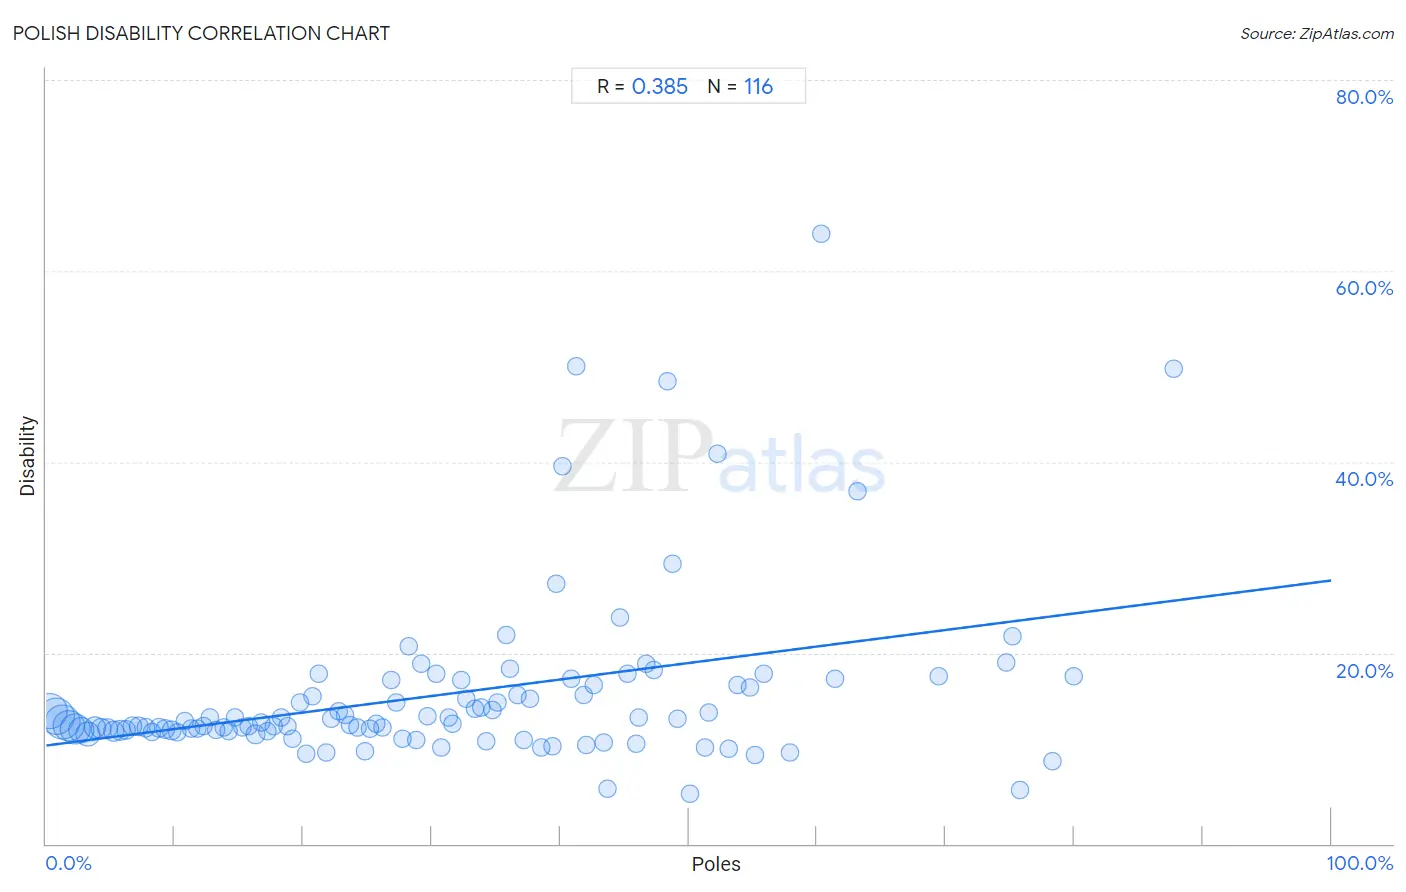
It is essential to understand that the correlation between the percentage of Poles and percentage of population with a disability does not imply a direct cause-and-effect relationship. It remains uncertain whether the presence of Poles influences an upward or downward trend in the level of percentage of population with a disability within an area, or if Poles simply ended up residing in those areas with higher or lower levels of percentage of population with a disability due to other factors.
Demographics Similar to Poles by Disability
In terms of disability, the demographic groups most similar to Poles are Hungarian (12.2%, a difference of 0.020%), Yugoslavian (12.2%, a difference of 0.020%), Swedish (12.2%, a difference of 0.080%), British (12.2%, a difference of 0.090%), and Basque (12.2%, a difference of 0.090%).
| Demographics | Rating | Rank | Disability |
| Yup'ik | 2.2 /100 | #235 | Tragic 12.2% |
| Chinese | 2.0 /100 | #236 | Tragic 12.2% |
| Immigrants from Congo | 1.9 /100 | #237 | Tragic 12.2% |
| Norwegians | 1.9 /100 | #238 | Tragic 12.2% |
| Swedes | 1.8 /100 | #239 | Tragic 12.2% |
| Hungarians | 1.7 /100 | #240 | Tragic 12.2% |
| Yugoslavians | 1.7 /100 | #241 | Tragic 12.2% |
| Poles | 1.7 /100 | #242 | Tragic 12.2% |
| British | 1.5 /100 | #243 | Tragic 12.2% |
| Basques | 1.5 /100 | #244 | Tragic 12.2% |
| Liberians | 1.5 /100 | #245 | Tragic 12.2% |
| Swiss | 1.5 /100 | #246 | Tragic 12.2% |
| Indonesians | 1.4 /100 | #247 | Tragic 12.2% |
| Guamanians/Chamorros | 1.4 /100 | #248 | Tragic 12.3% |
| Carpatho Rusyns | 1.4 /100 | #249 | Tragic 12.3% |
Polish Disability Correlation Summary
| Measurement | Polish Data | Disability Data |
| Minimum | 0.26% | 5.3% |
| Maximum | 87.8% | 63.9% |
| Range | 87.5% | 58.6% |
| Mean | 30.9% | 15.6% |
| Median | 29.0% | 12.7% |
| Interquartile 25% (IQ1) | 14.5% | 11.8% |
| Interquartile 75% (IQ3) | 44.2% | 16.6% |
| Interquartile Range (IQR) | 29.7% | 4.8% |
| Standard Deviation (Sample) | 20.2% | 9.1% |
| Standard Deviation (Population) | 20.1% | 9.0% |
Correlation Details
| Polish Percentile | Sample Size | Disability |
[ 0.0% - 0.5% ] 0.26% | 84,749,066 | 13.9% |
[ 0.5% - 1.0% ] 0.76% | 88,946,996 | 13.4% |
[ 1.0% - 1.5% ] 1.26% | 82,185,511 | 12.8% |
[ 1.5% - 2.0% ] 1.74% | 64,567,179 | 12.4% |
[ 2.0% - 2.5% ] 2.23% | 57,244,479 | 12.0% |
[ 2.5% - 3.0% ] 2.75% | 35,005,324 | 11.9% |
[ 3.0% - 3.5% ] 3.24% | 26,618,622 | 11.5% |
[ 3.5% - 4.0% ] 3.76% | 18,314,239 | 12.2% |
[ 4.0% - 4.5% ] 4.24% | 14,262,877 | 12.1% |
[ 4.5% - 5.0% ] 4.74% | 11,075,184 | 12.1% |
[ 5.0% - 5.5% ] 5.21% | 11,859,194 | 11.8% |
[ 5.5% - 6.0% ] 5.75% | 9,061,267 | 11.9% |
[ 6.0% - 6.5% ] 6.23% | 7,004,755 | 12.0% |
[ 6.5% - 7.0% ] 6.74% | 6,392,418 | 12.3% |
[ 7.0% - 7.5% ] 7.21% | 5,126,161 | 12.4% |
[ 7.5% - 8.0% ] 7.74% | 3,772,309 | 12.2% |
[ 8.0% - 8.5% ] 8.23% | 4,674,643 | 11.7% |
[ 8.5% - 9.0% ] 8.75% | 3,702,708 | 12.2% |
[ 9.0% - 9.5% ] 9.24% | 3,044,676 | 12.0% |
[ 9.5% - 10.0% ] 9.75% | 2,490,332 | 11.9% |
[ 10.0% - 10.5% ] 10.22% | 1,921,530 | 11.6% |
[ 10.5% - 11.0% ] 10.76% | 2,037,334 | 12.8% |
[ 11.0% - 11.5% ] 11.25% | 1,909,266 | 12.0% |
[ 11.5% - 12.0% ] 11.72% | 1,648,048 | 12.0% |
[ 12.0% - 12.5% ] 12.21% | 1,485,305 | 12.3% |
[ 12.5% - 13.0% ] 12.77% | 1,293,429 | 13.3% |
[ 13.0% - 13.5% ] 13.23% | 1,280,185 | 12.0% |
[ 13.5% - 14.0% ] 13.77% | 758,081 | 12.2% |
[ 14.0% - 14.5% ] 14.23% | 1,042,546 | 11.8% |
[ 14.5% - 15.0% ] 14.72% | 645,996 | 13.2% |
[ 15.0% - 15.5% ] 15.27% | 740,308 | 12.1% |
[ 15.5% - 16.0% ] 15.73% | 747,770 | 12.4% |
[ 16.0% - 16.5% ] 16.29% | 834,526 | 11.5% |
[ 16.5% - 17.0% ] 16.74% | 357,300 | 12.7% |
[ 17.0% - 17.5% ] 17.22% | 363,488 | 11.8% |
[ 17.5% - 18.0% ] 17.72% | 399,675 | 12.3% |
[ 18.0% - 18.5% ] 18.25% | 354,650 | 13.3% |
[ 18.5% - 19.0% ] 18.78% | 356,857 | 12.3% |
[ 19.0% - 19.5% ] 19.19% | 174,057 | 11.0% |
[ 19.5% - 20.0% ] 19.77% | 176,946 | 14.8% |
[ 20.0% - 20.5% ] 20.26% | 207,786 | 9.4% |
[ 20.5% - 21.0% ] 20.69% | 55,623 | 15.4% |
[ 21.0% - 21.5% ] 21.24% | 83,672 | 17.9% |
[ 21.5% - 22.0% ] 21.79% | 64,400 | 9.6% |
[ 22.0% - 22.5% ] 22.15% | 145,427 | 13.0% |
[ 22.5% - 23.0% ] 22.72% | 165,805 | 13.9% |
[ 23.0% - 23.5% ] 23.26% | 105,167 | 13.4% |
[ 23.5% - 24.0% ] 23.67% | 40,068 | 12.5% |
[ 24.0% - 24.5% ] 24.22% | 135,953 | 12.2% |
[ 24.5% - 25.0% ] 24.76% | 71,979 | 9.7% |
[ 25.0% - 25.5% ] 25.23% | 117,332 | 12.0% |
[ 25.5% - 26.0% ] 25.68% | 19,673 | 12.5% |
[ 26.0% - 26.5% ] 26.16% | 117,138 | 12.2% |
[ 26.5% - 27.0% ] 26.88% | 39,861 | 17.1% |
[ 27.0% - 27.5% ] 27.20% | 16,696 | 14.8% |
[ 27.5% - 28.0% ] 27.70% | 40,721 | 11.0% |
[ 28.0% - 28.5% ] 28.19% | 12,725 | 20.7% |
[ 28.5% - 29.0% ] 28.76% | 73,969 | 10.8% |
[ 29.0% - 29.5% ] 29.20% | 10,643 | 18.8% |
[ 29.5% - 30.0% ] 29.64% | 9,498 | 13.3% |
[ 30.0% - 30.5% ] 30.32% | 30,997 | 17.9% |
[ 30.5% - 31.0% ] 30.74% | 14,761 | 10.1% |
[ 31.0% - 31.5% ] 31.28% | 83,955 | 13.2% |
[ 31.5% - 32.0% ] 31.58% | 36,002 | 12.6% |
[ 32.0% - 32.5% ] 32.28% | 31,457 | 17.1% |
[ 32.5% - 33.0% ] 32.65% | 23,370 | 15.2% |
[ 33.0% - 33.5% ] 33.35% | 4,162 | 14.2% |
[ 33.5% - 34.0% ] 33.81% | 2,023 | 14.3% |
[ 34.0% - 34.5% ] 34.22% | 9,931 | 10.8% |
[ 34.5% - 35.0% ] 34.77% | 604 | 14.1% |
[ 35.0% - 35.5% ] 35.16% | 1,169 | 14.8% |
[ 35.5% - 36.0% ] 35.80% | 704 | 21.9% |
[ 36.0% - 36.5% ] 36.07% | 1,952 | 18.4% |
[ 36.5% - 37.0% ] 36.67% | 180 | 15.6% |
[ 37.0% - 37.5% ] 37.12% | 23,746 | 10.9% |
[ 37.5% - 38.0% ] 37.62% | 2,116 | 15.2% |
[ 38.5% - 39.0% ] 38.55% | 1,603 | 10.1% |
[ 39.0% - 39.5% ] 39.37% | 668 | 10.2% |
[ 39.5% - 40.0% ] 39.65% | 2,507 | 27.3% |
[ 40.0% - 40.5% ] 40.16% | 1,016 | 39.6% |
[ 40.5% - 41.0% ] 40.86% | 1,263 | 17.3% |
[ 41.0% - 41.5% ] 41.21% | 182 | 50.0% |
[ 41.5% - 42.0% ] 41.84% | 380 | 15.5% |
[ 42.0% - 42.5% ] 42.07% | 3,076 | 10.4% |
[ 42.5% - 43.0% ] 42.59% | 108 | 16.7% |
[ 43.0% - 43.5% ] 43.36% | 1,137 | 10.6% |
[ 43.5% - 44.0% ] 43.67% | 245 | 5.7% |
[ 44.5% - 45.0% ] 44.68% | 1,128 | 23.7% |
[ 45.0% - 45.5% ] 45.24% | 336 | 17.9% |
[ 45.5% - 46.0% ] 45.90% | 2,525 | 10.5% |
[ 46.0% - 46.5% ] 46.15% | 91 | 13.2% |
[ 46.5% - 47.0% ] 46.73% | 413 | 18.9% |
[ 47.0% - 47.5% ] 47.24% | 3,497 | 18.2% |
[ 48.0% - 48.5% ] 48.39% | 31 | 48.4% |
[ 48.5% - 49.0% ] 48.78% | 41 | 29.3% |
[ 49.0% - 49.5% ] 49.11% | 1,908 | 13.2% |
[ 50.0% - 50.5% ] 50.14% | 2,140 | 5.3% |
[ 51.0% - 51.5% ] 51.31% | 1,183 | 10.1% |
[ 51.5% - 52.0% ] 51.59% | 283 | 13.8% |
[ 52.0% - 52.5% ] 52.27% | 44 | 40.9% |
[ 53.0% - 53.5% ] 53.08% | 130 | 10.0% |
[ 53.5% - 54.0% ] 53.81% | 433 | 16.6% |
[ 54.5% - 55.0% ] 54.74% | 190 | 16.3% |
[ 55.0% - 55.5% ] 55.19% | 183 | 9.3% |
[ 55.5% - 56.0% ] 55.81% | 568 | 17.8% |
[ 57.5% - 58.0% ] 57.88% | 387 | 9.6% |
[ 60.0% - 60.5% ] 60.31% | 446 | 63.9% |
[ 61.0% - 61.5% ] 61.42% | 324 | 17.3% |
[ 63.0% - 63.5% ] 63.10% | 84 | 36.9% |
[ 69.0% - 69.5% ] 69.48% | 154 | 17.5% |
[ 74.5% - 75.0% ] 74.69% | 573 | 19.0% |
[ 75.0% - 75.5% ] 75.22% | 226 | 21.7% |
[ 75.5% - 76.0% ] 75.75% | 268 | 5.6% |
[ 78.0% - 78.5% ] 78.26% | 46 | 8.7% |
[ 80.0% - 80.5% ] 80.00% | 80 | 17.5% |
[ 87.5% - 88.0% ] 87.76% | 237 | 49.8% |