Polish Self-Care Disability
COMPARE
Polish
Select to Compare
Self-Care Disability
Polish Self-Care Disability
2.4%
SELF-CARE DISABILITY
88.9/ 100
METRIC RATING
131st/ 347
METRIC RANK
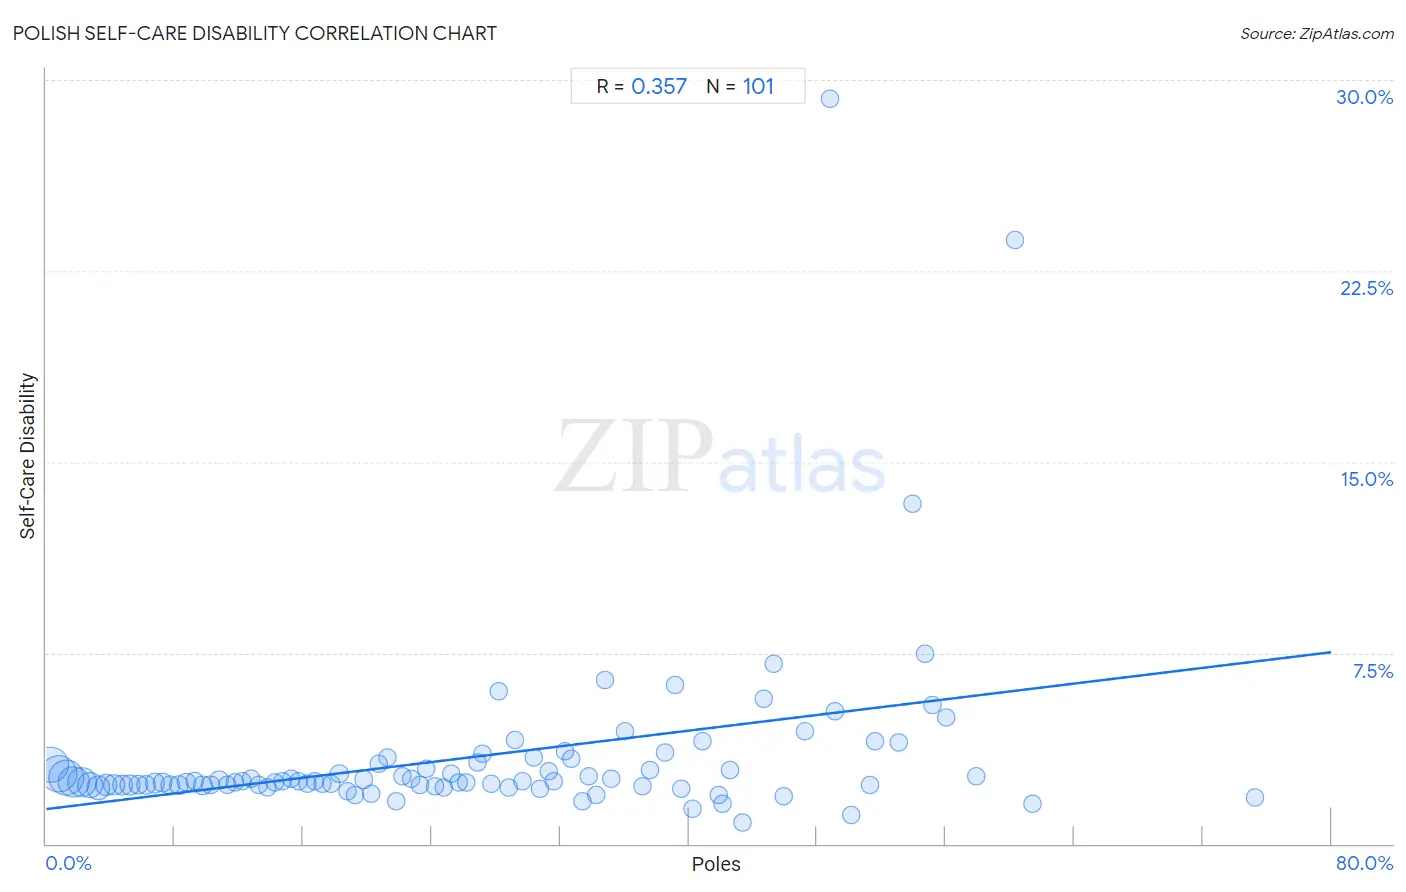
Polish Self-Care Disability Correlation Chart
The statistical analysis conducted on geographies consisting of 558,400,698 people shows a mild positive correlation between the proportion of Poles and percentage of population with self-care disability in the United States with a correlation coefficient (R) of 0.357 and weighted average of 2.4%. On average, for every 1% (one percent) increase in Poles within a typical geography, there is an increase of 0.077% in percentage of population with self-care disability.
It is essential to understand that the correlation between the percentage of Poles and percentage of population with self-care disability does not imply a direct cause-and-effect relationship. It remains uncertain whether the presence of Poles influences an upward or downward trend in the level of percentage of population with self-care disability within an area, or if Poles simply ended up residing in those areas with higher or lower levels of percentage of population with self-care disability due to other factors.
Demographics Similar to Poles by Self-Care Disability
In terms of self-care disability, the demographic groups most similar to Poles are Immigrants from South America (2.4%, a difference of 0.010%), Immigrants from Austria (2.4%, a difference of 0.020%), Immigrants from Colombia (2.4%, a difference of 0.040%), Immigrants from Romania (2.4%, a difference of 0.050%), and Russian (2.4%, a difference of 0.080%).
| Demographics | Rating | Rank | Self-Care Disability |
| Immigrants from North America | 90.2 /100 | #124 | Exceptional 2.4% |
| Immigrants from Morocco | 90.2 /100 | #124 | Exceptional 2.4% |
| Hmong | 89.9 /100 | #126 | Excellent 2.4% |
| Colombians | 89.7 /100 | #127 | Excellent 2.4% |
| Immigrants from Hungary | 89.6 /100 | #128 | Excellent 2.4% |
| Immigrants from Romania | 89.3 /100 | #129 | Excellent 2.4% |
| Immigrants from Austria | 89.0 /100 | #130 | Excellent 2.4% |
| Poles | 88.9 /100 | #131 | Excellent 2.4% |
| Immigrants from South America | 88.8 /100 | #132 | Excellent 2.4% |
| Immigrants from Colombia | 88.5 /100 | #133 | Excellent 2.4% |
| Russians | 88.2 /100 | #134 | Excellent 2.4% |
| Laotians | 87.8 /100 | #135 | Excellent 2.4% |
| South American Indians | 87.2 /100 | #136 | Excellent 2.4% |
| Austrians | 87.0 /100 | #137 | Excellent 2.4% |
| Immigrants from Croatia | 86.6 /100 | #138 | Excellent 2.4% |
Polish Self-Care Disability Correlation Summary
| Measurement | Polish Data | Self-Care Disability Data |
| Minimum | 0.26% | 0.81% |
| Maximum | 75.2% | 29.3% |
| Range | 75.0% | 28.5% |
| Mean | 26.7% | 3.4% |
| Median | 25.2% | 2.4% |
| Interquartile 25% (IQ1) | 12.5% | 2.3% |
| Interquartile 75% (IQ3) | 39.4% | 3.2% |
| Interquartile Range (IQR) | 26.9% | 0.88% |
| Standard Deviation (Sample) | 17.1% | 3.7% |
| Standard Deviation (Population) | 17.0% | 3.7% |
Correlation Details
| Polish Percentile | Sample Size | Self-Care Disability |
[ 0.0% - 0.5% ] 0.26% | 84,589,387 | 3.1% |
[ 0.5% - 1.0% ] 0.76% | 88,724,988 | 2.7% |
[ 1.0% - 1.5% ] 1.26% | 81,969,598 | 2.6% |
[ 1.5% - 2.0% ] 1.74% | 64,331,088 | 2.4% |
[ 2.0% - 2.5% ] 2.23% | 57,101,916 | 2.4% |
[ 2.5% - 3.0% ] 2.75% | 34,867,240 | 2.3% |
[ 3.0% - 3.5% ] 3.24% | 26,491,162 | 2.2% |
[ 3.5% - 4.0% ] 3.76% | 18,206,446 | 2.3% |
[ 4.0% - 4.5% ] 4.24% | 14,183,578 | 2.3% |
[ 4.5% - 5.0% ] 4.74% | 11,009,170 | 2.3% |
[ 5.0% - 5.5% ] 5.21% | 11,788,360 | 2.3% |
[ 5.5% - 6.0% ] 5.75% | 9,005,124 | 2.3% |
[ 6.0% - 6.5% ] 6.23% | 6,926,194 | 2.3% |
[ 6.5% - 7.0% ] 6.74% | 6,337,404 | 2.4% |
[ 7.0% - 7.5% ] 7.21% | 5,089,364 | 2.4% |
[ 7.5% - 8.0% ] 7.74% | 3,744,292 | 2.3% |
[ 8.0% - 8.5% ] 8.23% | 4,644,912 | 2.3% |
[ 8.5% - 9.0% ] 8.75% | 3,691,842 | 2.4% |
[ 9.0% - 9.5% ] 9.24% | 3,030,994 | 2.5% |
[ 9.5% - 10.0% ] 9.75% | 2,469,829 | 2.3% |
[ 10.0% - 10.5% ] 10.22% | 1,913,322 | 2.3% |
[ 10.5% - 11.0% ] 10.76% | 2,027,975 | 2.5% |
[ 11.0% - 11.5% ] 11.25% | 1,896,388 | 2.3% |
[ 11.5% - 12.0% ] 11.72% | 1,637,483 | 2.4% |
[ 12.0% - 12.5% ] 12.21% | 1,473,344 | 2.4% |
[ 12.5% - 13.0% ] 12.77% | 1,282,354 | 2.6% |
[ 13.0% - 13.5% ] 13.23% | 1,272,341 | 2.3% |
[ 13.5% - 14.0% ] 13.77% | 754,472 | 2.2% |
[ 14.0% - 14.5% ] 14.23% | 1,033,691 | 2.4% |
[ 14.5% - 15.0% ] 14.72% | 641,755 | 2.5% |
[ 15.0% - 15.5% ] 15.27% | 738,426 | 2.6% |
[ 15.5% - 16.0% ] 15.73% | 737,839 | 2.5% |
[ 16.0% - 16.5% ] 16.29% | 832,870 | 2.4% |
[ 16.5% - 17.0% ] 16.74% | 352,330 | 2.4% |
[ 17.0% - 17.5% ] 17.22% | 360,087 | 2.4% |
[ 17.5% - 18.0% ] 17.72% | 397,271 | 2.4% |
[ 18.0% - 18.5% ] 18.25% | 353,240 | 2.8% |
[ 18.5% - 19.0% ] 18.78% | 353,953 | 2.1% |
[ 19.0% - 19.5% ] 19.19% | 172,552 | 1.9% |
[ 19.5% - 20.0% ] 19.77% | 175,573 | 2.5% |
[ 20.0% - 20.5% ] 20.27% | 202,717 | 2.0% |
[ 20.5% - 21.0% ] 20.69% | 52,974 | 3.2% |
[ 21.0% - 21.5% ] 21.24% | 82,170 | 3.4% |
[ 21.5% - 22.0% ] 21.79% | 61,847 | 1.7% |
[ 22.0% - 22.5% ] 22.15% | 142,356 | 2.6% |
[ 22.5% - 23.0% ] 22.72% | 164,850 | 2.5% |
[ 23.0% - 23.5% ] 23.25% | 104,280 | 2.3% |
[ 23.5% - 24.0% ] 23.67% | 39,012 | 3.0% |
[ 24.0% - 24.5% ] 24.22% | 134,562 | 2.3% |
[ 24.5% - 25.0% ] 24.76% | 71,404 | 2.2% |
[ 25.0% - 25.5% ] 25.23% | 116,737 | 2.7% |
[ 25.5% - 26.0% ] 25.68% | 19,128 | 2.4% |
[ 26.0% - 26.5% ] 26.16% | 116,427 | 2.4% |
[ 26.5% - 27.0% ] 26.88% | 39,045 | 3.2% |
[ 27.0% - 27.5% ] 27.20% | 16,466 | 3.5% |
[ 27.5% - 28.0% ] 27.70% | 39,474 | 2.4% |
[ 28.0% - 28.5% ] 28.19% | 12,725 | 6.0% |
[ 28.5% - 29.0% ] 28.76% | 72,699 | 2.2% |
[ 29.0% - 29.5% ] 29.20% | 9,932 | 4.1% |
[ 29.5% - 30.0% ] 29.63% | 8,526 | 2.5% |
[ 30.0% - 30.5% ] 30.32% | 30,084 | 3.4% |
[ 30.5% - 31.0% ] 30.73% | 14,479 | 2.2% |
[ 31.0% - 31.5% ] 31.28% | 81,837 | 2.9% |
[ 31.5% - 32.0% ] 31.58% | 35,802 | 2.5% |
[ 32.0% - 32.5% ] 32.28% | 31,420 | 3.6% |
[ 32.5% - 33.0% ] 32.65% | 23,024 | 3.4% |
[ 33.0% - 33.5% ] 33.36% | 3,909 | 1.7% |
[ 33.5% - 34.0% ] 33.81% | 1,739 | 2.7% |
[ 34.0% - 34.5% ] 34.21% | 8,799 | 1.9% |
[ 34.5% - 35.0% ] 34.77% | 604 | 6.4% |
[ 35.0% - 35.5% ] 35.16% | 1,169 | 2.6% |
[ 36.0% - 36.5% ] 36.07% | 1,952 | 4.4% |
[ 37.0% - 37.5% ] 37.12% | 23,676 | 2.3% |
[ 37.5% - 38.0% ] 37.62% | 2,116 | 2.9% |
[ 38.5% - 39.0% ] 38.55% | 1,603 | 3.6% |
[ 39.0% - 39.5% ] 39.17% | 120 | 6.2% |
[ 39.5% - 40.0% ] 39.56% | 1,241 | 2.2% |
[ 40.0% - 40.5% ] 40.22% | 358 | 1.4% |
[ 40.5% - 41.0% ] 40.86% | 1,182 | 4.0% |
[ 41.5% - 42.0% ] 41.84% | 380 | 1.9% |
[ 42.0% - 42.5% ] 42.06% | 2,936 | 1.6% |
[ 42.5% - 43.0% ] 42.59% | 108 | 2.9% |
[ 43.0% - 43.5% ] 43.37% | 913 | 0.81% |
[ 44.5% - 45.0% ] 44.68% | 940 | 5.7% |
[ 45.0% - 45.5% ] 45.31% | 192 | 7.1% |
[ 45.5% - 46.0% ] 45.90% | 2,525 | 1.9% |
[ 47.0% - 47.5% ] 47.24% | 3,497 | 4.4% |
[ 48.5% - 49.0% ] 48.78% | 41 | 29.3% |
[ 49.0% - 49.5% ] 49.14% | 871 | 5.2% |
[ 50.0% - 50.5% ] 50.14% | 2,140 | 1.1% |
[ 51.0% - 51.5% ] 51.31% | 1,183 | 2.3% |
[ 51.5% - 52.0% ] 51.56% | 256 | 4.0% |
[ 53.0% - 53.5% ] 53.08% | 130 | 4.0% |
[ 53.5% - 54.0% ] 53.90% | 295 | 13.4% |
[ 54.5% - 55.0% ] 54.74% | 190 | 7.5% |
[ 55.0% - 55.5% ] 55.19% | 183 | 5.5% |
[ 56.0% - 56.5% ] 56.00% | 125 | 5.0% |
[ 57.5% - 58.0% ] 57.88% | 387 | 2.6% |
[ 60.0% - 60.5% ] 60.31% | 257 | 23.7% |
[ 61.0% - 61.5% ] 61.42% | 324 | 1.6% |
[ 75.0% - 75.5% ] 75.22% | 226 | 1.8% |