Polish Female Disability
COMPARE
Polish
Select to Compare
Female Disability
Polish Female Disability
12.5%
DISABILITY | FEMALES
8.4/ 100
METRIC RATING
225th/ 347
METRIC RANK
Polish Female Disability Correlation Chart
The statistical analysis conducted on geographies consisting of 560,308,086 people shows a mild positive correlation between the proportion of Poles and percentage of females with a disability in the United States with a correlation coefficient (R) of 0.317 and weighted average of 12.5%. On average, for every 1% (one percent) increase in Poles within a typical geography, there is an increase of 0.16% in percentage of females with a disability.
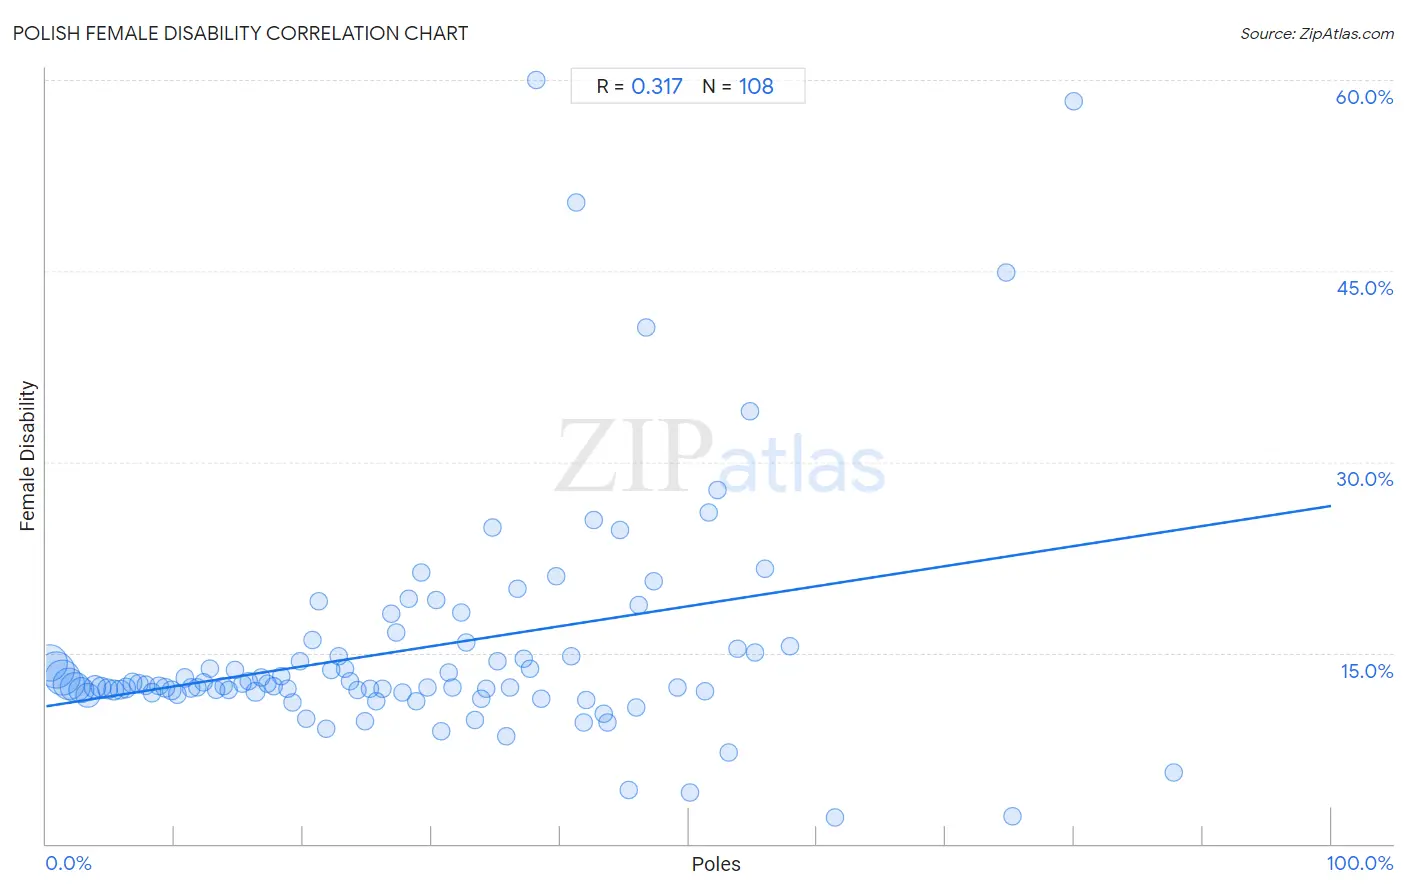
It is essential to understand that the correlation between the percentage of Poles and percentage of females with a disability does not imply a direct cause-and-effect relationship. It remains uncertain whether the presence of Poles influences an upward or downward trend in the level of percentage of females with a disability within an area, or if Poles simply ended up residing in those areas with higher or lower levels of percentage of females with a disability due to other factors.
Demographics Similar to Poles by Female Disability
In terms of female disability, the demographic groups most similar to Poles are Hispanic or Latino (12.5%, a difference of 0.050%), Assyrian/Chaldean/Syriac (12.5%, a difference of 0.060%), Immigrants from Cambodia (12.5%, a difference of 0.080%), Belizean (12.5%, a difference of 0.10%), and Guamanian/Chamorro (12.5%, a difference of 0.12%).
| Demographics | Rating | Rank | Female Disability |
| Immigrants from Bahamas | 12.5 /100 | #218 | Poor 12.4% |
| Europeans | 12.1 /100 | #219 | Poor 12.4% |
| Bahamians | 11.1 /100 | #220 | Poor 12.4% |
| Native Hawaiians | 10.8 /100 | #221 | Poor 12.4% |
| Italians | 10.7 /100 | #222 | Poor 12.4% |
| Guamanians/Chamorros | 9.5 /100 | #223 | Tragic 12.5% |
| Belizeans | 9.3 /100 | #224 | Tragic 12.5% |
| Poles | 8.4 /100 | #225 | Tragic 12.5% |
| Hispanics or Latinos | 8.0 /100 | #226 | Tragic 12.5% |
| Assyrians/Chaldeans/Syriacs | 8.0 /100 | #227 | Tragic 12.5% |
| Immigrants from Cambodia | 7.8 /100 | #228 | Tragic 12.5% |
| Hungarians | 7.2 /100 | #229 | Tragic 12.5% |
| Immigrants from Belize | 7.0 /100 | #230 | Tragic 12.5% |
| Belgians | 6.5 /100 | #231 | Tragic 12.5% |
| Immigrants from Somalia | 5.9 /100 | #232 | Tragic 12.5% |
Polish Female Disability Correlation Summary
| Measurement | Polish Data | Female Disability Data |
| Minimum | 0.26% | 2.1% |
| Maximum | 87.8% | 60.0% |
| Range | 87.5% | 57.9% |
| Mean | 28.7% | 15.3% |
| Median | 27.0% | 12.4% |
| Interquartile 25% (IQ1) | 13.5% | 11.9% |
| Interquartile 75% (IQ3) | 41.5% | 15.2% |
| Interquartile Range (IQR) | 28.0% | 3.2% |
| Standard Deviation (Sample) | 18.8% | 9.3% |
| Standard Deviation (Population) | 18.7% | 9.3% |
Correlation Details
| Polish Percentile | Sample Size | Female Disability |
[ 0.0% - 0.5% ] 0.26% | 84,745,347 | 14.2% |
[ 0.5% - 1.0% ] 0.76% | 88,926,039 | 13.6% |
[ 1.0% - 1.5% ] 1.26% | 82,173,930 | 13.1% |
[ 1.5% - 2.0% ] 1.74% | 64,549,048 | 12.6% |
[ 2.0% - 2.5% ] 2.23% | 57,234,256 | 12.3% |
[ 2.5% - 3.0% ] 2.75% | 34,999,876 | 12.1% |
[ 3.0% - 3.5% ] 3.24% | 26,610,132 | 11.7% |
[ 3.5% - 4.0% ] 3.76% | 18,312,461 | 12.3% |
[ 4.0% - 4.5% ] 4.24% | 14,255,352 | 12.3% |
[ 4.5% - 5.0% ] 4.74% | 11,073,320 | 12.2% |
[ 5.0% - 5.5% ] 5.21% | 11,855,143 | 12.1% |
[ 5.5% - 6.0% ] 5.75% | 9,056,863 | 12.1% |
[ 6.0% - 6.5% ] 6.23% | 6,997,525 | 12.2% |
[ 6.5% - 7.0% ] 6.74% | 6,390,000 | 12.6% |
[ 7.0% - 7.5% ] 7.21% | 5,125,043 | 12.5% |
[ 7.5% - 8.0% ] 7.74% | 3,771,192 | 12.5% |
[ 8.0% - 8.5% ] 8.23% | 4,673,754 | 11.9% |
[ 8.5% - 9.0% ] 8.75% | 3,698,867 | 12.4% |
[ 9.0% - 9.5% ] 9.24% | 3,042,276 | 12.2% |
[ 9.5% - 10.0% ] 9.75% | 2,488,139 | 12.1% |
[ 10.0% - 10.5% ] 10.22% | 1,918,120 | 11.8% |
[ 10.5% - 11.0% ] 10.76% | 2,036,964 | 13.0% |
[ 11.0% - 11.5% ] 11.25% | 1,908,246 | 12.2% |
[ 11.5% - 12.0% ] 11.72% | 1,646,271 | 12.3% |
[ 12.0% - 12.5% ] 12.21% | 1,484,362 | 12.7% |
[ 12.5% - 13.0% ] 12.77% | 1,290,909 | 13.8% |
[ 13.0% - 13.5% ] 13.23% | 1,279,046 | 12.1% |
[ 13.5% - 14.0% ] 13.77% | 757,234 | 12.4% |
[ 14.0% - 14.5% ] 14.23% | 1,041,662 | 12.1% |
[ 14.5% - 15.0% ] 14.72% | 645,949 | 13.7% |
[ 15.0% - 15.5% ] 15.27% | 740,129 | 12.5% |
[ 15.5% - 16.0% ] 15.73% | 747,623 | 12.7% |
[ 16.0% - 16.5% ] 16.29% | 834,262 | 11.9% |
[ 16.5% - 17.0% ] 16.74% | 356,335 | 13.1% |
[ 17.0% - 17.5% ] 17.22% | 363,267 | 12.6% |
[ 17.5% - 18.0% ] 17.72% | 397,696 | 12.4% |
[ 18.0% - 18.5% ] 18.25% | 353,721 | 13.1% |
[ 18.5% - 19.0% ] 18.78% | 356,415 | 12.2% |
[ 19.0% - 19.5% ] 19.19% | 173,046 | 11.1% |
[ 19.5% - 20.0% ] 19.77% | 175,724 | 14.4% |
[ 20.0% - 20.5% ] 20.26% | 207,020 | 9.8% |
[ 20.5% - 21.0% ] 20.69% | 55,052 | 16.0% |
[ 21.0% - 21.5% ] 21.24% | 82,968 | 19.0% |
[ 21.5% - 22.0% ] 21.79% | 64,289 | 9.0% |
[ 22.0% - 22.5% ] 22.15% | 145,220 | 13.7% |
[ 22.5% - 23.0% ] 22.72% | 165,805 | 14.7% |
[ 23.0% - 23.5% ] 23.26% | 105,167 | 13.8% |
[ 23.5% - 24.0% ] 23.67% | 39,938 | 12.7% |
[ 24.0% - 24.5% ] 24.22% | 135,953 | 12.1% |
[ 24.5% - 25.0% ] 24.76% | 71,717 | 9.6% |
[ 25.0% - 25.5% ] 25.23% | 117,332 | 12.2% |
[ 25.5% - 26.0% ] 25.69% | 19,544 | 11.2% |
[ 26.0% - 26.5% ] 26.16% | 117,138 | 12.1% |
[ 26.5% - 27.0% ] 26.88% | 39,809 | 18.1% |
[ 27.0% - 27.5% ] 27.20% | 16,696 | 16.6% |
[ 27.5% - 28.0% ] 27.70% | 40,721 | 11.9% |
[ 28.0% - 28.5% ] 28.19% | 12,725 | 19.2% |
[ 28.5% - 29.0% ] 28.76% | 73,819 | 11.2% |
[ 29.0% - 29.5% ] 29.20% | 10,643 | 21.3% |
[ 29.5% - 30.0% ] 29.64% | 9,384 | 12.3% |
[ 30.0% - 30.5% ] 30.32% | 30,724 | 19.2% |
[ 30.5% - 31.0% ] 30.74% | 14,686 | 8.8% |
[ 31.0% - 31.5% ] 31.28% | 83,955 | 13.5% |
[ 31.5% - 32.0% ] 31.58% | 36,002 | 12.3% |
[ 32.0% - 32.5% ] 32.28% | 31,420 | 18.2% |
[ 32.5% - 33.0% ] 32.65% | 23,370 | 15.8% |
[ 33.0% - 33.5% ] 33.35% | 4,156 | 9.7% |
[ 33.5% - 34.0% ] 33.81% | 2,023 | 11.4% |
[ 34.0% - 34.5% ] 34.21% | 9,235 | 12.2% |
[ 34.5% - 35.0% ] 34.77% | 604 | 24.9% |
[ 35.0% - 35.5% ] 35.16% | 1,169 | 14.3% |
[ 35.5% - 36.0% ] 35.82% | 564 | 8.4% |
[ 36.0% - 36.5% ] 36.07% | 1,952 | 12.3% |
[ 36.5% - 37.0% ] 36.67% | 150 | 20.1% |
[ 37.0% - 37.5% ] 37.12% | 23,676 | 14.5% |
[ 37.5% - 38.0% ] 37.62% | 2,116 | 13.7% |
[ 38.0% - 38.5% ] 38.10% | 63 | 60.0% |
[ 38.5% - 39.0% ] 38.55% | 1,603 | 11.4% |
[ 39.5% - 40.0% ] 39.65% | 2,507 | 21.0% |
[ 40.5% - 41.0% ] 40.86% | 1,263 | 14.7% |
[ 41.0% - 41.5% ] 41.21% | 182 | 50.3% |
[ 41.5% - 42.0% ] 41.84% | 380 | 9.5% |
[ 42.0% - 42.5% ] 42.07% | 3,007 | 11.2% |
[ 42.5% - 43.0% ] 42.59% | 108 | 25.4% |
[ 43.0% - 43.5% ] 43.36% | 1,137 | 10.3% |
[ 43.5% - 44.0% ] 43.67% | 245 | 9.5% |
[ 44.5% - 45.0% ] 44.70% | 1,018 | 24.7% |
[ 45.0% - 45.5% ] 45.31% | 192 | 4.2% |
[ 45.5% - 46.0% ] 45.90% | 2,525 | 10.7% |
[ 46.0% - 46.5% ] 46.15% | 91 | 18.8% |
[ 46.5% - 47.0% ] 46.69% | 332 | 40.6% |
[ 47.0% - 47.5% ] 47.24% | 3,497 | 20.6% |
[ 49.0% - 49.5% ] 49.15% | 1,060 | 12.3% |
[ 50.0% - 50.5% ] 50.14% | 2,140 | 4.0% |
[ 51.0% - 51.5% ] 51.31% | 1,183 | 12.0% |
[ 51.5% - 52.0% ] 51.59% | 283 | 26.1% |
[ 52.0% - 52.5% ] 52.27% | 44 | 27.8% |
[ 53.0% - 53.5% ] 53.08% | 130 | 7.1% |
[ 53.5% - 54.0% ] 53.81% | 433 | 15.4% |
[ 54.5% - 55.0% ] 54.74% | 190 | 34.0% |
[ 55.0% - 55.5% ] 55.19% | 183 | 15.0% |
[ 55.5% - 56.0% ] 55.93% | 177 | 21.6% |
[ 57.5% - 58.0% ] 57.88% | 387 | 15.6% |
[ 61.0% - 61.5% ] 61.42% | 324 | 2.1% |
[ 74.5% - 75.0% ] 74.69% | 573 | 44.9% |
[ 75.0% - 75.5% ] 75.22% | 226 | 2.1% |
[ 80.0% - 80.5% ] 80.00% | 80 | 58.3% |
[ 87.5% - 88.0% ] 87.76% | 237 | 5.6% |