Polish Disability Age Under 5
COMPARE
Polish
Select to Compare
Disability Age Under 5
Polish Disability Age Under 5
1.6%
DISABILITY | AGE UNDER 5
0.0/ 100
METRIC RATING
296th/ 347
METRIC RANK
Polish Disability Age Under 5 Correlation Chart
The statistical analysis conducted on geographies consisting of 257,764,935 people shows a significant positive correlation between the proportion of Poles and percentage of population with a disability under the age of 5 in the United States with a correlation coefficient (R) of 0.621 and weighted average of 1.6%. On average, for every 1% (one percent) increase in Poles within a typical geography, there is an increase of 0.27% in percentage of population with a disability under the age of 5.
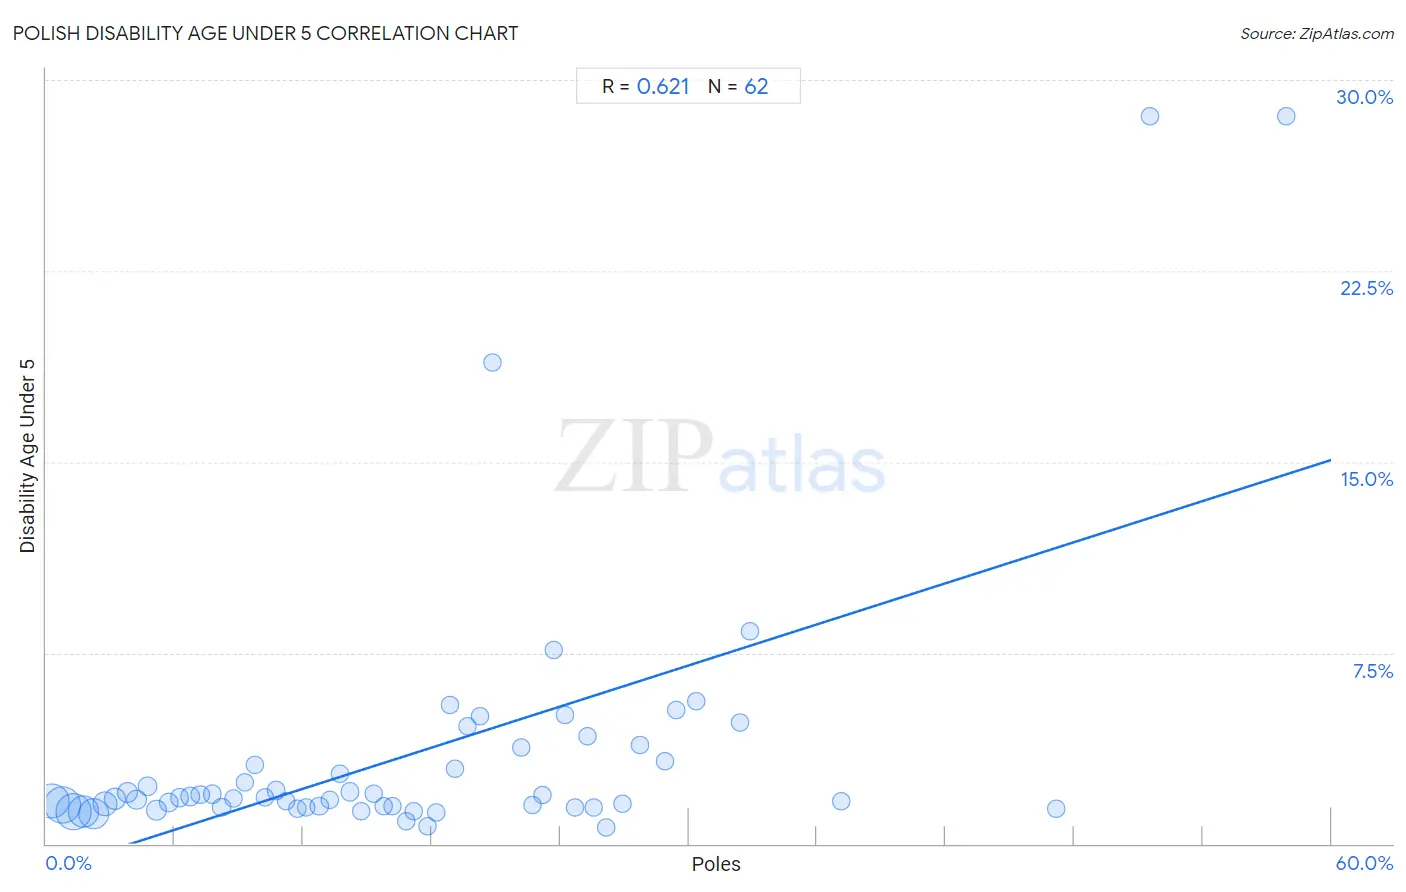
It is essential to understand that the correlation between the percentage of Poles and percentage of population with a disability under the age of 5 does not imply a direct cause-and-effect relationship. It remains uncertain whether the presence of Poles influences an upward or downward trend in the level of percentage of population with a disability under the age of 5 within an area, or if Poles simply ended up residing in those areas with higher or lower levels of percentage of population with a disability under the age of 5 due to other factors.
Demographics Similar to Poles by Disability Age Under 5
In terms of disability age under 5, the demographic groups most similar to Poles are Finnish (1.6%, a difference of 0.080%), Swedish (1.6%, a difference of 0.71%), Nonimmigrants (1.6%, a difference of 0.96%), Cajun (1.6%, a difference of 0.96%), and Portuguese (1.6%, a difference of 1.5%).
| Demographics | Rating | Rank | Disability Age Under 5 |
| Hungarians | 0.0 /100 | #289 | Tragic 1.5% |
| Czechs | 0.0 /100 | #290 | Tragic 1.5% |
| Northern Europeans | 0.0 /100 | #291 | Tragic 1.6% |
| Italians | 0.0 /100 | #292 | Tragic 1.6% |
| Lithuanians | 0.0 /100 | #293 | Tragic 1.6% |
| Swedes | 0.0 /100 | #294 | Tragic 1.6% |
| Finns | 0.0 /100 | #295 | Tragic 1.6% |
| Poles | 0.0 /100 | #296 | Tragic 1.6% |
| Nonimmigrants | 0.0 /100 | #297 | Tragic 1.6% |
| Cajuns | 0.0 /100 | #298 | Tragic 1.6% |
| Portuguese | 0.0 /100 | #299 | Tragic 1.6% |
| Shoshone | 0.0 /100 | #300 | Tragic 1.6% |
| German Russians | 0.0 /100 | #301 | Tragic 1.6% |
| Welsh | 0.0 /100 | #302 | Tragic 1.6% |
| Swiss | 0.0 /100 | #303 | Tragic 1.6% |
Polish Disability Age Under 5 Correlation Summary
| Measurement | Polish Data | Disability Age Under 5 Data |
| Minimum | 0.26% | 0.65% |
| Maximum | 57.9% | 28.6% |
| Range | 57.6% | 27.9% |
| Mean | 17.1% | 3.5% |
| Median | 15.5% | 1.8% |
| Interquartile 25% (IQ1) | 7.7% | 1.4% |
| Interquartile 75% (IQ3) | 24.2% | 3.2% |
| Interquartile Range (IQR) | 16.5% | 1.8% |
| Standard Deviation (Sample) | 12.3% | 5.3% |
| Standard Deviation (Population) | 12.2% | 5.3% |
Correlation Details
| Polish Percentile | Sample Size | Disability Age Under 5 |
[ 0.0% - 0.5% ] 0.26% | 41,495,376 | 1.7% |
[ 0.5% - 1.0% ] 0.76% | 46,279,805 | 1.5% |
[ 1.0% - 1.5% ] 1.28% | 44,103,995 | 1.3% |
[ 1.5% - 2.0% ] 1.75% | 32,351,868 | 1.3% |
[ 2.0% - 2.5% ] 2.22% | 30,970,485 | 1.2% |
[ 2.5% - 3.0% ] 2.75% | 15,156,414 | 1.6% |
[ 3.0% - 3.5% ] 3.24% | 9,158,107 | 1.8% |
[ 3.5% - 4.0% ] 3.78% | 6,044,691 | 2.0% |
[ 4.0% - 4.5% ] 4.22% | 4,506,032 | 1.7% |
[ 4.5% - 5.0% ] 4.72% | 2,926,018 | 2.2% |
[ 5.0% - 5.5% ] 5.15% | 5,157,613 | 1.3% |
[ 5.5% - 6.0% ] 5.74% | 3,016,663 | 1.6% |
[ 6.0% - 6.5% ] 6.22% | 2,310,877 | 1.8% |
[ 6.5% - 7.0% ] 6.73% | 1,833,817 | 1.9% |
[ 7.0% - 7.5% ] 7.19% | 1,730,497 | 1.9% |
[ 7.5% - 8.0% ] 7.74% | 1,045,029 | 1.9% |
[ 8.0% - 8.5% ] 8.19% | 1,178,693 | 1.4% |
[ 8.5% - 9.0% ] 8.74% | 1,360,366 | 1.8% |
[ 9.0% - 9.5% ] 9.28% | 788,996 | 2.4% |
[ 9.5% - 10.0% ] 9.76% | 559,183 | 3.1% |
[ 10.0% - 10.5% ] 10.21% | 549,715 | 1.8% |
[ 10.5% - 11.0% ] 10.74% | 702,242 | 2.1% |
[ 11.0% - 11.5% ] 11.22% | 476,063 | 1.7% |
[ 11.5% - 12.0% ] 11.73% | 501,865 | 1.4% |
[ 12.0% - 12.5% ] 12.16% | 458,117 | 1.4% |
[ 12.5% - 13.0% ] 12.75% | 459,048 | 1.5% |
[ 13.0% - 13.5% ] 13.25% | 638,212 | 1.7% |
[ 13.5% - 14.0% ] 13.74% | 181,497 | 2.7% |
[ 14.0% - 14.5% ] 14.20% | 298,980 | 2.0% |
[ 14.5% - 15.0% ] 14.72% | 204,913 | 1.3% |
[ 15.0% - 15.5% ] 15.30% | 240,382 | 2.0% |
[ 15.5% - 16.0% ] 15.76% | 219,381 | 1.5% |
[ 16.0% - 16.5% ] 16.16% | 157,459 | 1.5% |
[ 16.5% - 17.0% ] 16.81% | 64,472 | 0.89% |
[ 17.0% - 17.5% ] 17.15% | 83,575 | 1.3% |
[ 17.5% - 18.0% ] 17.78% | 49,657 | 0.69% |
[ 18.0% - 18.5% ] 18.19% | 69,663 | 1.2% |
[ 18.5% - 19.0% ] 18.83% | 30,845 | 5.4% |
[ 19.0% - 19.5% ] 19.11% | 37,398 | 2.9% |
[ 19.5% - 20.0% ] 19.68% | 17,680 | 4.6% |
[ 20.0% - 20.5% ] 20.25% | 28,426 | 5.0% |
[ 20.5% - 21.0% ] 20.83% | 677 | 18.9% |
[ 22.0% - 22.5% ] 22.20% | 9,399 | 3.8% |
[ 22.5% - 23.0% ] 22.68% | 17,765 | 1.5% |
[ 23.0% - 23.5% ] 23.16% | 14,475 | 1.9% |
[ 23.5% - 24.0% ] 23.67% | 11,448 | 7.6% |
[ 24.0% - 24.5% ] 24.22% | 4,934 | 5.0% |
[ 24.5% - 25.0% ] 24.71% | 24,233 | 1.4% |
[ 25.0% - 25.5% ] 25.25% | 29,606 | 4.2% |
[ 25.5% - 26.0% ] 25.59% | 5,714 | 1.4% |
[ 26.0% - 26.5% ] 26.15% | 76,994 | 0.65% |
[ 26.5% - 27.0% ] 26.89% | 24,981 | 1.6% |
[ 27.5% - 28.0% ] 27.75% | 6,026 | 3.9% |
[ 28.5% - 29.0% ] 28.92% | 35,121 | 3.2% |
[ 29.0% - 29.5% ] 29.43% | 2,606 | 5.3% |
[ 30.0% - 30.5% ] 30.36% | 15,723 | 5.6% |
[ 32.0% - 32.5% ] 32.41% | 13,932 | 4.7% |
[ 32.5% - 33.0% ] 32.87% | 1,363 | 8.3% |
[ 37.0% - 37.5% ] 37.12% | 23,676 | 1.7% |
[ 47.0% - 47.5% ] 47.14% | 1,504 | 1.4% |
[ 51.5% - 52.0% ] 51.56% | 256 | 28.6% |
[ 57.5% - 58.0% ] 57.88% | 387 | 28.6% |