Iroquois College, 1 year or more

COMPARE

Iroquois
Race
Ancestry
AfghanAfricanAlaska NativeAlaskan AthabascanAlbanianAleutAlsatianAmericanApacheArabArapahoArgentineanArmenianAssyrian/Chaldean/SyriacAustralianAustrianBahamianBangladeshiBarbadianBasqueBelgianBelizeanBermudanBhutaneseBlackfeetBolivianBrazilianBritishBritish West IndianBulgarianBurmeseCajunCambodianCanadianCape VerdeanCarpatho RusynCelticCentral AmericanCentral American IndianCherokeeCheyenneChickasawChileanChineseChippewaChoctawColombianColvilleComancheCosta RicanCreeCreekCroatianCrowCubanCypriotCzechCzechoslovakianDanishDelawareDominicanDutchDutch West IndianEastern EuropeanEcuadorianEgyptianEnglishEstonianEthiopianEuropeanFijianFilipinoFinnishFrenchFrench American IndianFrench CanadianGermanGerman RussianGhanaianGreekGuamanian/ChamorroGuatemalanGuyaneseHaitianHmongHonduranHopiHoumaHungarianIcelanderIndian (Asian)IndonesianInupiatIranianIraqiIrishIroquoisIsraeliItalianJamaicanJapaneseJordanianKenyanKiowaKoreanLaotianLatvianLebaneseLiberianLithuanianLumbeeLuxembourgerMacedonianMalaysianMalteseMarshalleseMenomineeMexicanMexican American IndianMongolianMoroccanNative HawaiianNavajoNepaleseNew ZealanderNicaraguanNigerianNorthern EuropeanNorwegianOkinawanOsageOttawaPaiutePakistaniPalestinianPanamanianParaguayanPennsylvania GermanPeruvianPimaPolishPortuguesePotawatomiPuebloPuerto RicanPuget Sound SalishRomanianRussianSalvadoranSamoanScandinavianScotch-IrishScottishSeminoleSenegaleseSerbianShoshoneSierra LeoneanSiouxSlavicSlovakSloveneSomaliSouth AfricanSouth AmericanSouth American IndianSoviet UnionSpaniardSpanishSpanish AmericanSpanish American IndianSri LankanSubsaharan AfricanSudaneseSwedishSwissSyrianTaiwaneseThaiTlingit-HaidaTohono O'OdhamTonganTrinidadian and TobagonianTsimshianTurkishU.S. Virgin IslanderUgandanUkrainianUruguayanUteVenezuelanVietnameseWelshWest IndianYakamaYaquiYugoslavianYumanYup'ikZimbabwean
Immigration
NonimmigrantsImmigrantsAfghanistanAfricaAlbaniaArgentinaArmeniaAsiaAustraliaAustriaBahamasBangladeshBarbadosBelarusBelgiumBelizeBoliviaBosnia and HerzegovinaBrazilBulgariaBurma/MyanmarCabo VerdeCambodiaCameroonCanadaCaribbeanCentral AmericaChileChinaColombiaCongoCosta RicaCroatiaCubaCzechoslovakiaDenmarkDominicaDominican RepublicEastern AfricaEastern AsiaEastern EuropeEcuadorEgyptEl SalvadorEnglandEritreaEthiopiaEuropeFijiFranceGermanyGhanaGreeceGrenadaGuatemalaGuyanaHaitiHondurasHong KongHungaryIndiaIndonesiaIranIraqIrelandIsraelItalyJamaicaJapanJordanKazakhstanKenyaKoreaKuwaitLaosLatin AmericaLatviaLebanonLiberiaLithuaniaMalaysiaMexicoMicronesiaMiddle AfricaMoldovaMoroccoNepalNetherlandsNicaraguaNigeriaNorth AmericaNorth MacedoniaNorthern AfricaNorthern EuropeNorwayOceaniaPakistanPanamaPeruPhilippinesPolandPortugalRomaniaRussiaSaudi ArabiaScotlandSenegalSerbiaSierra LeoneSingaporeSomaliaSouth AfricaSouth AmericaSouth Central AsiaSouth Eastern AsiaSouthern EuropeSpainSri LankaSt. Vincent and the GrenadinesSudanSwedenSwitzerlandSyriaTaiwanThailandTrinidad and TobagoTurkeyUgandaUkraineUruguayUzbekistanVenezuelaVietnamWest IndiesWestern AfricaWestern AsiaWestern EuropeYemenZaireZimbabweAzores
Select to Compare
Race
Ancestry
AfghanAfricanAlaska NativeAlaskan AthabascanAlbanianAleutAlsatianAmericanApacheArabArapahoArgentineanArmenianAssyrian/Chaldean/SyriacAustralianAustrianBahamianBangladeshiBarbadianBasqueBelgianBelizeanBermudanBhutaneseBlackfeetBolivianBrazilianBritishBritish West IndianBulgarianBurmeseCajunCambodianCanadianCape VerdeanCarpatho RusynCelticCentral AmericanCentral American IndianCherokeeCheyenneChickasawChileanChineseChippewaChoctawColombianColvilleComancheCosta RicanCreeCreekCroatianCrowCubanCypriotCzechCzechoslovakianDanishDelawareDominicanDutchDutch West IndianEastern EuropeanEcuadorianEgyptianEnglishEstonianEthiopianEuropeanFijianFilipinoFinnishFrenchFrench American IndianFrench CanadianGermanGerman RussianGhanaianGreekGuamanian/ChamorroGuatemalanGuyaneseHaitianHmongHonduranHopiHoumaHungarianIcelanderIndian (Asian)IndonesianInupiatIranianIraqiIrishIsraeliItalianJamaicanJapaneseJordanianKenyanKiowaKoreanLaotianLatvianLebaneseLiberianLithuanianLumbeeLuxembourgerMacedonianMalaysianMalteseMarshalleseMenomineeMexicanMexican American IndianMongolianMoroccanNative HawaiianNavajoNepaleseNew ZealanderNicaraguanNigerianNorthern EuropeanNorwegianOkinawanOsageOttawaPaiutePakistaniPalestinianPanamanianParaguayanPennsylvania GermanPeruvianPimaPolishPortuguesePotawatomiPuebloPuerto RicanPuget Sound SalishRomanianRussianSalvadoranSamoanScandinavianScotch-IrishScottishSeminoleSenegaleseSerbianShoshoneSierra LeoneanSiouxSlavicSlovakSloveneSomaliSouth AfricanSouth AmericanSouth American IndianSoviet UnionSpaniardSpanishSpanish AmericanSpanish American IndianSri LankanSubsaharan AfricanSudaneseSwedishSwissSyrianTaiwaneseThaiTlingit-HaidaTohono O'OdhamTonganTrinidadian and TobagonianTsimshianTurkishU.S. Virgin IslanderUgandanUkrainianUruguayanUteVenezuelanVietnameseWelshWest IndianYakamaYaquiYugoslavianYumanYup'ikZimbabwean
Immigration
NonimmigrantsImmigrantsAfghanistanAfricaAlbaniaArgentinaArmeniaAsiaAustraliaAustriaBahamasBangladeshBarbadosBelarusBelgiumBelizeBoliviaBosnia and HerzegovinaBrazilBulgariaBurma/MyanmarCabo VerdeCambodiaCameroonCanadaCaribbeanCentral AmericaChileChinaColombiaCongoCosta RicaCroatiaCubaCzechoslovakiaDenmarkDominicaDominican RepublicEastern AfricaEastern AsiaEastern EuropeEcuadorEgyptEl SalvadorEnglandEritreaEthiopiaEuropeFijiFranceGermanyGhanaGreeceGrenadaGuatemalaGuyanaHaitiHondurasHong KongHungaryIndiaIndonesiaIranIraqIrelandIsraelItalyJamaicaJapanJordanKazakhstanKenyaKoreaKuwaitLaosLatin AmericaLatviaLebanonLiberiaLithuaniaMalaysiaMexicoMicronesiaMiddle AfricaMoldovaMoroccoNepalNetherlandsNicaraguaNigeriaNorth AmericaNorth MacedoniaNorthern AfricaNorthern EuropeNorwayOceaniaPakistanPanamaPeruPhilippinesPolandPortugalRomaniaRussiaSaudi ArabiaScotlandSenegalSerbiaSierra LeoneSingaporeSomaliaSouth AfricaSouth AmericaSouth Central AsiaSouth Eastern AsiaSouthern EuropeSpainSri LankaSt. Vincent and the GrenadinesSudanSwedenSwitzerlandSyriaTaiwanThailandTrinidad and TobagoTurkeyUgandaUkraineUruguayUzbekistanVenezuelaVietnamWest IndiesWestern AfricaWestern AsiaWestern EuropeYemenZaireZimbabweAzores
College, 1 year or more
Income
Poverty
Unemployment
Labor Participation
Family Structure
Vehicle Availability
Education Level
Disability

Iroquois College, 1 year or more
Tragic

56.2%
COLLEGE, 1 YEAR OR MORE
1.7/ 100
METRIC RATING
236th/ 347
METRIC RANK

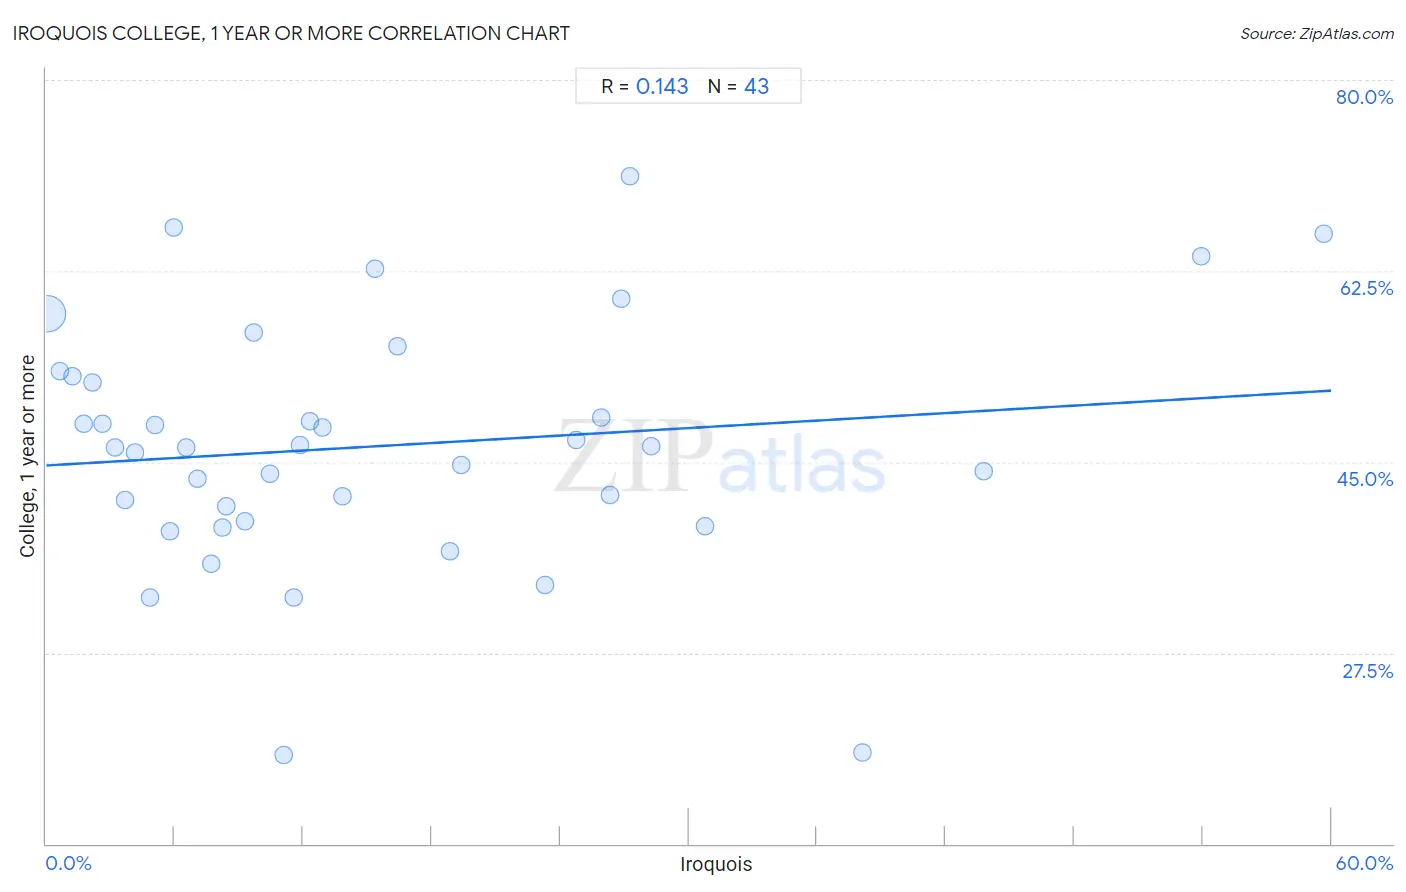
Iroquois College, 1 year or more Correlation Chart

The statistical analysis conducted on geographies consisting of 207,308,587 people shows a poor positive correlation between the proportion of Iroquois and percentage of population with at least college, 1 year or more education in the United States with a correlation coefficient (R) of 0.143 and weighted average of 56.2%. On average, for every 1% (one percent) increase in Iroquois within a typical geography, there is an increase of 0.11% in percentage of population with at least college, 1 year or more education.
Iroquois College, 1 year or more
It is essential to understand that the correlation between the percentage of Iroquois and percentage of population with at least college, 1 year or more education does not imply a direct cause-and-effect relationship. It remains uncertain whether the presence of Iroquois influences an upward or downward trend in the level of percentage of population with at least college, 1 year or more education within an area, or if Iroquois simply ended up residing in those areas with higher or lower levels of percentage of population with at least college, 1 year or more education due to other factors.

Demographics Similar to Iroquois by College, 1 year or more

In terms of college, 1 year or more, the demographic groups most similar to Iroquois are Spanish American (56.3%, a difference of 0.050%), West Indian (56.3%, a difference of 0.050%), Samoan (56.2%, a difference of 0.11%), Barbadian (56.0%, a difference of 0.38%), and Nonimmigrants (56.5%, a difference of 0.50%).
DemographicsRating | RankCollege, 1 year or more
Cree
3.6
/100
|
#229
Tragic
56.8%
Liberians
3.1
/100
|
#230
Tragic
56.7%
Immigrants from Burma/Myanmar
2.7
/100
|
#231
Tragic
56.6%
Immigrants from Bangladesh
2.6
/100
|
#232
Tragic
56.6%
Nonimmigrants
2.5
/100
|
#233
Tragic
56.5%
Spanish Americans
1.8
/100
|
#234
Tragic
56.3%
West Indians
1.8
/100
|
#235
Tragic
56.3%
Iroquois
1.7
/100
|
#236
Tragic
56.2%
Samoans
1.6
/100
|
#237
Tragic
56.2%
Barbadians
1.3
/100
|
#238
Tragic
56.0%
Puget Sound Salish
1.1
/100
|
#239
Tragic
55.9%
Trinidadians and Tobagonians
1.1
/100
|
#240
Tragic
55.8%
French American Indians
1.0
/100
|
#241
Tragic
55.8%
Marshallese
1.0
/100
|
#242
Tragic
55.8%
Osage
1.0
/100
|
#243
Tragic
55.8%

Iroquois College, 1 year or more Correlation Summary

MeasurementIroquois DataCollege, 1 year or more Data
Minimum0.054%18.2%
Maximum59.6%71.2%
Range59.6%53.0%
Mean15.4%46.4%
Median11.1%46.3%
Interquartile 25% (IQ1)5.1%39.6%
Interquartile 75% (IQ3)24.7%52.8%
Interquartile Range (IQR)19.7%13.3%
Standard Deviation (Sample)14.1%11.2%
Standard Deviation (Population)13.9%11.1%

Correlation Details

Iroquois PercentileSample SizeCollege, 1 year or more
[
0.0%
-
0.5%
]
0.054%
203,117,35858.6%
[
0.5%
-
1.0%
]
0.65%
2,863,11753.3%
[
1.0%
-
1.5%
]
1.21%
581,97452.8%
[
1.5%
-
2.0%
]
1.73%
221,78148.5%
[
2.0%
-
2.5%
]
2.14%
295,75252.3%
[
2.5%
-
3.0%
]
2.61%
36,56748.5%
[
3.0%
-
3.5%
]
3.19%
53,41746.3%
[
3.5%
-
4.0%
]
3.67%
39,28941.4%
[
4.0%
-
4.5%
]
4.15%
11,47445.9%
[
4.5%
-
5.0%
]
4.82%
5,62232.6%
[
5.0%
-
5.5%
]
5.07%
2,21148.4%
[
5.5%
-
6.0%
]
5.76%
2,48138.6%
[
5.5%
-
6.0%
]
5.96%
10,56166.5%
[
6.5%
-
7.0%
]
6.56%
83946.3%
[
7.0%
-
7.5%
]
7.08%
1,56843.5%
[
7.5%
-
8.0%
]
7.72%
27235.7%
[
8.0%
-
8.5%
]
8.25%
1,34539.0%
[
8.0%
-
8.5%
]
8.43%
35641.0%
[
9.0%
-
9.5%
]
9.28%
6,18639.6%
[
9.5%
-
10.0%
]
9.67%
12,36356.9%
[
10.0%
-
10.5%
]
10.46%
4,36743.9%
[
11.0%
-
11.5%
]
11.11%
3618.2%
[
11.5%
-
12.0%
]
11.58%
1,09732.6%
[
11.5%
-
12.0%
]
11.84%
1,68146.5%
[
12.0%
-
12.5%
]
12.32%
2,20748.7%
[
12.5%
-
13.0%
]
12.90%
1,20248.1%
[
13.5%
-
14.0%
]
13.82%
2,07641.9%
[
15.0%
-
15.5%
]
15.37%
88562.6%
[
16.0%
-
16.5%
]
16.39%
1,03755.6%
[
18.5%
-
19.0%
]
18.85%
12,80536.8%
[
19.0%
-
19.5%
]
19.37%
50644.7%
[
23.0%
-
23.5%
]
23.26%
2,21833.7%
[
24.5%
-
25.0%
]
24.74%
2,91047.0%
[
25.5%
-
26.0%
]
25.91%
65649.1%
[
26.0%
-
26.5%
]
26.31%
1,60041.9%
[
26.5%
-
27.0%
]
26.83%
20560.0%
[
27.0%
-
27.5%
]
27.27%
13271.2%
[
28.0%
-
28.5%
]
28.26%
13846.5%
[
30.5%
-
31.0%
]
30.77%
11739.1%
[
38.0%
-
38.5%
]
38.12%
16018.3%
[
43.5%
-
44.0%
]
43.75%
12844.1%
[
53.5%
-
54.0%
]
53.93%
4,22263.9%
[
59.5%
-
60.0%
]
59.63%
3,66966.0%