Iroquois 3 or more Vehicles in Household

COMPARE

Iroquois
Race
Ancestry
AfghanAfricanAlaska NativeAlaskan AthabascanAlbanianAleutAlsatianAmericanApacheArabArapahoArgentineanArmenianAssyrian/Chaldean/SyriacAustralianAustrianBahamianBangladeshiBarbadianBasqueBelgianBelizeanBermudanBhutaneseBlackfeetBolivianBrazilianBritishBritish West IndianBulgarianBurmeseCajunCambodianCanadianCape VerdeanCarpatho RusynCelticCentral AmericanCentral American IndianCherokeeCheyenneChickasawChileanChineseChippewaChoctawColombianColvilleComancheCosta RicanCreeCreekCroatianCrowCubanCypriotCzechCzechoslovakianDanishDelawareDominicanDutchDutch West IndianEastern EuropeanEcuadorianEgyptianEnglishEstonianEthiopianEuropeanFijianFilipinoFinnishFrenchFrench American IndianFrench CanadianGermanGerman RussianGhanaianGreekGuamanian/ChamorroGuatemalanGuyaneseHaitianHmongHonduranHopiHoumaHungarianIcelanderIndian (Asian)IndonesianInupiatIranianIraqiIrishIroquoisIsraeliItalianJamaicanJapaneseJordanianKenyanKiowaKoreanLaotianLatvianLebaneseLiberianLithuanianLumbeeLuxembourgerMacedonianMalaysianMalteseMarshalleseMenomineeMexicanMexican American IndianMongolianMoroccanNative HawaiianNavajoNepaleseNew ZealanderNicaraguanNigerianNorthern EuropeanNorwegianOkinawanOsageOttawaPaiutePakistaniPalestinianPanamanianParaguayanPennsylvania GermanPeruvianPimaPolishPortuguesePotawatomiPuebloPuerto RicanPuget Sound SalishRomanianRussianSalvadoranSamoanScandinavianScotch-IrishScottishSeminoleSenegaleseSerbianShoshoneSierra LeoneanSiouxSlavicSlovakSloveneSomaliSouth AfricanSouth AmericanSouth American IndianSoviet UnionSpaniardSpanishSpanish AmericanSpanish American IndianSri LankanSubsaharan AfricanSudaneseSwedishSwissSyrianTaiwaneseThaiTlingit-HaidaTohono O'OdhamTonganTrinidadian and TobagonianTsimshianTurkishU.S. Virgin IslanderUgandanUkrainianUruguayanUteVenezuelanVietnameseWelshWest IndianYakamaYaquiYugoslavianYumanYup'ikZimbabwean
Immigration
NonimmigrantsImmigrantsAfghanistanAfricaAlbaniaArgentinaArmeniaAsiaAustraliaAustriaBahamasBangladeshBarbadosBelarusBelgiumBelizeBoliviaBosnia and HerzegovinaBrazilBulgariaBurma/MyanmarCabo VerdeCambodiaCameroonCanadaCaribbeanCentral AmericaChileChinaColombiaCongoCosta RicaCroatiaCubaCzechoslovakiaDenmarkDominicaDominican RepublicEastern AfricaEastern AsiaEastern EuropeEcuadorEgyptEl SalvadorEnglandEritreaEthiopiaEuropeFijiFranceGermanyGhanaGreeceGrenadaGuatemalaGuyanaHaitiHondurasHong KongHungaryIndiaIndonesiaIranIraqIrelandIsraelItalyJamaicaJapanJordanKazakhstanKenyaKoreaKuwaitLaosLatin AmericaLatviaLebanonLiberiaLithuaniaMalaysiaMexicoMicronesiaMiddle AfricaMoldovaMoroccoNepalNetherlandsNicaraguaNigeriaNorth AmericaNorth MacedoniaNorthern AfricaNorthern EuropeNorwayOceaniaPakistanPanamaPeruPhilippinesPolandPortugalRomaniaRussiaSaudi ArabiaScotlandSenegalSerbiaSierra LeoneSingaporeSomaliaSouth AfricaSouth AmericaSouth Central AsiaSouth Eastern AsiaSouthern EuropeSpainSri LankaSt. Vincent and the GrenadinesSudanSwedenSwitzerlandSyriaTaiwanThailandTrinidad and TobagoTurkeyUgandaUkraineUruguayUzbekistanVenezuelaVietnamWest IndiesWestern AfricaWestern AsiaWestern EuropeYemenZaireZimbabweAzores
Select to Compare
Race
Ancestry
AfghanAfricanAlaska NativeAlaskan AthabascanAlbanianAleutAlsatianAmericanApacheArabArapahoArgentineanArmenianAssyrian/Chaldean/SyriacAustralianAustrianBahamianBangladeshiBarbadianBasqueBelgianBelizeanBermudanBhutaneseBlackfeetBolivianBrazilianBritishBritish West IndianBulgarianBurmeseCajunCambodianCanadianCape VerdeanCarpatho RusynCelticCentral AmericanCentral American IndianCherokeeCheyenneChickasawChileanChineseChippewaChoctawColombianColvilleComancheCosta RicanCreeCreekCroatianCrowCubanCypriotCzechCzechoslovakianDanishDelawareDominicanDutchDutch West IndianEastern EuropeanEcuadorianEgyptianEnglishEstonianEthiopianEuropeanFijianFilipinoFinnishFrenchFrench American IndianFrench CanadianGermanGerman RussianGhanaianGreekGuamanian/ChamorroGuatemalanGuyaneseHaitianHmongHonduranHopiHoumaHungarianIcelanderIndian (Asian)IndonesianInupiatIranianIraqiIrishIsraeliItalianJamaicanJapaneseJordanianKenyanKiowaKoreanLaotianLatvianLebaneseLiberianLithuanianLumbeeLuxembourgerMacedonianMalaysianMalteseMarshalleseMenomineeMexicanMexican American IndianMongolianMoroccanNative HawaiianNavajoNepaleseNew ZealanderNicaraguanNigerianNorthern EuropeanNorwegianOkinawanOsageOttawaPaiutePakistaniPalestinianPanamanianParaguayanPennsylvania GermanPeruvianPimaPolishPortuguesePotawatomiPuebloPuerto RicanPuget Sound SalishRomanianRussianSalvadoranSamoanScandinavianScotch-IrishScottishSeminoleSenegaleseSerbianShoshoneSierra LeoneanSiouxSlavicSlovakSloveneSomaliSouth AfricanSouth AmericanSouth American IndianSoviet UnionSpaniardSpanishSpanish AmericanSpanish American IndianSri LankanSubsaharan AfricanSudaneseSwedishSwissSyrianTaiwaneseThaiTlingit-HaidaTohono O'OdhamTonganTrinidadian and TobagonianTsimshianTurkishU.S. Virgin IslanderUgandanUkrainianUruguayanUteVenezuelanVietnameseWelshWest IndianYakamaYaquiYugoslavianYumanYup'ikZimbabwean
Immigration
NonimmigrantsImmigrantsAfghanistanAfricaAlbaniaArgentinaArmeniaAsiaAustraliaAustriaBahamasBangladeshBarbadosBelarusBelgiumBelizeBoliviaBosnia and HerzegovinaBrazilBulgariaBurma/MyanmarCabo VerdeCambodiaCameroonCanadaCaribbeanCentral AmericaChileChinaColombiaCongoCosta RicaCroatiaCubaCzechoslovakiaDenmarkDominicaDominican RepublicEastern AfricaEastern AsiaEastern EuropeEcuadorEgyptEl SalvadorEnglandEritreaEthiopiaEuropeFijiFranceGermanyGhanaGreeceGrenadaGuatemalaGuyanaHaitiHondurasHong KongHungaryIndiaIndonesiaIranIraqIrelandIsraelItalyJamaicaJapanJordanKazakhstanKenyaKoreaKuwaitLaosLatin AmericaLatviaLebanonLiberiaLithuaniaMalaysiaMexicoMicronesiaMiddle AfricaMoldovaMoroccoNepalNetherlandsNicaraguaNigeriaNorth AmericaNorth MacedoniaNorthern AfricaNorthern EuropeNorwayOceaniaPakistanPanamaPeruPhilippinesPolandPortugalRomaniaRussiaSaudi ArabiaScotlandSenegalSerbiaSierra LeoneSingaporeSomaliaSouth AfricaSouth AmericaSouth Central AsiaSouth Eastern AsiaSouthern EuropeSpainSri LankaSt. Vincent and the GrenadinesSudanSwedenSwitzerlandSyriaTaiwanThailandTrinidad and TobagoTurkeyUgandaUkraineUruguayUzbekistanVenezuelaVietnamWest IndiesWestern AfricaWestern AsiaWestern EuropeYemenZaireZimbabweAzores
3 or more Vehicles in Household
Income
Poverty
Unemployment
Labor Participation
Family Structure
Vehicle Availability
Education Level
Disability

Iroquois 3 or more Vehicles in Household
Average

19.4%
3+ VEHICLES AVAILABLE
46.0/ 100
METRIC RATING
176th/ 347
METRIC RANK

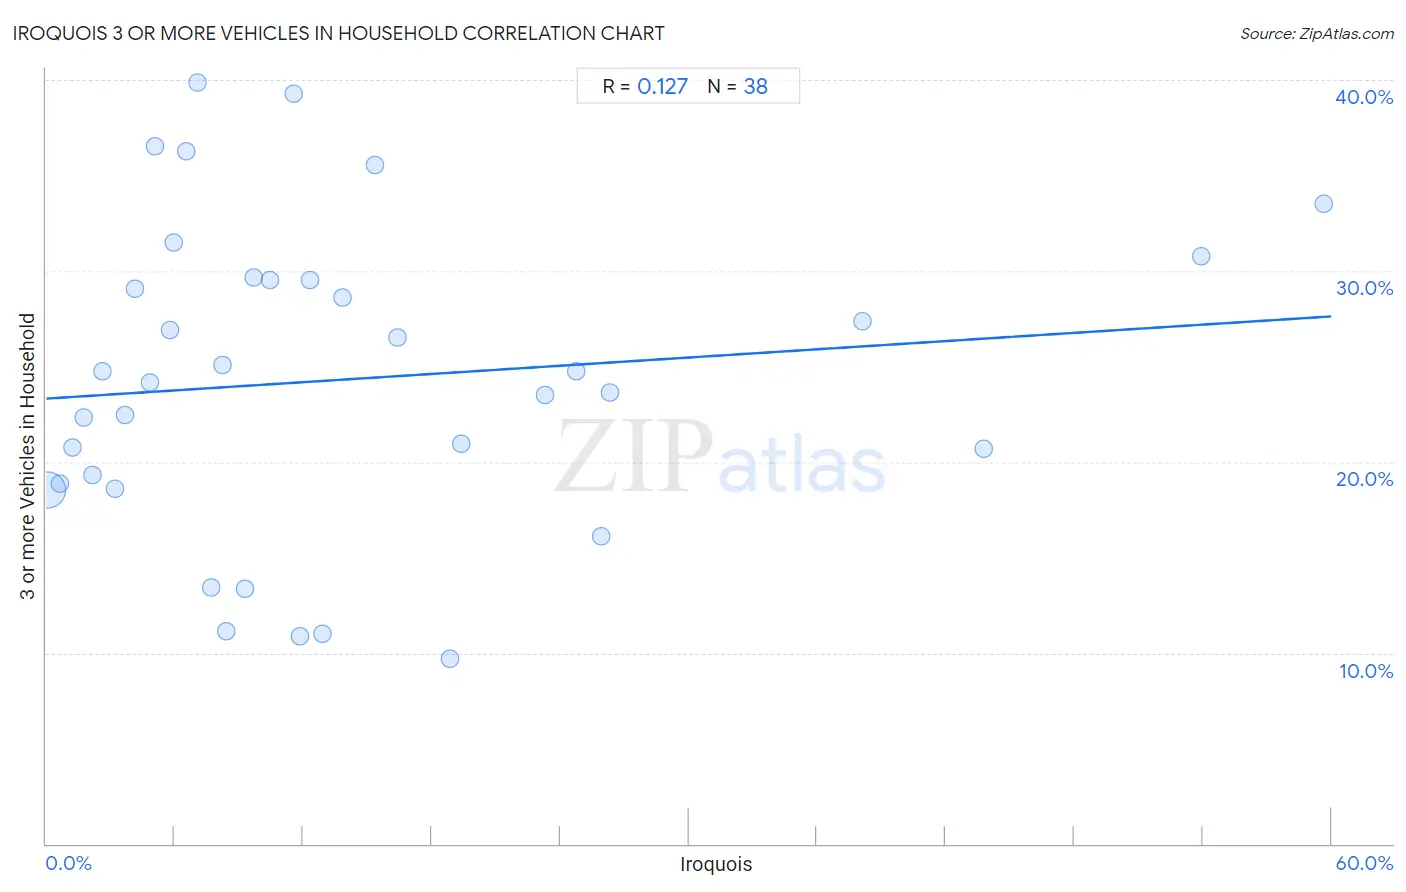
Iroquois 3 or more Vehicles in Household Correlation Chart

The statistical analysis conducted on geographies consisting of 207,225,565 people shows a poor positive correlation between the proportion of Iroquois and percentage of households with 3 or more vehicles available in the United States with a correlation coefficient (R) of 0.127 and weighted average of 19.4%. On average, for every 1% (one percent) increase in Iroquois within a typical geography, there is an increase of 0.072% in percentage of households with 3 or more vehicles available.
Iroquois 3 or more Vehicles in Household
It is essential to understand that the correlation between the percentage of Iroquois and percentage of households with 3 or more vehicles available does not imply a direct cause-and-effect relationship. It remains uncertain whether the presence of Iroquois influences an upward or downward trend in the level of percentage of households with 3 or more vehicles available within an area, or if Iroquois simply ended up residing in those areas with higher or lower levels of percentage of households with 3 or more vehicles available due to other factors.

Demographics Similar to Iroquois by 3 or more Vehicles in Household

In terms of 3 or more vehicles in household, the demographic groups most similar to Iroquois are Syrian (19.5%, a difference of 0.070%), Immigrants from South Africa (19.5%, a difference of 0.30%), Immigrants from Northern Europe (19.5%, a difference of 0.32%), Kiowa (19.5%, a difference of 0.37%), and Immigrants from Peru (19.4%, a difference of 0.38%).
DemographicsRating | Rank3 or more Vehicles in Household
Immigrants from Denmark
57.6
/100
|
#169
Average
19.6%
Iraqis
56.0
/100
|
#170
Average
19.6%
Immigrants from Western Europe
53.2
/100
|
#171
Average
19.5%
Kiowa
50.9
/100
|
#172
Average
19.5%
Immigrants from Northern Europe
50.2
/100
|
#173
Average
19.5%
Immigrants from South Africa
50.0
/100
|
#174
Average
19.5%
Syrians
47.0
/100
|
#175
Average
19.5%
Iroquois
46.0
/100
|
#176
Average
19.4%
Immigrants from Peru
41.1
/100
|
#177
Average
19.4%
Immigrants from Syria
40.3
/100
|
#178
Average
19.4%
Immigrants from South Central Asia
38.9
/100
|
#179
Fair
19.3%
South Africans
37.5
/100
|
#180
Fair
19.3%
Romanians
37.1
/100
|
#181
Fair
19.3%
Cubans
36.6
/100
|
#182
Fair
19.3%
Cajuns
36.0
/100
|
#183
Fair
19.3%

Iroquois 3 or more Vehicles in Household Correlation Summary

MeasurementIroquois Data3 or more Vehicles in Household Data
Minimum0.054%9.7%
Maximum59.6%39.9%
Range59.6%30.2%
Mean14.1%24.3%
Median9.5%24.4%
Interquartile 25% (IQ1)4.8%18.9%
Interquartile 75% (IQ3)18.9%29.5%
Interquartile Range (IQR)14.0%10.6%
Standard Deviation (Sample)14.3%8.1%
Standard Deviation (Population)14.1%8.0%

Correlation Details

Iroquois PercentileSample Size3 or more Vehicles in Household
[
0.0%
-
0.5%
]
0.054%
203,054,55218.5%
[
0.5%
-
1.0%
]
0.65%
2,845,72018.9%
[
1.0%
-
1.5%
]
1.21%
581,18420.7%
[
1.5%
-
2.0%
]
1.73%
221,78122.4%
[
2.0%
-
2.5%
]
2.14%
295,75219.3%
[
2.5%
-
3.0%
]
2.61%
35,43724.7%
[
3.0%
-
3.5%
]
3.19%
53,41718.6%
[
3.5%
-
4.0%
]
3.67%
39,28922.5%
[
4.0%
-
4.5%
]
4.14%
11,24429.1%
[
4.5%
-
5.0%
]
4.82%
5,58124.1%
[
5.0%
-
5.5%
]
5.07%
2,21136.5%
[
5.5%
-
6.0%
]
5.76%
2,48126.9%
[
5.5%
-
6.0%
]
5.96%
10,56131.5%
[
6.5%
-
7.0%
]
6.56%
83936.3%
[
7.0%
-
7.5%
]
7.08%
1,56839.9%
[
7.5%
-
8.0%
]
7.72%
27213.4%
[
8.0%
-
8.5%
]
8.25%
1,34525.0%
[
8.0%
-
8.5%
]
8.43%
35611.1%
[
9.0%
-
9.5%
]
9.28%
6,18613.4%
[
9.5%
-
10.0%
]
9.67%
12,36329.6%
[
10.0%
-
10.5%
]
10.46%
4,36729.5%
[
11.5%
-
12.0%
]
11.58%
1,09739.3%
[
11.5%
-
12.0%
]
11.84%
1,68110.9%
[
12.0%
-
12.5%
]
12.32%
2,20729.5%
[
12.5%
-
13.0%
]
12.90%
1,20211.0%
[
13.5%
-
14.0%
]
13.82%
2,07628.6%
[
15.0%
-
15.5%
]
15.37%
88535.5%
[
16.0%
-
16.5%
]
16.39%
1,03726.5%
[
18.5%
-
19.0%
]
18.85%
12,8059.7%
[
19.0%
-
19.5%
]
19.37%
50621.0%
[
23.0%
-
23.5%
]
23.26%
2,21823.5%
[
24.5%
-
25.0%
]
24.74%
2,91024.7%
[
25.5%
-
26.0%
]
25.91%
65616.1%
[
26.0%
-
26.5%
]
26.31%
1,60023.7%
[
38.0%
-
38.5%
]
38.12%
16027.4%
[
43.5%
-
44.0%
]
43.75%
12820.7%
[
53.5%
-
54.0%
]
53.93%
4,22230.8%
[
59.5%
-
60.0%
]
59.63%
3,66933.5%